
|
|||||
|
 | |
| |
| |
| |
| |
| |
|
Gene: SSRP1 |
Gene summary for SSRP1 |
| Gene information | Species | Human | Gene symbol | SSRP1 | Gene ID | 6749 |
| Gene name | structure specific recognition protein 1 | |
| Gene Alias | FACT | |
| Cytomap | 11q12.1 | |
| Gene Type | protein-coding | GO ID | GO:0006139 | UniProtAcc | A0A024R4Z6 |
Top |
Malignant transformation analysis |
| Identification of the aberrant gene expression in precancerous and cancerous lesions by comparing the gene expression of stem-like cells in diseased tissues with normal stem cells |
| Entrez ID | Symbol | Replicates | Species | Organ | Tissue | Adj P-value | Log2FC | Malignancy |
| 6749 | SSRP1 | PTC01 | Human | Thyroid | PTC | 1.25e-13 | 2.84e-01 | 0.1899 |
| 6749 | SSRP1 | PTC04 | Human | Thyroid | PTC | 1.39e-09 | 1.77e-01 | 0.1927 |
| 6749 | SSRP1 | PTC05 | Human | Thyroid | PTC | 6.76e-16 | 4.81e-01 | 0.2065 |
| 6749 | SSRP1 | PTC06 | Human | Thyroid | PTC | 3.41e-26 | 4.94e-01 | 0.2057 |
| 6749 | SSRP1 | PTC07 | Human | Thyroid | PTC | 1.54e-26 | 4.86e-01 | 0.2044 |
| 6749 | SSRP1 | ATC09 | Human | Thyroid | ATC | 5.54e-15 | 5.17e-01 | 0.2871 |
| 6749 | SSRP1 | ATC11 | Human | Thyroid | ATC | 1.03e-04 | 8.00e-01 | 0.3386 |
| 6749 | SSRP1 | ATC12 | Human | Thyroid | ATC | 7.03e-33 | 7.37e-01 | 0.34 |
| 6749 | SSRP1 | ATC13 | Human | Thyroid | ATC | 6.88e-31 | 6.44e-01 | 0.34 |
| 6749 | SSRP1 | ATC1 | Human | Thyroid | ATC | 1.85e-12 | 6.37e-01 | 0.2878 |
| 6749 | SSRP1 | ATC2 | Human | Thyroid | ATC | 7.72e-10 | 1.09e+00 | 0.34 |
| 6749 | SSRP1 | ATC3 | Human | Thyroid | ATC | 2.62e-04 | 4.81e-01 | 0.338 |
| 6749 | SSRP1 | ATC4 | Human | Thyroid | ATC | 6.57e-36 | 9.36e-01 | 0.34 |
| 6749 | SSRP1 | ATC5 | Human | Thyroid | ATC | 1.60e-30 | 7.34e-01 | 0.34 |
| Page: 1 2 3 4 5 6 7 8 9 |
| Tissue | Expression Dynamics | Abbreviation |
| Colorectum (GSE201348) |  | FAP: Familial adenomatous polyposis |
| CRC: Colorectal cancer | ||
| Colorectum (HTA11) |  | AD: Adenomas |
| SER: Sessile serrated lesions | ||
| MSI-H: Microsatellite-high colorectal cancer | ||
| MSS: Microsatellite stable colorectal cancer | ||
| Esophagus |  | ESCC: Esophageal squamous cell carcinoma |
| HGIN: High-grade intraepithelial neoplasias | ||
| LGIN: Low-grade intraepithelial neoplasias | ||
| Liver | 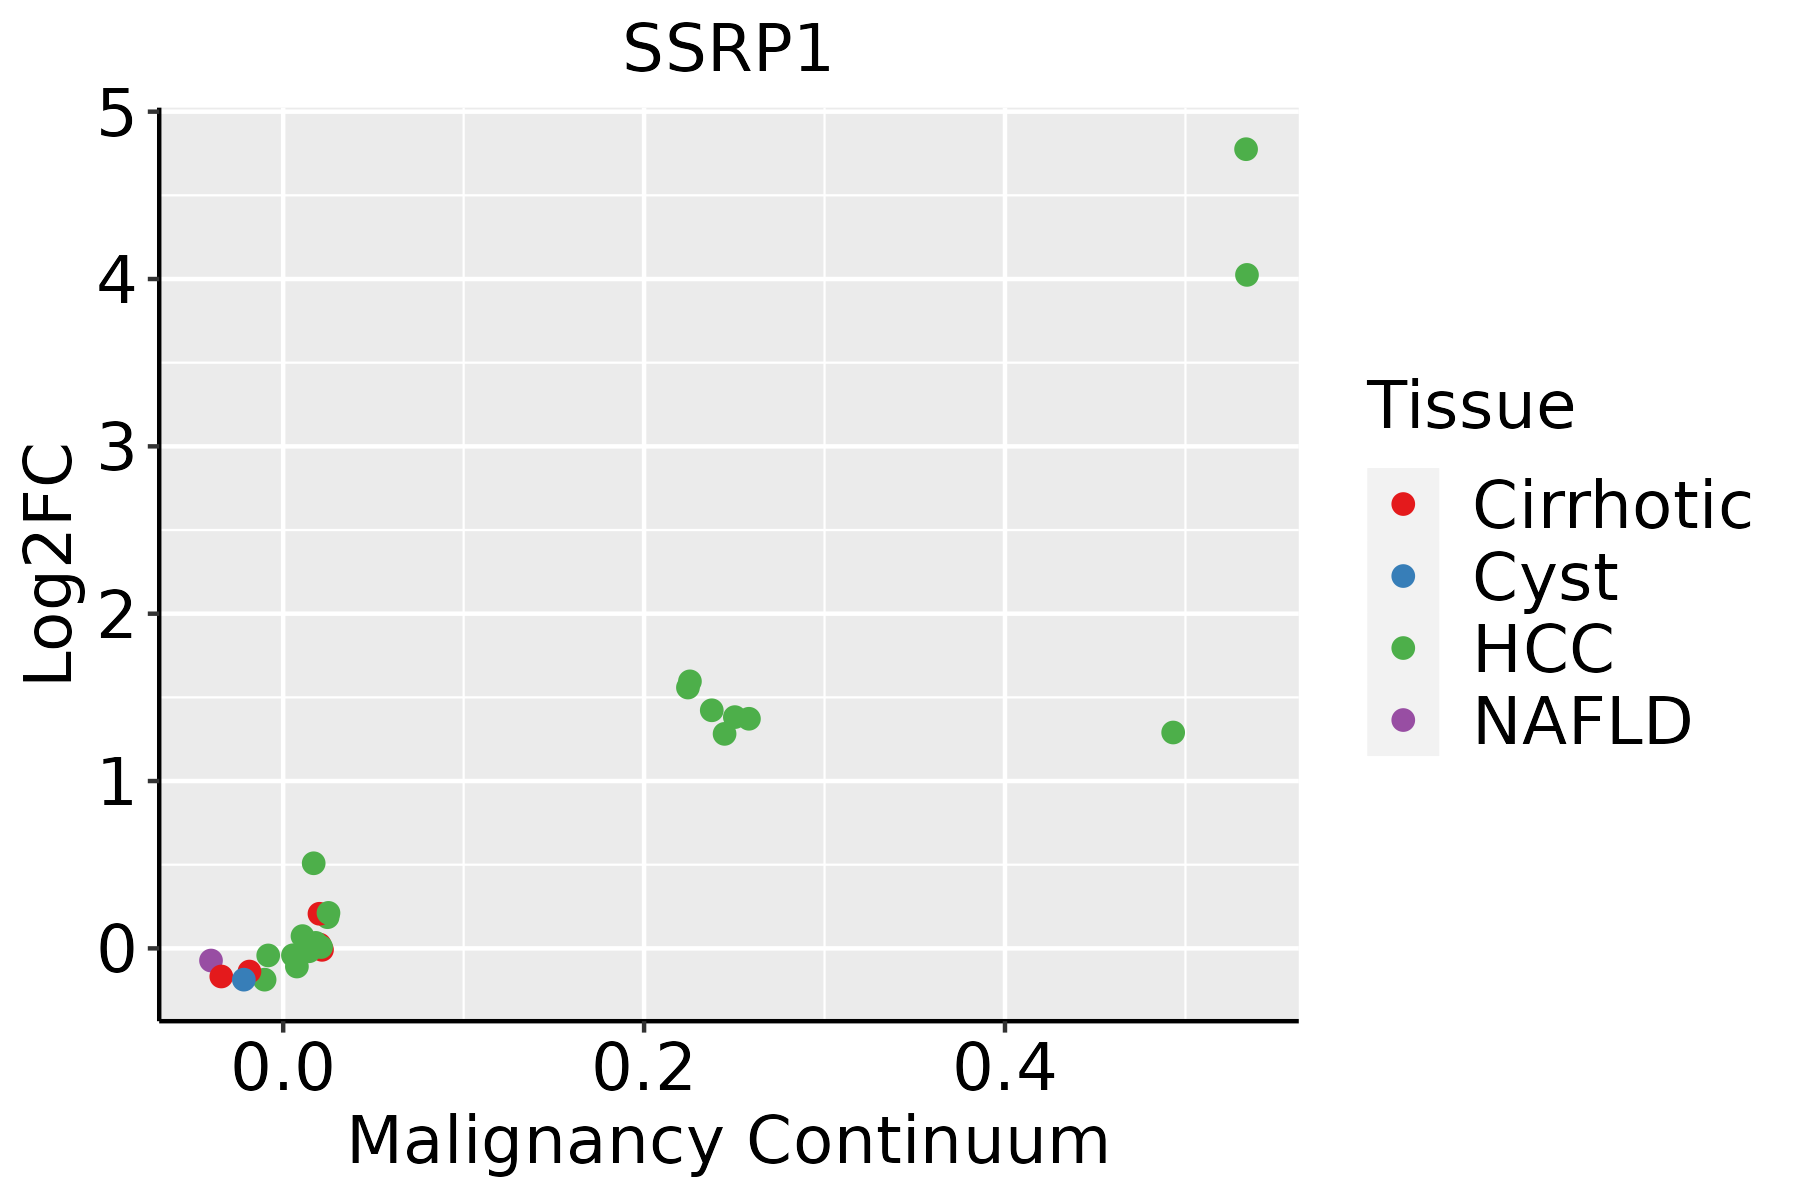 | HCC: Hepatocellular carcinoma |
| NAFLD: Non-alcoholic fatty liver disease | ||
| Oral Cavity |  | EOLP: Erosive Oral lichen planus |
| LP: leukoplakia | ||
| NEOLP: Non-erosive oral lichen planus | ||
| OSCC: Oral squamous cell carcinoma | ||
| Prostate |  | BPH: Benign Prostatic Hyperplasia |
| Skin |  | AK: Actinic keratosis |
| cSCC: Cutaneous squamous cell carcinoma | ||
| SCCIS:squamous cell carcinoma in situ | ||
| Thyroid |  | ATC: Anaplastic thyroid cancer |
| HT: Hashimoto's thyroiditis | ||
| PTC: Papillary thyroid cancer |
| ∗log2FC in expression of this searched gene in stem-like cells from each diseased tissue sample relative to stem-like cells in normal samples in each tissue plotted against the malignancy continuum. Samples are colored based on if they are from different disease stage. |
Top |
Malignant transformation related pathway analysis |
| Find out the enriched GO biological processes and KEGG pathways involved in transition from healthy to precancer to cancer |
| Tissue | Disease Stage | Enriched GO biological Processes |
| Colorectum | AD |  |
| Colorectum | SER |  |
| Colorectum | MSS |  |
| Colorectum | MSI-H |  |
| Colorectum | FAP |  |
| ∗Top 15 enriched GO BP terms are showed in the bar plot of each disease state in each tissue. Each row represents a significant GO biological process which is colored according to the -log10(p.adjust). |
| Page: 1 2 3 4 5 6 7 8 9 |
| GO ID | Tissue | Disease Stage | Description | Gene Ratio | Bg Ratio | pvalue | p.adjust | Count |
| GO:0006325 | Colorectum | AD | chromatin organization | 119/3918 | 409/18723 | 4.85e-05 | 8.33e-04 | 119 |
| GO:00063251 | Colorectum | SER | chromatin organization | 89/2897 | 409/18723 | 4.15e-04 | 6.17e-03 | 89 |
| GO:00063252 | Colorectum | MSS | chromatin organization | 107/3467 | 409/18723 | 7.22e-05 | 1.21e-03 | 107 |
| GO:0006260 | Colorectum | MSI-H | DNA replication | 31/1319 | 260/18723 | 2.83e-03 | 3.63e-02 | 31 |
| GO:00062604 | Esophagus | ESCC | DNA replication | 181/8552 | 260/18723 | 3.55e-15 | 2.05e-13 | 181 |
| GO:000632517 | Esophagus | ESCC | chromatin organization | 240/8552 | 409/18723 | 6.52e-08 | 1.14e-06 | 240 |
| GO:19022751 | Esophagus | ESCC | regulation of chromatin organization | 22/8552 | 33/18723 | 1.22e-02 | 4.08e-02 | 22 |
| GO:00062601 | Liver | HCC | DNA replication | 146/7958 | 260/18723 | 5.68e-06 | 7.02e-05 | 146 |
| GO:000632511 | Liver | HCC | chromatin organization | 206/7958 | 409/18723 | 7.23e-04 | 4.41e-03 | 206 |
| GO:00062603 | Oral cavity | OSCC | DNA replication | 159/7305 | 260/18723 | 3.25e-13 | 1.59e-11 | 159 |
| GO:000632510 | Oral cavity | OSCC | chromatin organization | 190/7305 | 409/18723 | 1.17e-03 | 5.97e-03 | 190 |
| GO:000626011 | Oral cavity | LP | DNA replication | 97/4623 | 260/18723 | 3.67e-06 | 7.75e-05 | 97 |
| GO:00063259 | Prostate | BPH | chromatin organization | 101/3107 | 409/18723 | 1.52e-05 | 1.94e-04 | 101 |
| GO:000632514 | Prostate | Tumor | chromatin organization | 104/3246 | 409/18723 | 2.02e-05 | 2.62e-04 | 104 |
| GO:000626012 | Skin | cSCC | DNA replication | 106/4864 | 260/18723 | 1.18e-07 | 2.77e-06 | 106 |
| GO:000632519 | Skin | cSCC | chromatin organization | 147/4864 | 409/18723 | 4.41e-06 | 6.52e-05 | 147 |
| GO:000632520 | Thyroid | PTC | chromatin organization | 183/5968 | 409/18723 | 2.55e-08 | 5.70e-07 | 183 |
| GO:00062606 | Thyroid | PTC | DNA replication | 114/5968 | 260/18723 | 3.09e-05 | 2.95e-04 | 114 |
| GO:0006325110 | Thyroid | ATC | chromatin organization | 189/6293 | 409/18723 | 6.40e-08 | 1.13e-06 | 189 |
| GO:000626013 | Thyroid | ATC | DNA replication | 124/6293 | 260/18723 | 1.58e-06 | 1.93e-05 | 124 |
| Page: 1 |
| Pathway ID | Tissue | Disease Stage | Description | Gene Ratio | Bg Ratio | pvalue | p.adjust | qvalue | Count |
| Page: 1 |
Top |
Cell-cell communication analysis |
| Identification of potential cell-cell interactions between two cell types and their ligand-receptor pairs for different disease states |
| Ligand | Receptor | LRpair | Pathway | Tissue | Disease Stage |
| Page: 1 |
Top |
Single-cell gene regulatory network inference analysis |
| Find out the significant the regulons (TFs) and the target genes of each regulon across cell types for different disease states |
| TF | Cell Type | Tissue | Disease Stage | Target Gene | RSS | Regulon Activity |
| SSRP1 | PERI | Esophagus | ESCC | UACA,CSRP2,CCR10, etc. | 2.59e-01 |  |
| SSRP1 | STM | Lung | AAH | HMGN1,PTMA,LMNB2, etc. | 2.96e-02 |  |
| SSRP1 | BAS | Lung | AAH | HMGN1,PTMA,LMNB2, etc. | 4.44e-16 | |
| SSRP1 | ABP | Lung | ADJ | HMGN1,PTMA,LMNB2, etc. | 1.94e-03 |  |
| SSRP1 | BAS | Lung | ADJ | HMGN1,PTMA,LMNB2, etc. | 5.07e-03 | |
| SSRP1 | STM | Lung | ADJ | HMGN1,PTMA,LMNB2, etc. | 1.46e-03 | |
| SSRP1 | BAS | Lung | AIS | HMGN1,PTMA,LMNB2, etc. | 0.00e+00 |  |
| SSRP1 | ABP | Lung | AIS | HMGN1,PTMA,LMNB2, etc. | -2.22e-16 | |
| SSRP1 | ABP | Lung | IAC | HMGN1,PTMA,LMNB2, etc. | 5.40e-03 |  |
| SSRP1 | BAS | Lung | IAC | HMGN1,PTMA,LMNB2, etc. | 1.35e-03 | |
| ∗The dot plots of a searched regulon are shown for all cell subpopulations in each disease state of each tissue based on the regulon specific score inferred using pySCENIC and by calculating the average expression. |
| Page: 1 2 |
Top |
Somatic mutation of malignant transformation related genes |
| Annotation of somatic variants for genes involved in malignant transformation |
| Hugo Symbol | Variant Class | Variant Classification | dbSNP RS | HGVSc | HGVSp | HGVSp Short | SWISSPROT | BIOTYPE | SIFT | PolyPhen | Tumor Sample Barcode | Tissue | Histology | Sex | Age | Stage | Therapy Types | Drugs | Outcome |
| SSRP1 | SNV | Missense_Mutation | c.164N>C | p.Arg55Pro | p.R55P | Q08945 | protein_coding | deleterious(0.01) | probably_damaging(0.988) | TCGA-A7-A6VY-01 | Breast | breast invasive carcinoma | Female | <65 | I/II | Chemotherapy | cyclophosphamide | CR | |
| SSRP1 | SNV | Missense_Mutation | c.859N>A | p.Leu287Met | p.L287M | Q08945 | protein_coding | tolerated(0.07) | possibly_damaging(0.844) | TCGA-A8-A07J-01 | Breast | breast invasive carcinoma | Female | <65 | I/II | Chemotherapy | 5-fluorouracil | CR | |
| SSRP1 | SNV | Missense_Mutation | novel | c.67N>G | p.Leu23Val | p.L23V | Q08945 | protein_coding | deleterious(0.02) | possibly_damaging(0.766) | TCGA-A8-A083-01 | Breast | breast invasive carcinoma | Female | >=65 | I/II | Unknown | Unknown | SD |
| SSRP1 | SNV | Missense_Mutation | novel | c.1045N>C | p.Ser349Pro | p.S349P | Q08945 | protein_coding | tolerated(0.05) | benign(0.173) | TCGA-AO-A128-01 | Breast | breast invasive carcinoma | Female | <65 | I/II | Chemotherapy | doxorubicin | SD |
| SSRP1 | SNV | Missense_Mutation | c.920C>T | p.Ser307Leu | p.S307L | Q08945 | protein_coding | deleterious(0.04) | benign(0.266) | TCGA-AO-A1KR-01 | Breast | breast invasive carcinoma | Female | <65 | I/II | Chemotherapy | cyclophosphamide | SD | |
| SSRP1 | SNV | Missense_Mutation | c.269N>G | p.Lys90Arg | p.K90R | Q08945 | protein_coding | tolerated(0.09) | benign(0.348) | TCGA-BH-A1F5-01 | Breast | breast invasive carcinoma | Female | <65 | I/II | Unknown | Unknown | SD | |
| SSRP1 | SNV | Missense_Mutation | c.2101N>C | p.Glu701Gln | p.E701Q | Q08945 | protein_coding | deleterious(0.02) | benign(0.087) | TCGA-E9-A1NA-01 | Breast | breast invasive carcinoma | Female | <65 | I/II | Chemotherapy | cyclophosphamide | SD | |
| SSRP1 | insertion | In_Frame_Ins | novel | c.65_66insTGTTGTCAA | p.Arg22_Leu23insValValLys | p.R22_L23insVVK | Q08945 | protein_coding | TCGA-A8-A083-01 | Breast | breast invasive carcinoma | Female | >=65 | I/II | Unknown | Unknown | SD | ||
| SSRP1 | deletion | Frame_Shift_Del | novel | c.222delT | p.Tyr74Ter | p.Y74* | Q08945 | protein_coding | TCGA-EW-A2FV-01 | Breast | breast invasive carcinoma | Female | <65 | III/IV | Chemotherapy | docetaxel | SD | ||
| SSRP1 | SNV | Missense_Mutation | novel | c.1537N>A | p.Asp513Asn | p.D513N | Q08945 | protein_coding | tolerated(0.12) | benign(0) | TCGA-2W-A8YY-01 | Cervix | cervical & endocervical cancer | Female | <65 | I/II | Chemotherapy | cisplatin | CR |
| Page: 1 2 3 4 5 6 7 8 9 |
Top |
Related drugs of malignant transformation related genes |
| Identification of chemicals and drugs interact with genes involved in malignant transfromation |
| (DGIdb 4.0) |
| Entrez ID | Symbol | Category | Interaction Types | Drug Claim Name | Drug Name | PMIDs |
| 6749 | SSRP1 | KINASE, DNA REPAIR | CBL0102 | |||
| 6749 | SSRP1 | KINASE, DNA REPAIR | CBL0137 |
| Page: 1 |

Copyright 2023-Present -The University of Texas Health Science Center at Houston |