
|
|||||
|
 | |
| |
| |
| |
| |
| |
|
Gene: SAMD12 |
Gene summary for SAMD12 |
| Gene information | Species | Human | Gene symbol | SAMD12 | Gene ID | 401474 |
| Gene name | sterile alpha motif domain containing 12 | |
| Gene Alias | SAMD12 | |
| Cytomap | 8q24.11-q24.12 | |
| Gene Type | protein-coding | GO ID | GO:0007154 | UniProtAcc | B8ZZB7 |
Top |
Malignant transformation analysis |
| Identification of the aberrant gene expression in precancerous and cancerous lesions by comparing the gene expression of stem-like cells in diseased tissues with normal stem cells |
| Entrez ID | Symbol | Replicates | Species | Organ | Tissue | Adj P-value | Log2FC | Malignancy |
| 401474 | SAMD12 | RNA-P7T1-P7T1-1 | Human | Lung | AIS | 6.59e-24 | 1.43e+00 | -0.0961 |
| 401474 | SAMD12 | RNA-P7T1-P7T1-2 | Human | Lung | AIS | 1.59e-26 | 1.43e+00 | -0.0876 |
| 401474 | SAMD12 | RNA-P7T1-P7T1-3 | Human | Lung | AIS | 2.79e-23 | 1.37e+00 | -0.0822 |
| 401474 | SAMD12 | RNA-P7T1-P7T1-4 | Human | Lung | AIS | 2.29e-26 | 1.36e+00 | -0.0809 |
| 401474 | SAMD12 | RNA-P8T2-P8T2-1 | Human | Lung | AIS | 3.94e-04 | 9.83e-01 | -0.1263 |
| 401474 | SAMD12 | RNA-P8T2-P8T2-3 | Human | Lung | AIS | 3.36e-06 | 8.96e-01 | -0.1284 |
| 401474 | SAMD12 | RNA-P8T2-P8T2-4 | Human | Lung | AIS | 6.39e-04 | 8.30e-01 | -0.1197 |
| 401474 | SAMD12 | HTA12-15-2 | Human | Pancreas | PDAC | 5.30e-09 | 5.93e-01 | 0.2315 |
| 401474 | SAMD12 | HTA12-23-1 | Human | Pancreas | PDAC | 8.84e-09 | 9.00e-01 | 0.3405 |
| 401474 | SAMD12 | HTA12-25-1 | Human | Pancreas | PDAC | 5.62e-22 | 1.25e+00 | 0.313 |
| 401474 | SAMD12 | HTA12-26-1 | Human | Pancreas | PDAC | 2.17e-27 | 1.12e+00 | 0.3728 |
| 401474 | SAMD12 | HTA12-29-1 | Human | Pancreas | PDAC | 2.32e-69 | 1.21e+00 | 0.3722 |
| 401474 | SAMD12 | HTA12-3-16 | Human | Pancreas | PDAC | 7.73e-08 | 1.40e+00 | 0.1553 |
| 401474 | SAMD12 | HTA12-30-1 | Human | Pancreas | PDAC | 1.02e-03 | 1.06e+00 | 0.3671 |
| 401474 | SAMD12 | HTA12-32-1 | Human | Pancreas | PDAC | 8.82e-06 | 1.23e+00 | 0.3624 |
| 401474 | SAMD12 | HTA12-9-1 | Human | Pancreas | PDAC | 9.56e-04 | 4.64e-01 | 0.1532 |
| 401474 | SAMD12 | HTA12-9-2 | Human | Pancreas | PDAC | 4.02e-04 | 4.78e-01 | 0.0835 |
| 401474 | SAMD12 | HTA12-9-3 | Human | Pancreas | PDAC | 1.69e-05 | 7.98e-01 | 0.2045 |
| 401474 | SAMD12 | Pat01-B | Human | Stomach | GC | 3.17e-13 | 3.00e-01 | 0.5754 |
| 401474 | SAMD12 | Pat02-B | Human | Stomach | GC | 1.32e-32 | 4.14e-01 | 0.0368 |
| Page: 1 2 3 4 5 6 7 8 9 10 11 |
| Tissue | Expression Dynamics | Abbreviation |
| Cervix | 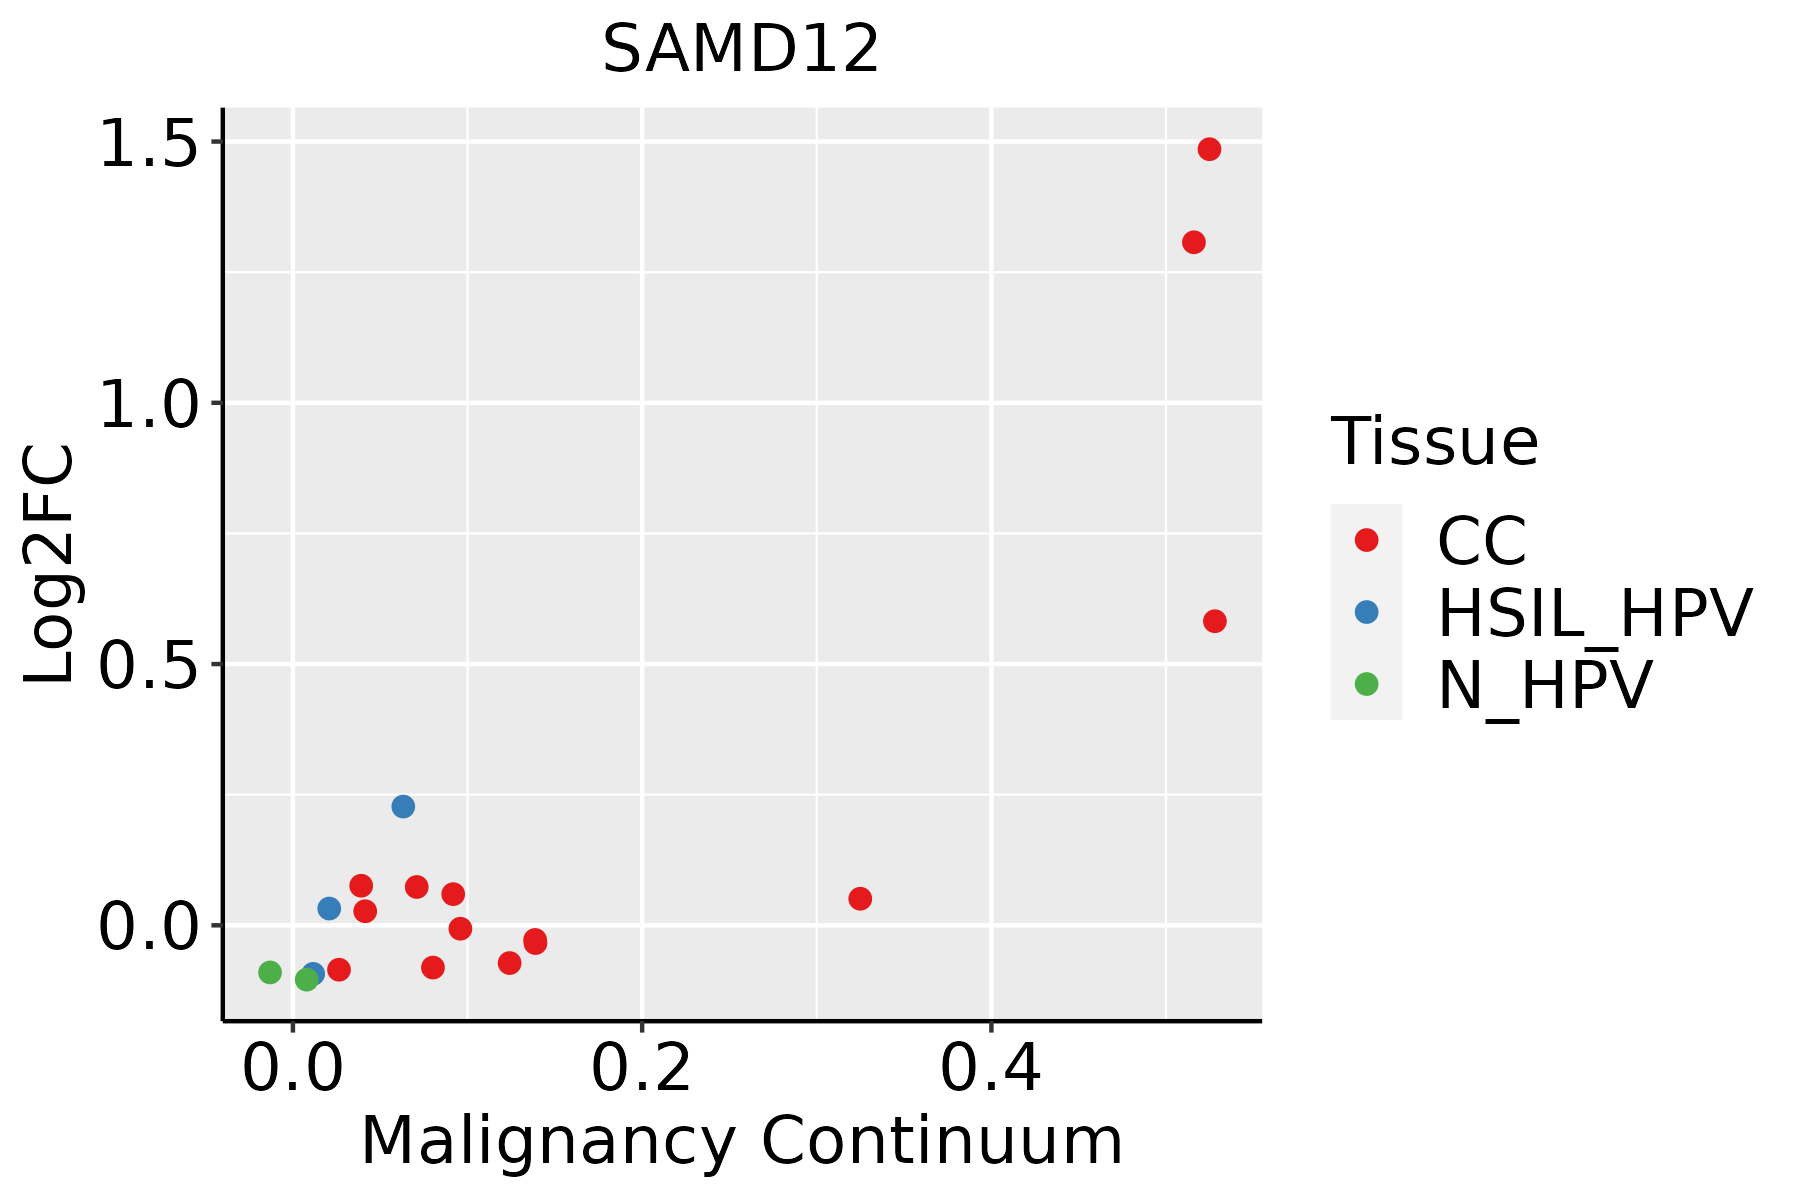 | CC: Cervix cancer |
| HSIL_HPV: HPV-infected high-grade squamous intraepithelial lesions | ||
| N_HPV: HPV-infected normal cervix | ||
| Colorectum (GSE201348) |  | FAP: Familial adenomatous polyposis |
| CRC: Colorectal cancer | ||
| Colorectum (HTA11) |  | AD: Adenomas |
| SER: Sessile serrated lesions | ||
| MSI-H: Microsatellite-high colorectal cancer | ||
| MSS: Microsatellite stable colorectal cancer | ||
| Endometrium | 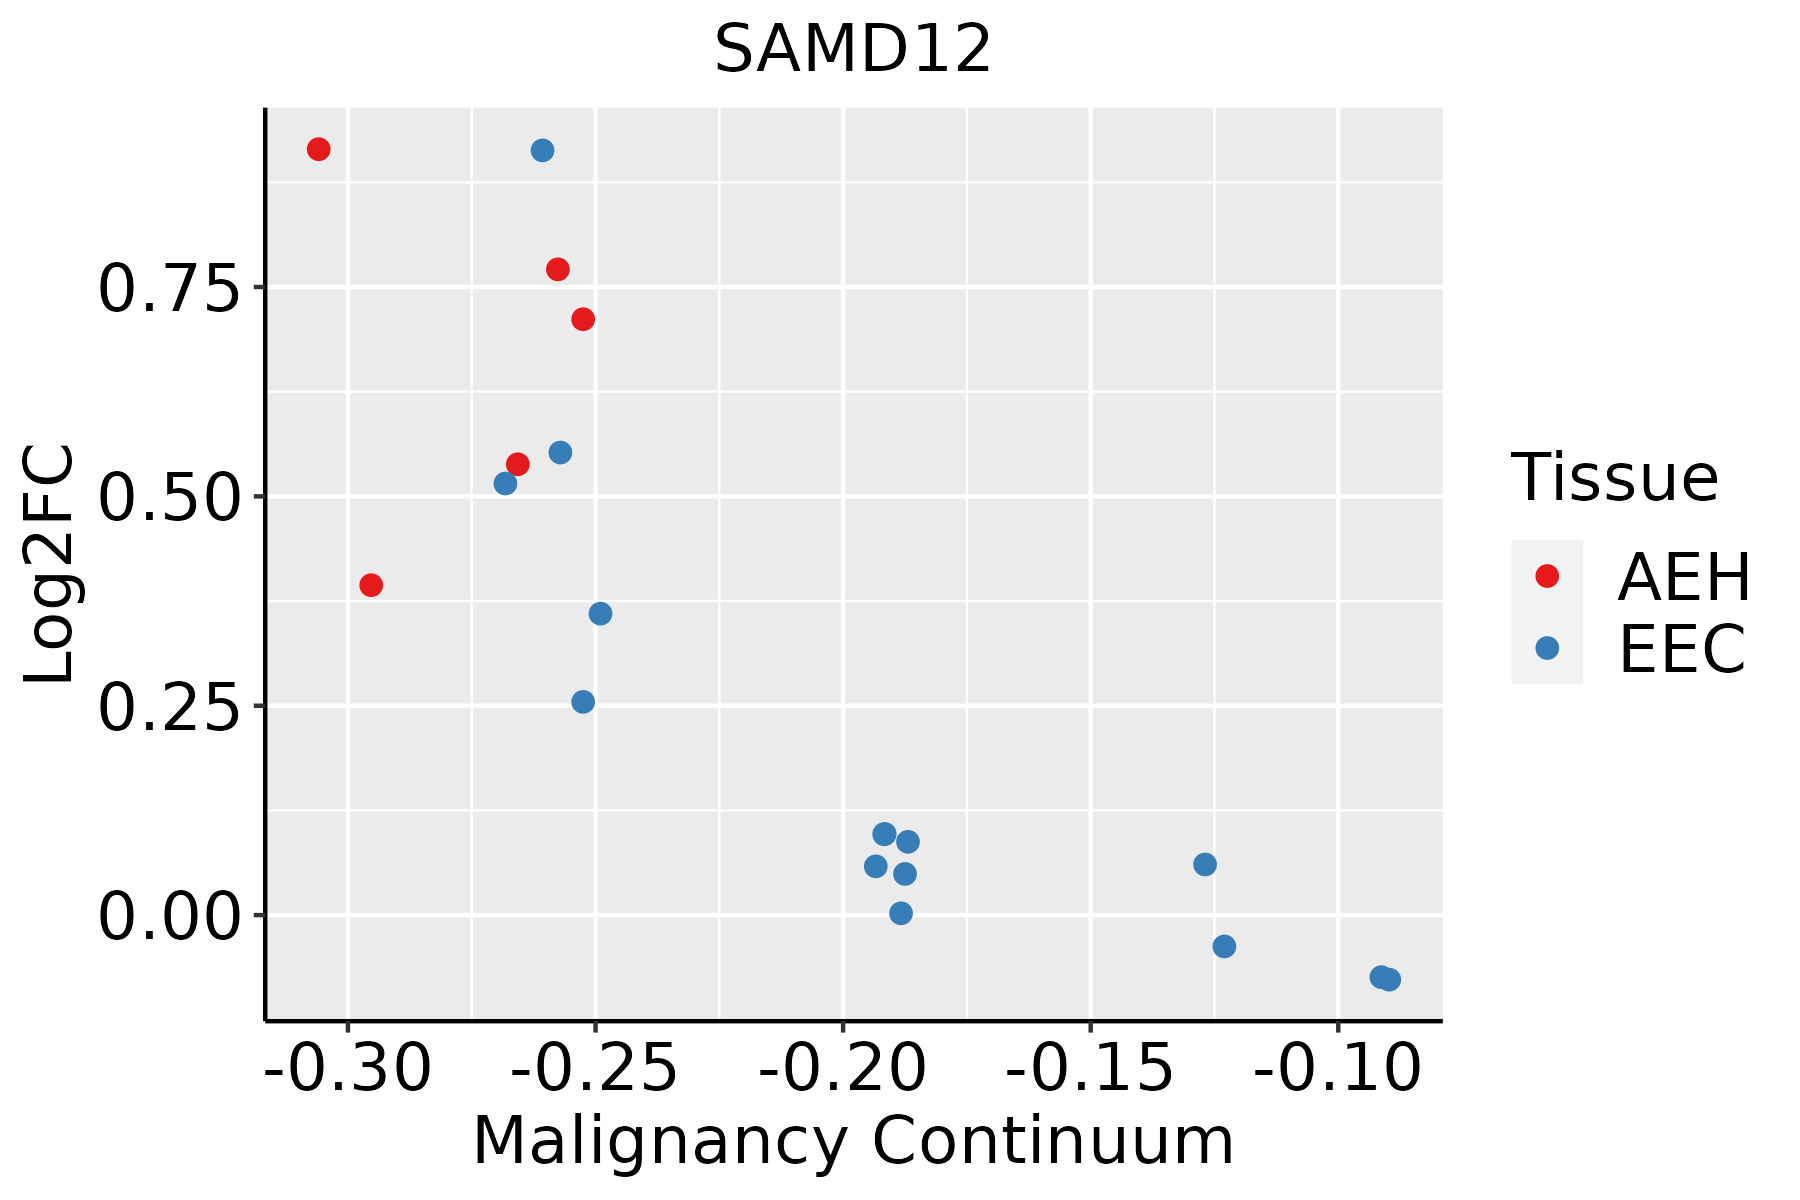 | AEH: Atypical endometrial hyperplasia |
| EEC: Endometrioid Cancer | ||
| Esophagus |  | ESCC: Esophageal squamous cell carcinoma |
| HGIN: High-grade intraepithelial neoplasias | ||
| LGIN: Low-grade intraepithelial neoplasias | ||
| GC | 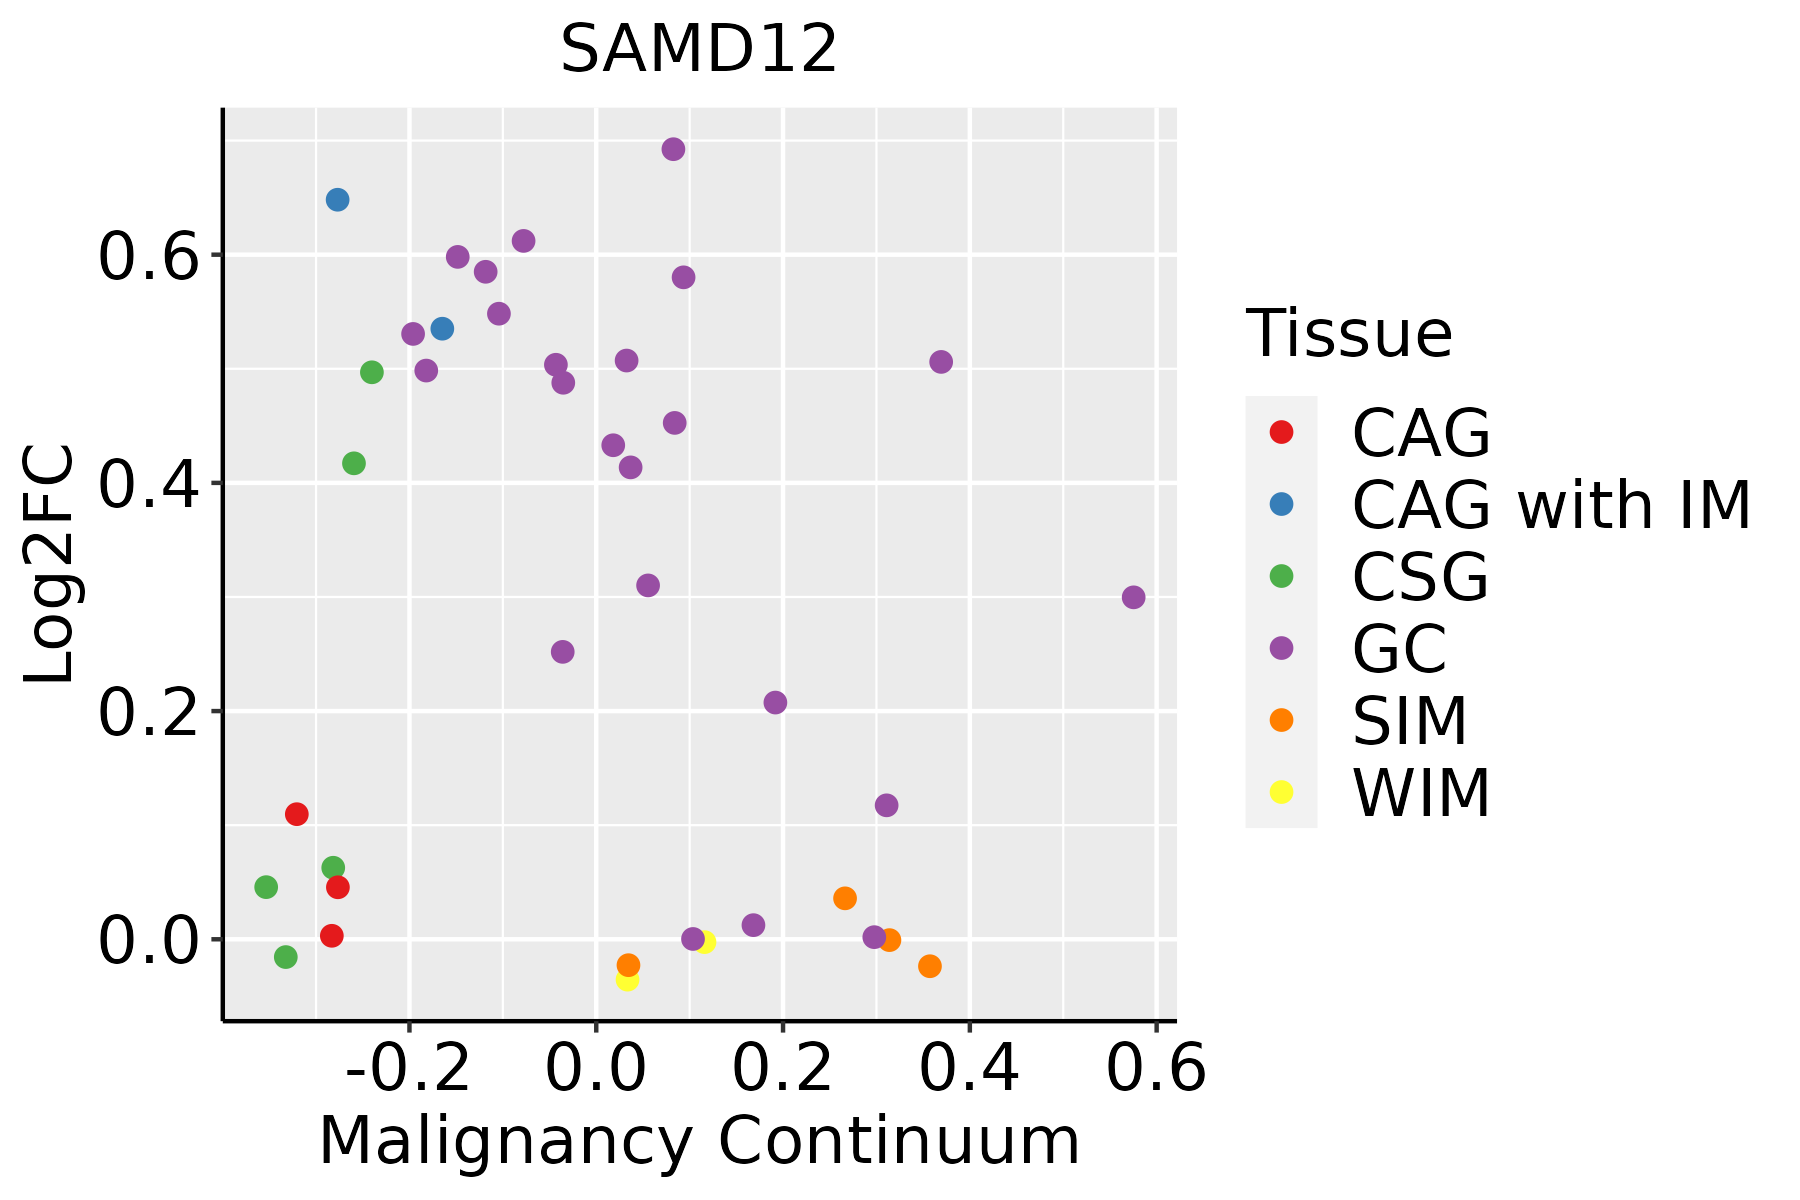 | CAG: Chronic atrophic gastritis |
| CAG with IM: Chronic atrophic gastritis with intestinal metaplasia | ||
| CSG: Chronic superficial gastritis | ||
| GC: Gastric cancer | ||
| SIM: Severe intestinal metaplasia | ||
| WIM: Wild intestinal metaplasia | ||
| Liver |  | HCC: Hepatocellular carcinoma |
| NAFLD: Non-alcoholic fatty liver disease | ||
| Lung | 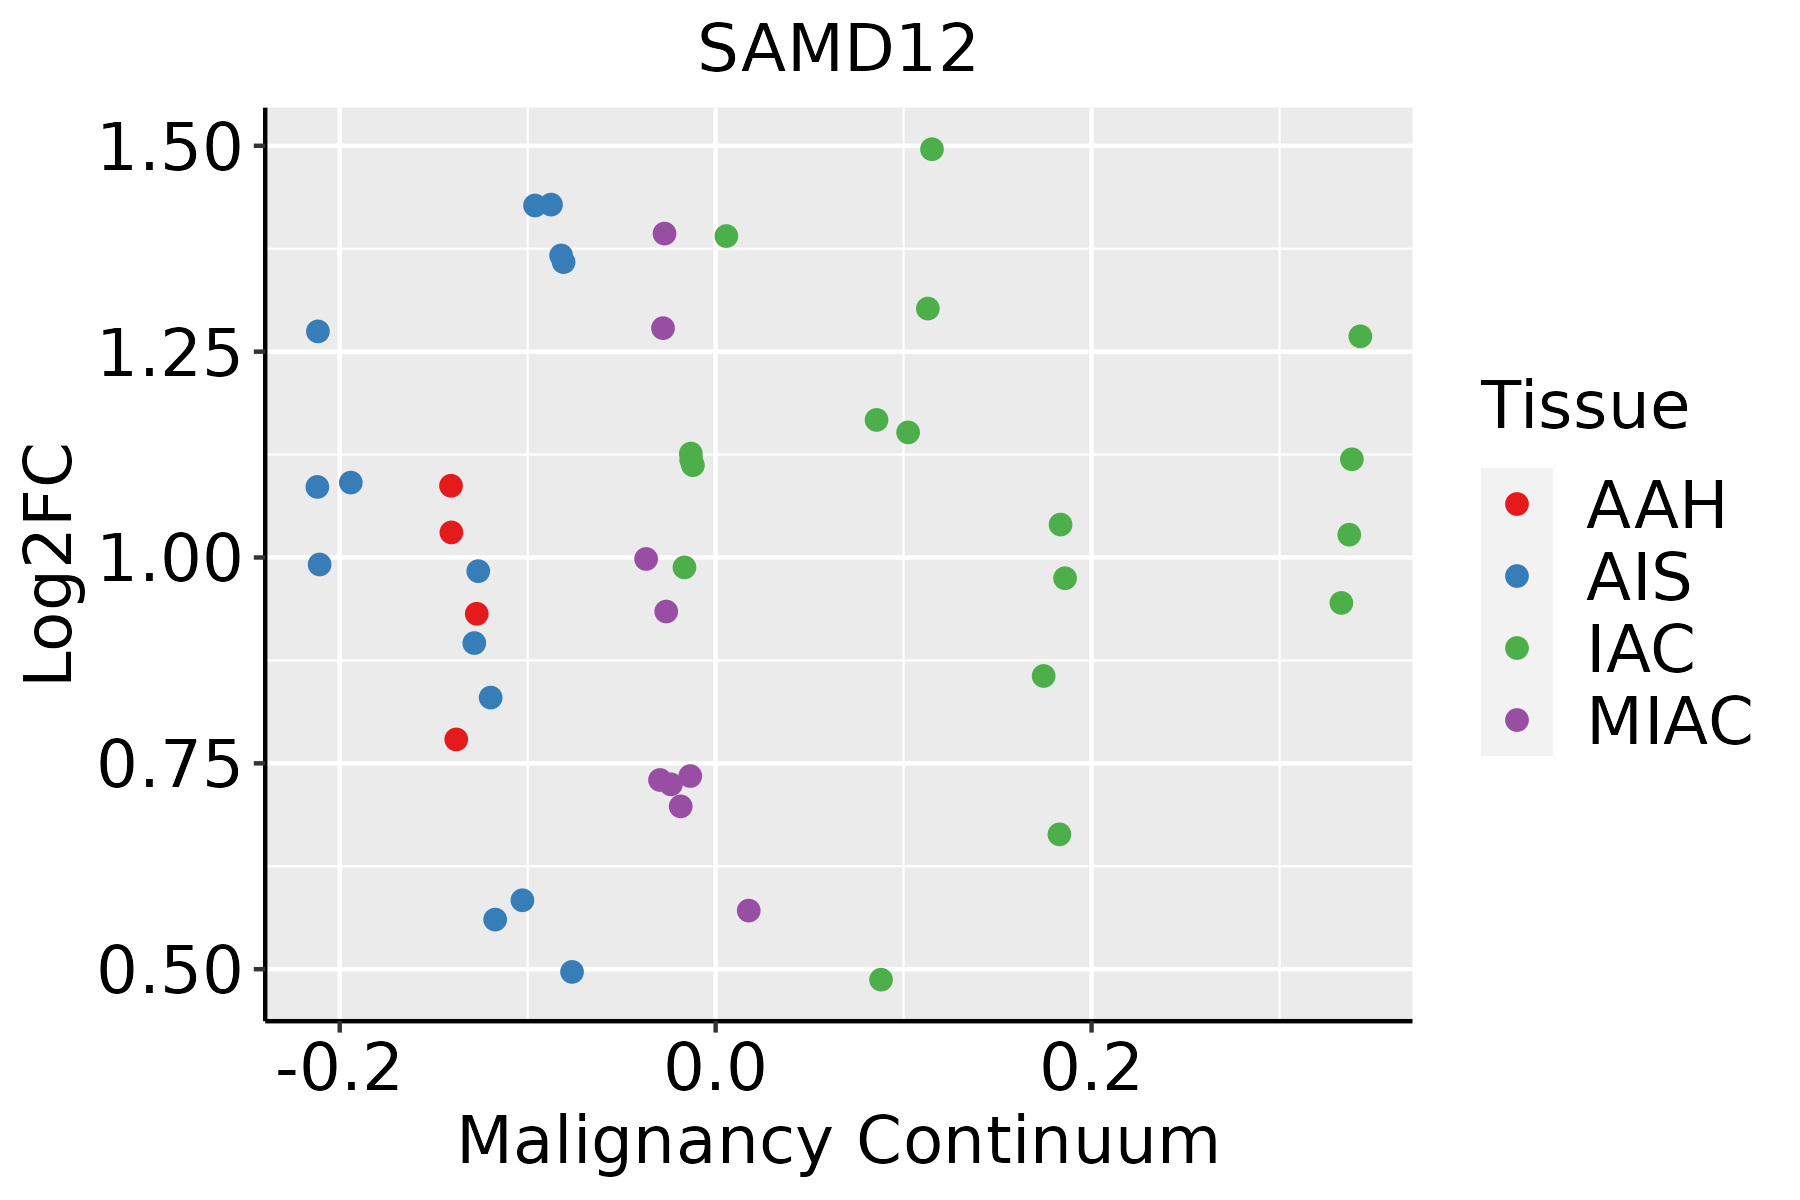 | AAH: Atypical adenomatous hyperplasia |
| AIS: Adenocarcinoma in situ | ||
| IAC: Invasive lung adenocarcinoma | ||
| MIA: Minimally invasive adenocarcinoma | ||
| Thyroid | 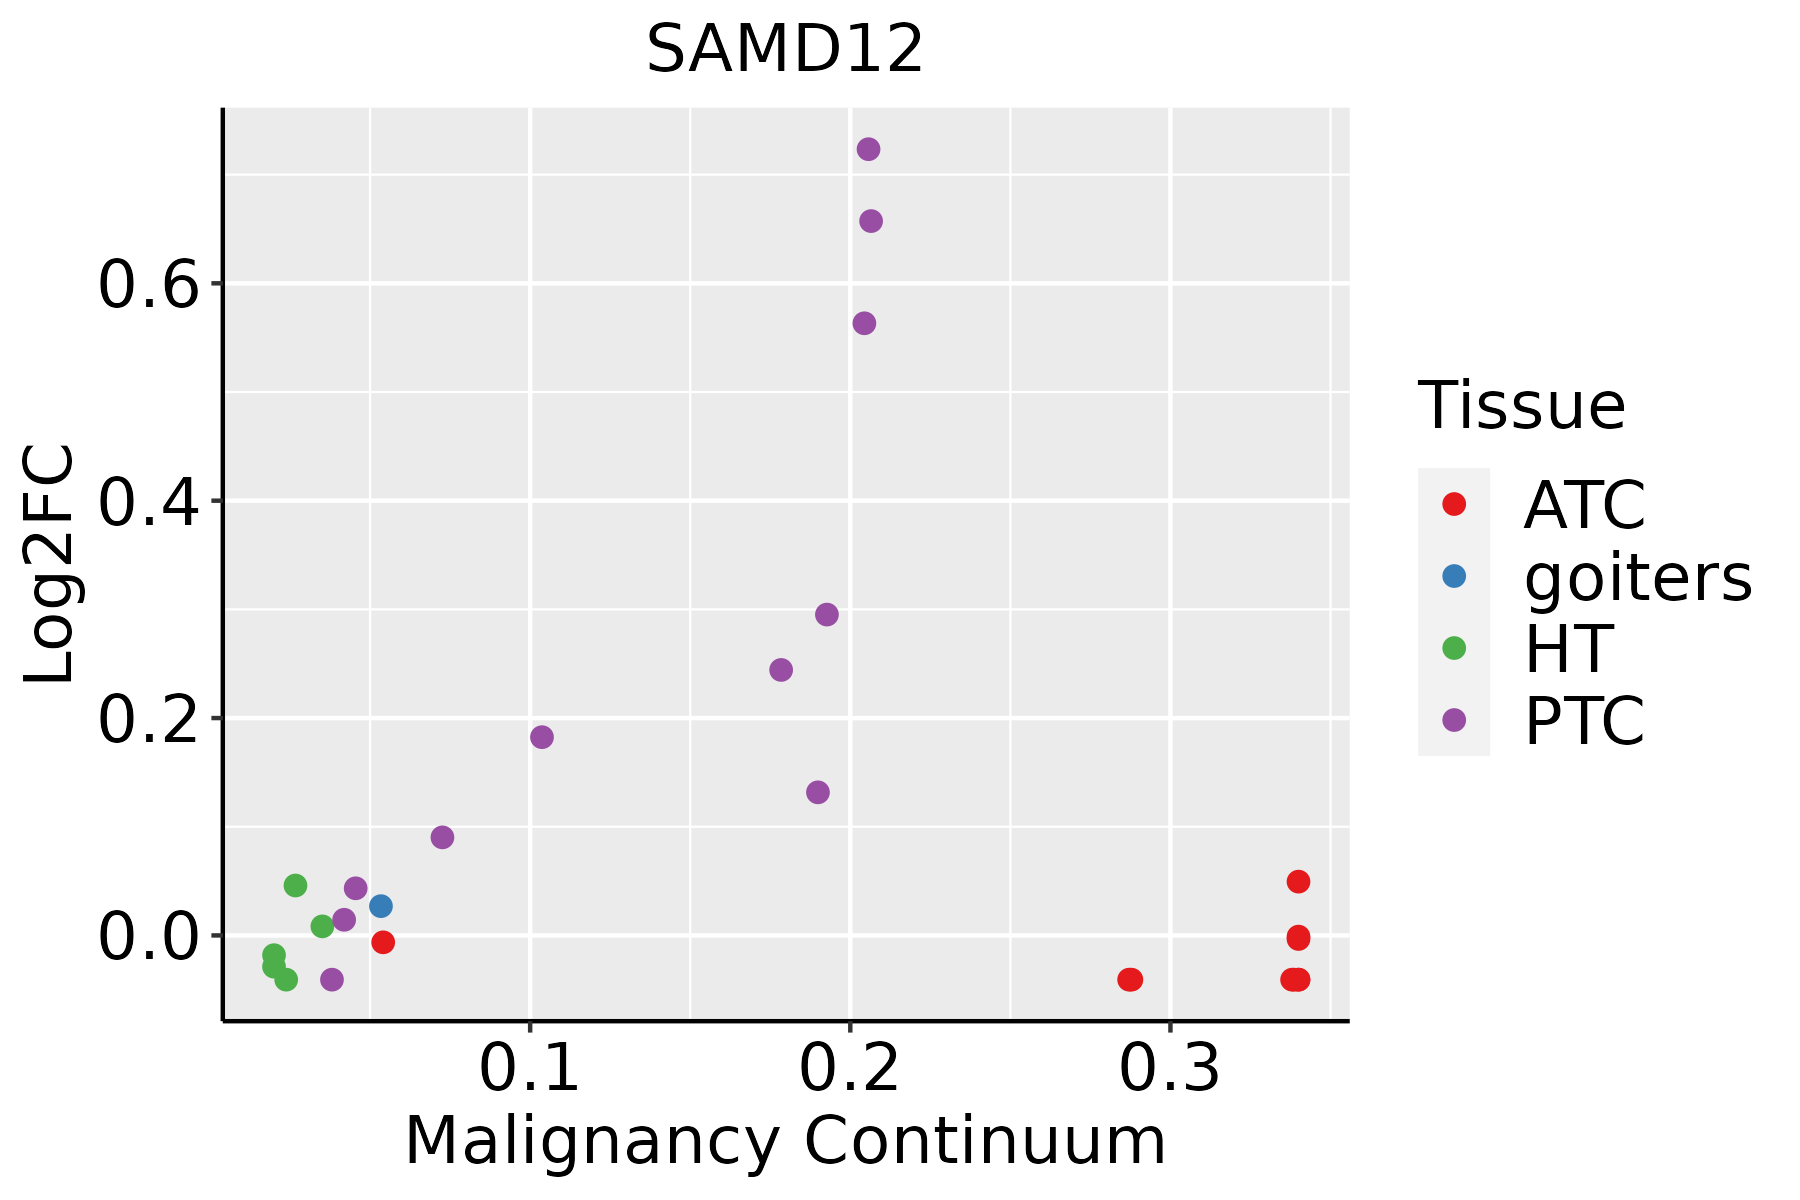 | ATC: Anaplastic thyroid cancer |
| HT: Hashimoto's thyroiditis | ||
| PTC: Papillary thyroid cancer |
| ∗log2FC in expression of this searched gene in stem-like cells from each diseased tissue sample relative to stem-like cells in normal samples in each tissue plotted against the malignancy continuum. Samples are colored based on if they are from different disease stage. |
Top |
Malignant transformation related pathway analysis |
| Find out the enriched GO biological processes and KEGG pathways involved in transition from healthy to precancer to cancer |
| Tissue | Disease Stage | Enriched GO biological Processes |
| Colorectum | AD |  |
| Colorectum | SER |  |
| Colorectum | MSS |  |
| Colorectum | MSI-H |  |
| Colorectum | FAP |  |
| ∗Top 15 enriched GO BP terms are showed in the bar plot of each disease state in each tissue. Each row represents a significant GO biological process which is colored according to the -log10(p.adjust). |
| Page: 1 2 3 4 5 6 7 8 9 |
| GO ID | Tissue | Disease Stage | Description | Gene Ratio | Bg Ratio | pvalue | p.adjust | Count |
| Page: 1 |
| Pathway ID | Tissue | Disease Stage | Description | Gene Ratio | Bg Ratio | pvalue | p.adjust | qvalue | Count |
| Page: 1 |
Top |
Cell-cell communication analysis |
| Identification of potential cell-cell interactions between two cell types and their ligand-receptor pairs for different disease states |
| Ligand | Receptor | LRpair | Pathway | Tissue | Disease Stage |
| Page: 1 |
Top |
Single-cell gene regulatory network inference analysis |
| Find out the significant the regulons (TFs) and the target genes of each regulon across cell types for different disease states |
| TF | Cell Type | Tissue | Disease Stage | Target Gene | RSS | Regulon Activity |
| ∗The dot plots of a searched regulon are shown for all cell subpopulations in each disease state of each tissue based on the regulon specific score inferred using pySCENIC and by calculating the average expression. |
| Page: 1 |
Top |
Somatic mutation of malignant transformation related genes |
| Annotation of somatic variants for genes involved in malignant transformation |
| Hugo Symbol | Variant Class | Variant Classification | dbSNP RS | HGVSc | HGVSp | HGVSp Short | SWISSPROT | BIOTYPE | SIFT | PolyPhen | Tumor Sample Barcode | Tissue | Histology | Sex | Age | Stage | Therapy Types | Drugs | Outcome |
| SAMD12 | SNV | Missense_Mutation | c.529G>C | p.Gly177Arg | p.G177R | Q8N8I0 | protein_coding | tolerated_low_confidence(0.58) | benign(0) | TCGA-AR-A24H-01 | Breast | breast invasive carcinoma | Female | >=65 | I/II | Hormone Therapy | tamoxiphen | SD | |
| SAMD12 | SNV | Missense_Mutation | rs372144053 | c.600N>T | p.Gln200His | p.Q200H | Q8N8I0 | protein_coding | benign(0.007) | TCGA-FU-A3HZ-01 | Cervix | cervical & endocervical cancer | Female | <65 | I/II | Chemotherapy | cisplatin | CR | |
| SAMD12 | SNV | Missense_Mutation | rs762699586 | c.346N>A | p.Asp116Asn | p.D116N | Q8N8I0 | protein_coding | tolerated(0.07) | possibly_damaging(0.831) | TCGA-IR-A3LK-01 | Cervix | cervical & endocervical cancer | Female | >=65 | I/II | Chemotherapy | cisplatin | PD |
| SAMD12 | SNV | Missense_Mutation | c.445N>G | p.Leu149Val | p.L149V | Q8N8I0 | protein_coding | deleterious(0) | probably_damaging(0.991) | TCGA-JW-A5VL-01 | Cervix | cervical & endocervical cancer | Female | <65 | I/II | Unknown | Unknown | SD | |
| SAMD12 | SNV | Missense_Mutation | c.216A>T | p.Lys72Asn | p.K72N | Q8N8I0 | protein_coding | deleterious(0) | probably_damaging(0.982) | TCGA-AA-3867-01 | Colorectum | colon adenocarcinoma | Male | >=65 | III/IV | Unknown | Unknown | PD | |
| SAMD12 | SNV | Missense_Mutation | c.68G>T | p.Gly23Val | p.G23V | Q8N8I0 | protein_coding | deleterious(0) | possibly_damaging(0.82) | TCGA-AA-A00N-01 | Colorectum | colon adenocarcinoma | Male | >=65 | I/II | Unknown | Unknown | PD | |
| SAMD12 | SNV | Missense_Mutation | c.368N>A | p.Gly123Glu | p.G123E | Q8N8I0 | protein_coding | deleterious(0) | probably_damaging(1) | TCGA-DM-A1DA-01 | Colorectum | colon adenocarcinoma | Female | >=65 | III/IV | Unknown | Unknown | SD | |
| SAMD12 | SNV | Missense_Mutation | novel | c.479C>A | p.Ser160Tyr | p.S160Y | protein_coding | deleterious_low_confidence(0) | probably_damaging(0.962) | TCGA-A5-A0G2-01 | Endometrium | uterine corpus endometrioid carcinoma | Female | <65 | III/IV | Unknown | Unknown | SD | |
| SAMD12 | SNV | Missense_Mutation | novel | c.577N>G | p.Ser193Ala | p.S193A | Q8N8I0 | protein_coding | tolerated_low_confidence(1) | benign(0) | TCGA-AJ-A3EL-01 | Endometrium | uterine corpus endometrioid carcinoma | Female | <65 | I/II | Unknown | Unknown | SD |
| SAMD12 | SNV | Missense_Mutation | rs757006538 | c.200N>T | p.Thr67Met | p.T67M | Q8N8I0 | protein_coding | tolerated(0.07) | benign(0.025) | TCGA-AJ-A3EL-01 | Endometrium | uterine corpus endometrioid carcinoma | Female | <65 | I/II | Unknown | Unknown | SD |
| Page: 1 2 3 |
Top |
Related drugs of malignant transformation related genes |
| Identification of chemicals and drugs interact with genes involved in malignant transfromation |
| (DGIdb 4.0) |
| Entrez ID | Symbol | Category | Interaction Types | Drug Claim Name | Drug Name | PMIDs |
| Page: 1 |

Copyright 2023-Present -The University of Texas Health Science Center at Houston |