
|
|||||
|
 | |
| |
| |
| |
| |
| |
|
Gene: PRRC2B |
Gene summary for PRRC2B |
| Gene information | Species | Human | Gene symbol | PRRC2B | Gene ID | 84726 |
| Gene name | proline rich coiled-coil 2B | |
| Gene Alias | BAT2L | |
| Cytomap | 9q34.13 | |
| Gene Type | protein-coding | GO ID | GO:0008150 | UniProtAcc | Q5JSZ5 |
Top |
Malignant transformation analysis |
| Identification of the aberrant gene expression in precancerous and cancerous lesions by comparing the gene expression of stem-like cells in diseased tissues with normal stem cells |
| Entrez ID | Symbol | Replicates | Species | Organ | Tissue | Adj P-value | Log2FC | Malignancy |
| 84726 | PRRC2B | NEOLP-3 | Human | Oral cavity | NEOLP | 4.21e-07 | 2.91e-01 | -0.0191 |
| 84726 | PRRC2B | SYSMH1 | Human | Oral cavity | OSCC | 1.43e-32 | 8.27e-01 | 0.1127 |
| 84726 | PRRC2B | SYSMH2 | Human | Oral cavity | OSCC | 7.15e-09 | 4.47e-01 | 0.2326 |
| 84726 | PRRC2B | SYSMH3 | Human | Oral cavity | OSCC | 3.11e-26 | 7.11e-01 | 0.2442 |
| 84726 | PRRC2B | SYSMH4 | Human | Oral cavity | OSCC | 3.04e-02 | 3.43e-02 | 0.1226 |
| 84726 | PRRC2B | SYSMH5 | Human | Oral cavity | OSCC | 3.59e-08 | 1.12e-01 | 0.0647 |
| 84726 | PRRC2B | SYSMH6 | Human | Oral cavity | OSCC | 1.08e-03 | 1.91e-01 | 0.1275 |
| 84726 | PRRC2B | HTA12-15-2 | Human | Pancreas | PDAC | 1.42e-02 | 3.23e-01 | 0.2315 |
| 84726 | PRRC2B | HTA12-23-1 | Human | Pancreas | PDAC | 1.26e-03 | 6.36e-01 | 0.3405 |
| 84726 | PRRC2B | HTA12-25-1 | Human | Pancreas | PDAC | 3.21e-04 | 5.14e-01 | 0.313 |
| 84726 | PRRC2B | HTA12-26-1 | Human | Pancreas | PDAC | 9.77e-09 | 5.50e-01 | 0.3728 |
| 84726 | PRRC2B | HTA12-29-1 | Human | Pancreas | PDAC | 5.68e-31 | 6.82e-01 | 0.3722 |
| 84726 | PRRC2B | GSM5252132_BPH389PrGF | Human | Prostate | BPH | 9.69e-07 | 6.58e-01 | -0.2247 |
| 84726 | PRRC2B | GSM5252137_BPH556PrGA2_Fcol | Human | Prostate | BPH | 7.15e-08 | 5.35e-01 | -0.23 |
| 84726 | PRRC2B | 047563_1562-all-cells | Human | Prostate | BPH | 1.96e-10 | 2.79e-01 | 0.0791 |
| 84726 | PRRC2B | 048752_1579-all-cells | Human | Prostate | BPH | 8.04e-38 | 6.79e-01 | 0.1008 |
| 84726 | PRRC2B | 052095_1628-all-cells | Human | Prostate | BPH | 1.54e-20 | 5.79e-01 | 0.1032 |
| 84726 | PRRC2B | 052097_1595-all-cells | Human | Prostate | BPH | 4.24e-30 | 6.93e-01 | 0.0972 |
| 84726 | PRRC2B | 052099_1652-all-cells | Human | Prostate | BPH | 1.59e-15 | 5.58e-01 | 0.1038 |
| 84726 | PRRC2B | Dong_P1 | Human | Prostate | Tumor | 2.02e-16 | 6.16e-02 | 0.035 |
| Page: 1 2 3 4 5 6 7 8 9 10 11 12 |
| Tissue | Expression Dynamics | Abbreviation |
| Cervix | 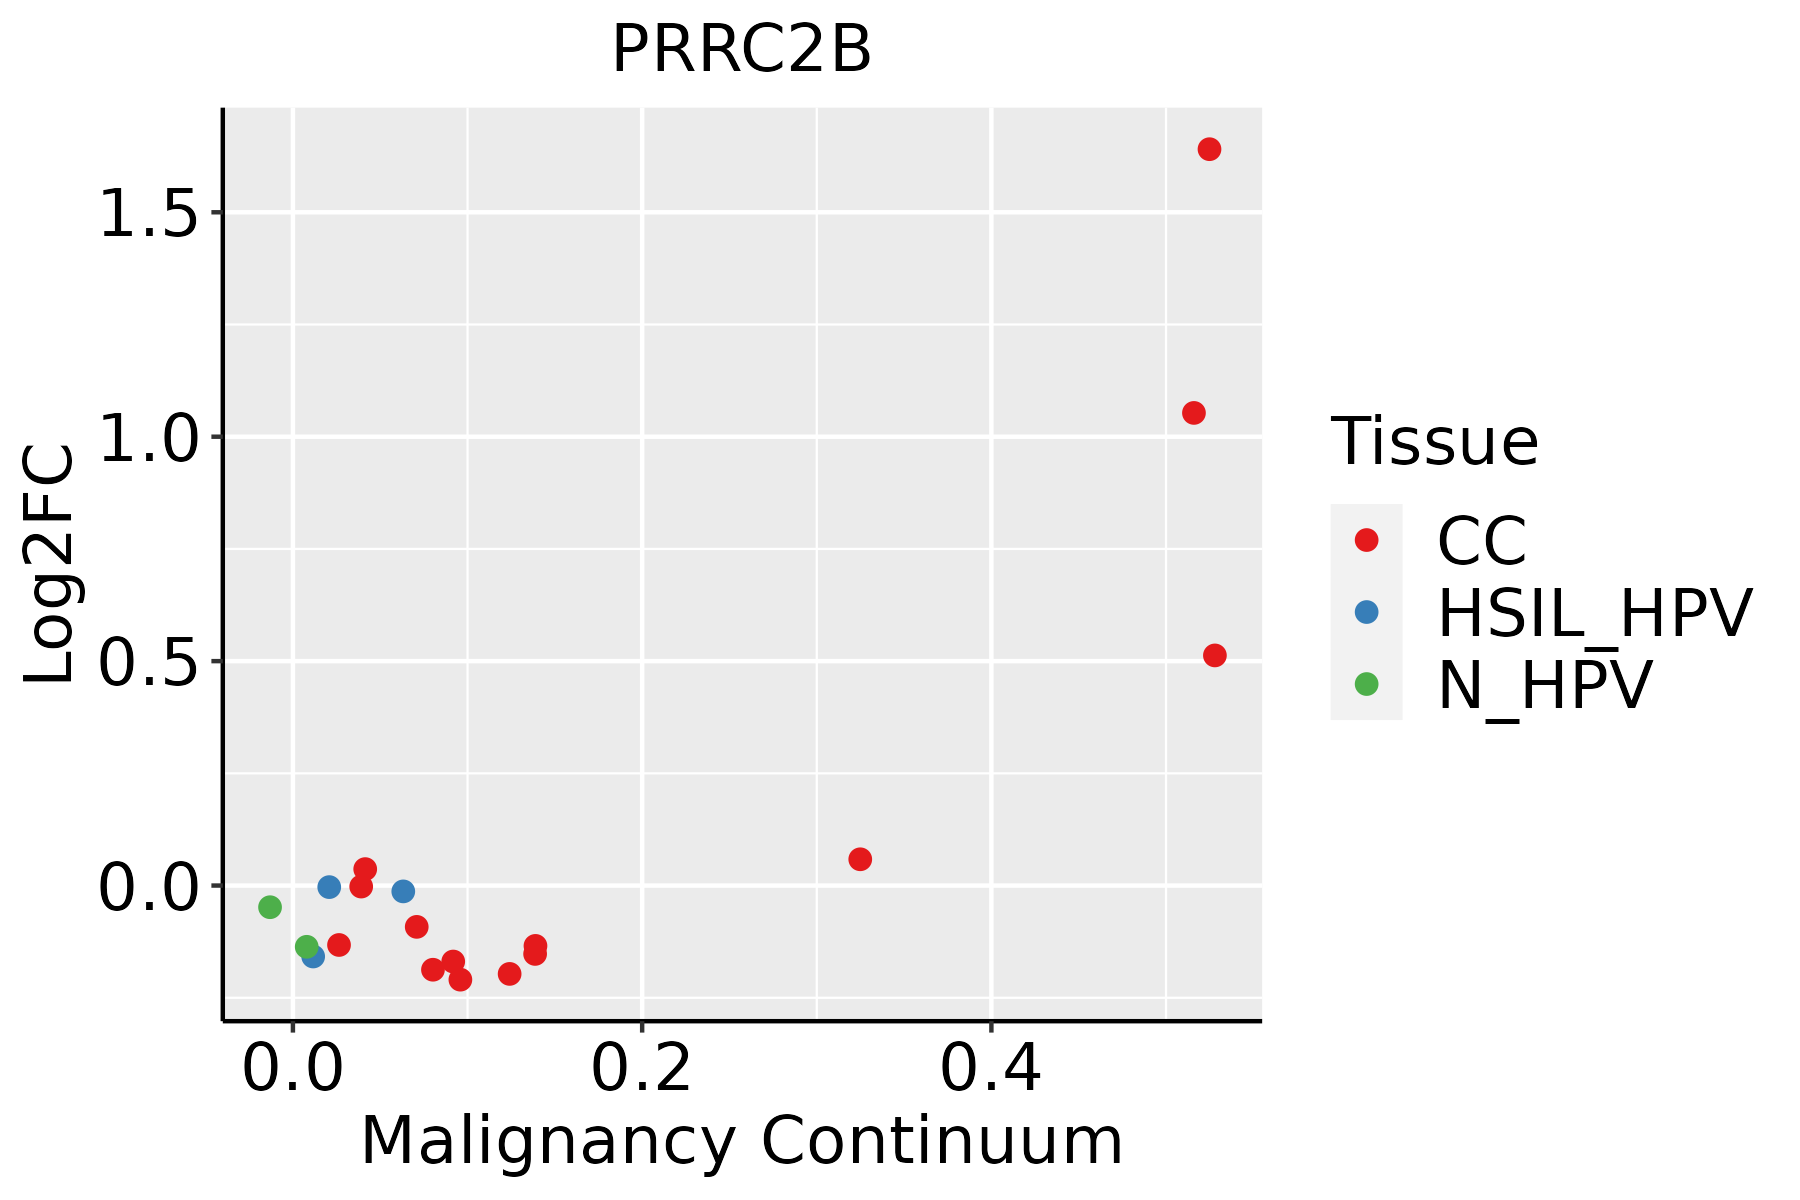 | CC: Cervix cancer |
| HSIL_HPV: HPV-infected high-grade squamous intraepithelial lesions | ||
| N_HPV: HPV-infected normal cervix | ||
| Colorectum (GSE201348) |  | FAP: Familial adenomatous polyposis |
| CRC: Colorectal cancer | ||
| Colorectum (HTA11) |  | AD: Adenomas |
| SER: Sessile serrated lesions | ||
| MSI-H: Microsatellite-high colorectal cancer | ||
| MSS: Microsatellite stable colorectal cancer | ||
| Esophagus | 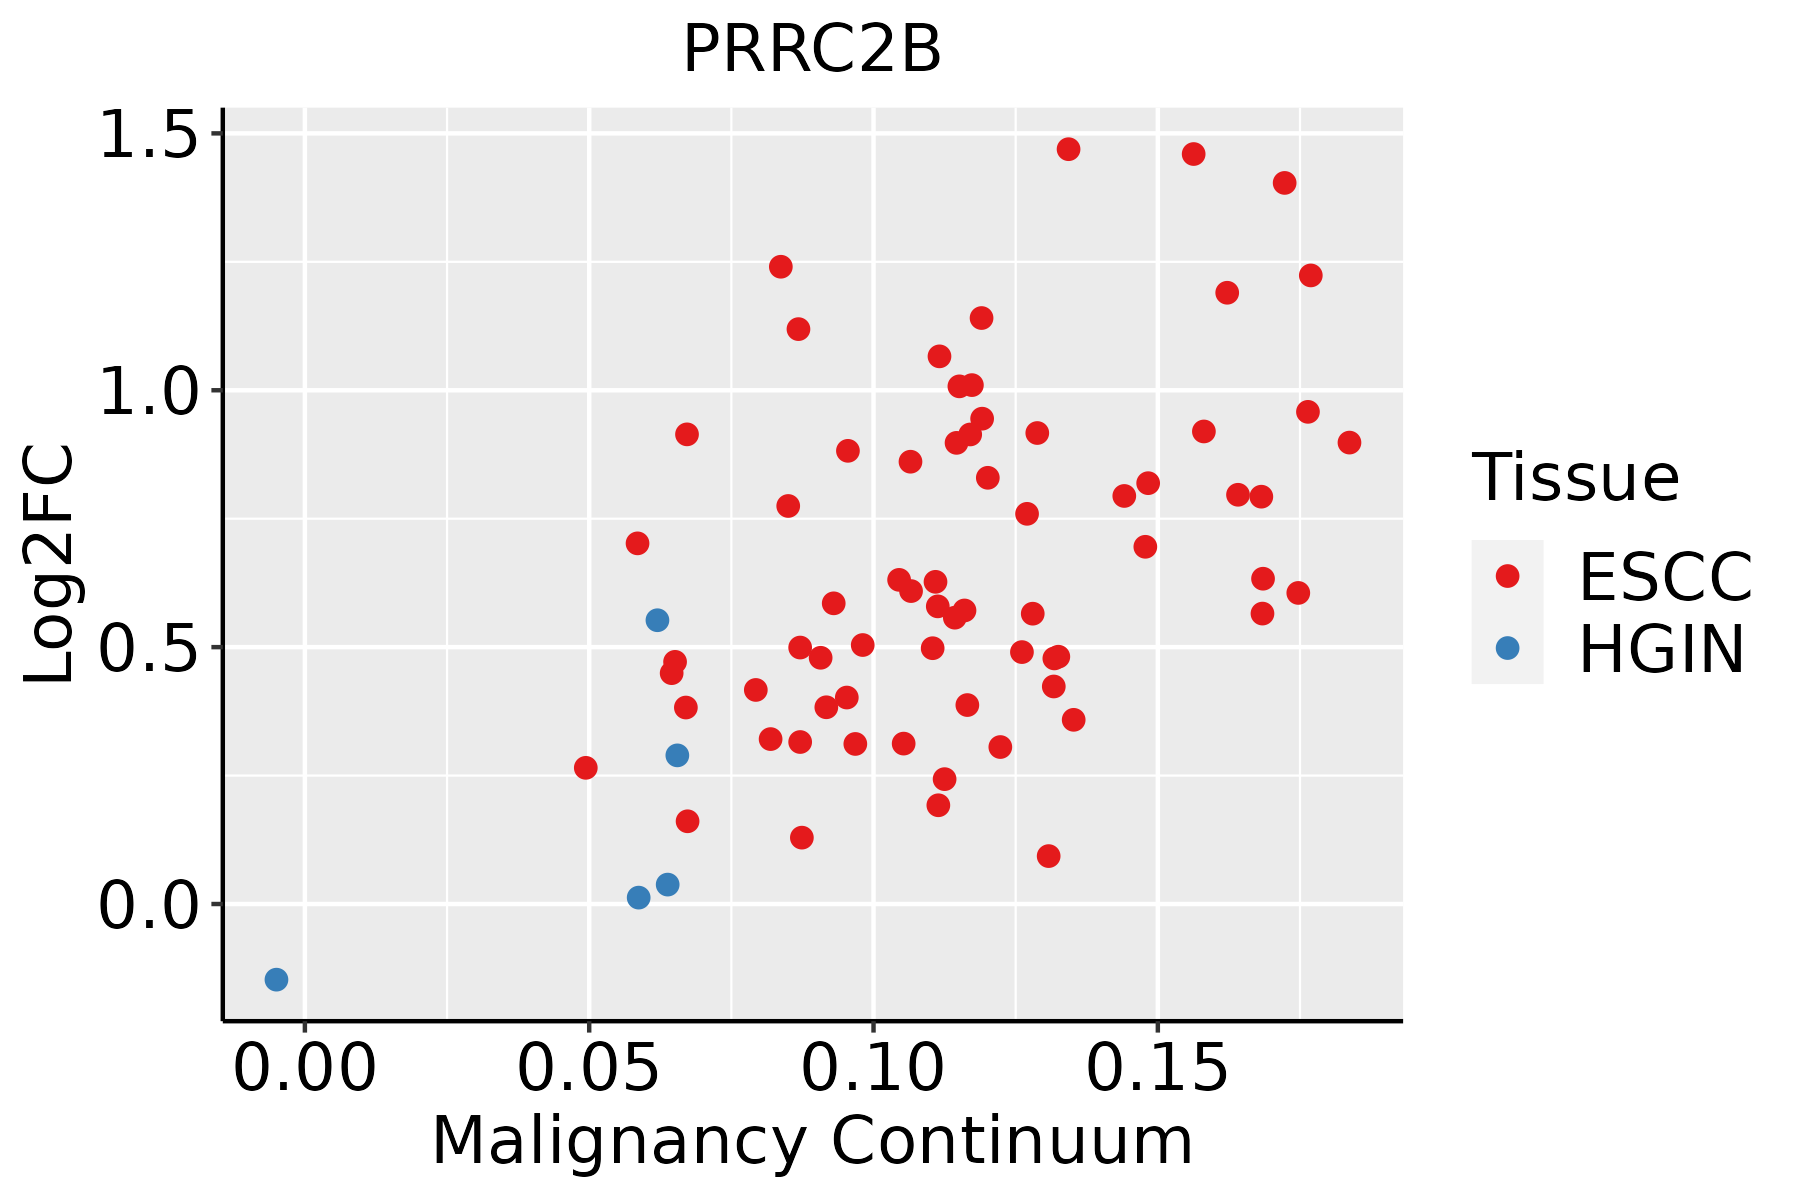 | ESCC: Esophageal squamous cell carcinoma |
| HGIN: High-grade intraepithelial neoplasias | ||
| LGIN: Low-grade intraepithelial neoplasias | ||
| Liver | 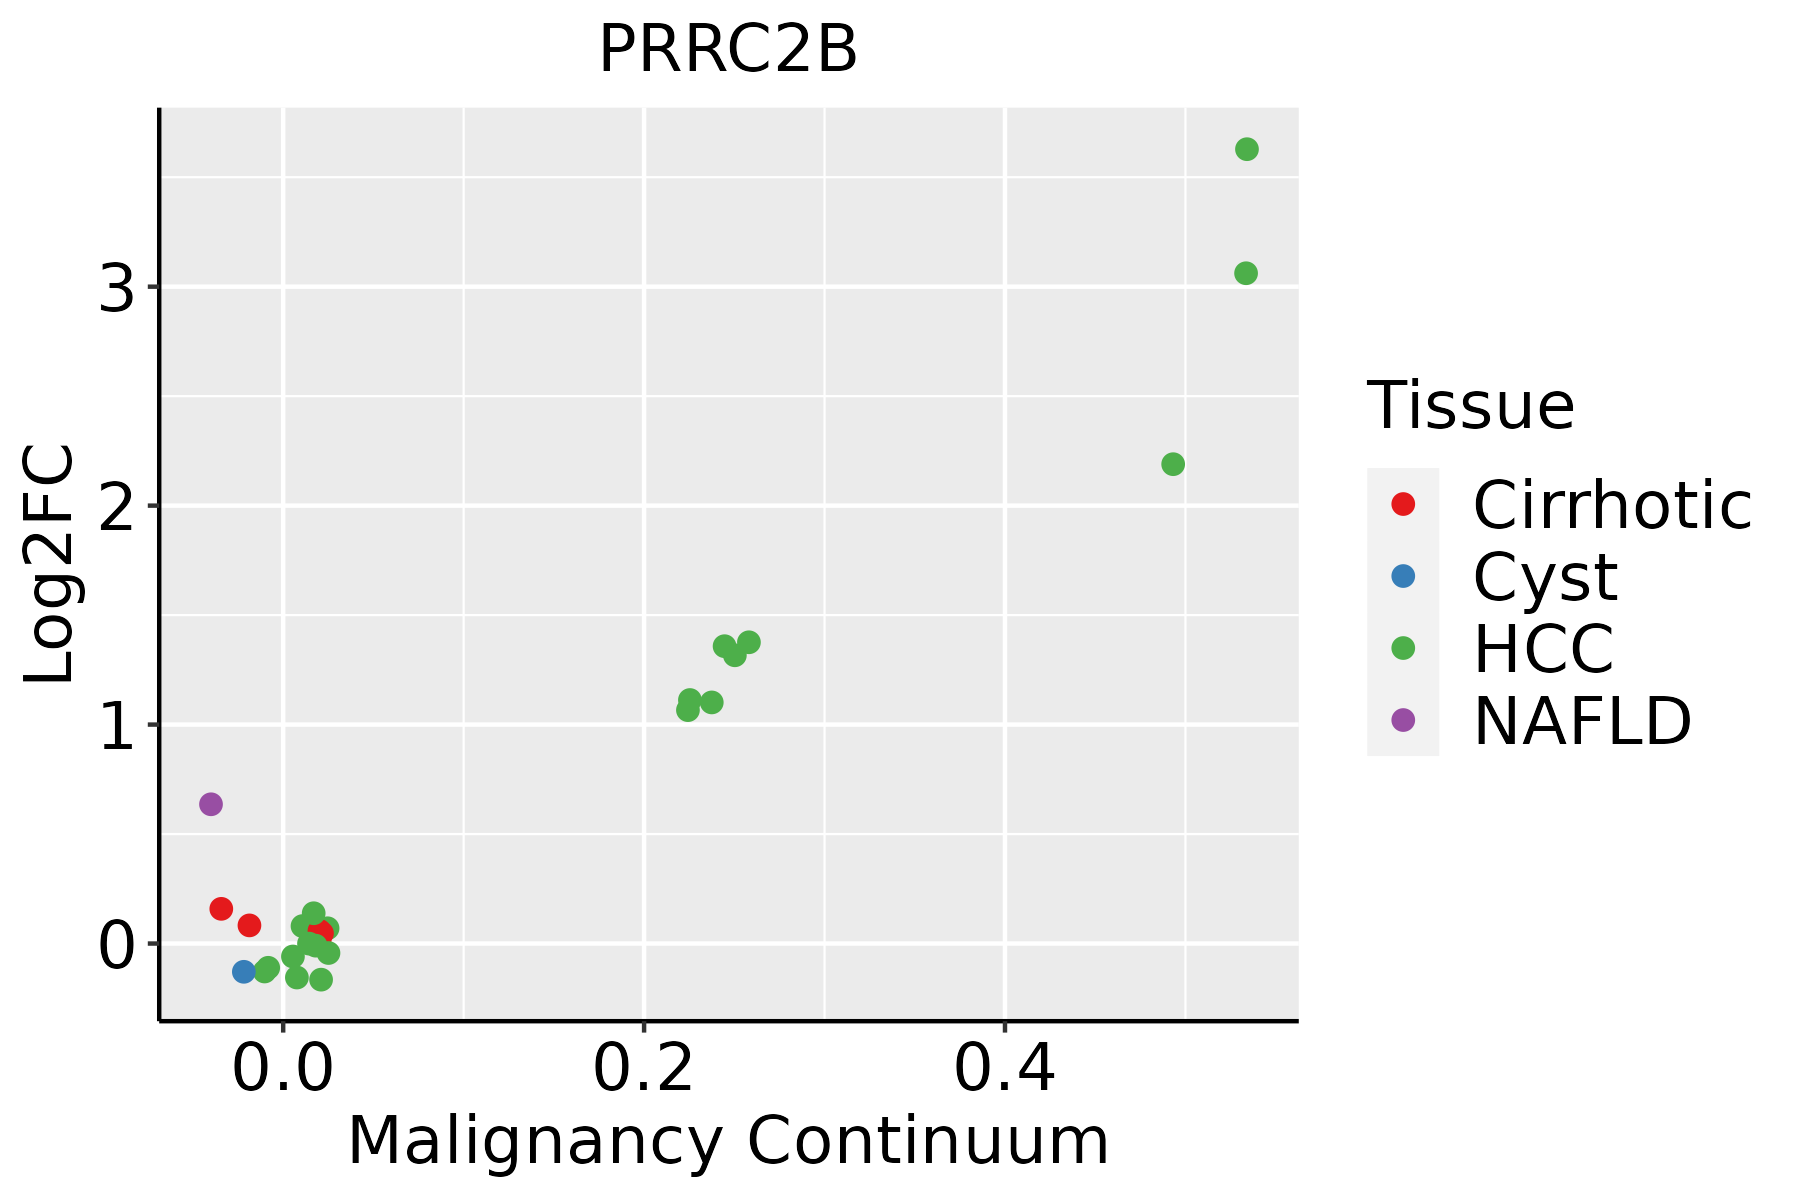 | HCC: Hepatocellular carcinoma |
| NAFLD: Non-alcoholic fatty liver disease | ||
| Lung | 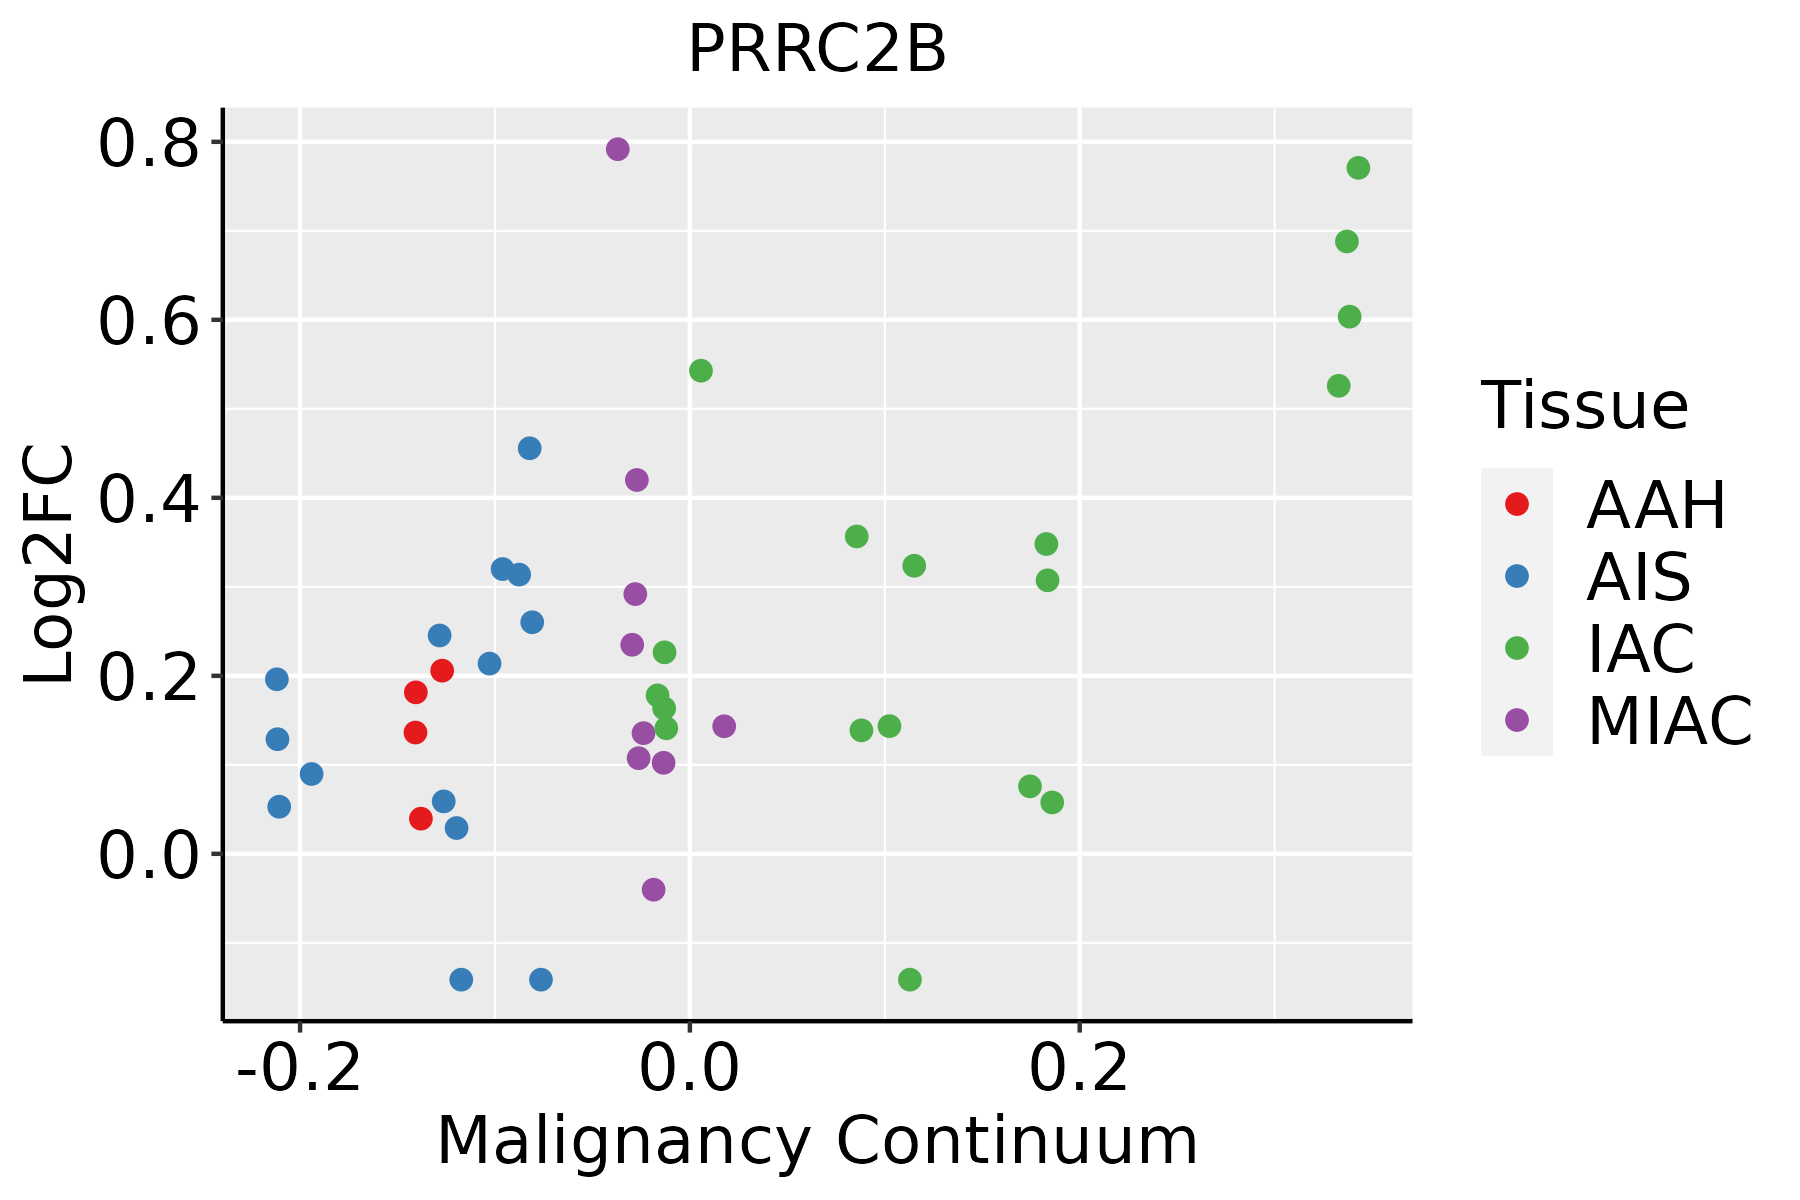 | AAH: Atypical adenomatous hyperplasia |
| AIS: Adenocarcinoma in situ | ||
| IAC: Invasive lung adenocarcinoma | ||
| MIA: Minimally invasive adenocarcinoma | ||
| Oral Cavity |  | EOLP: Erosive Oral lichen planus |
| LP: leukoplakia | ||
| NEOLP: Non-erosive oral lichen planus | ||
| OSCC: Oral squamous cell carcinoma | ||
| Prostate | 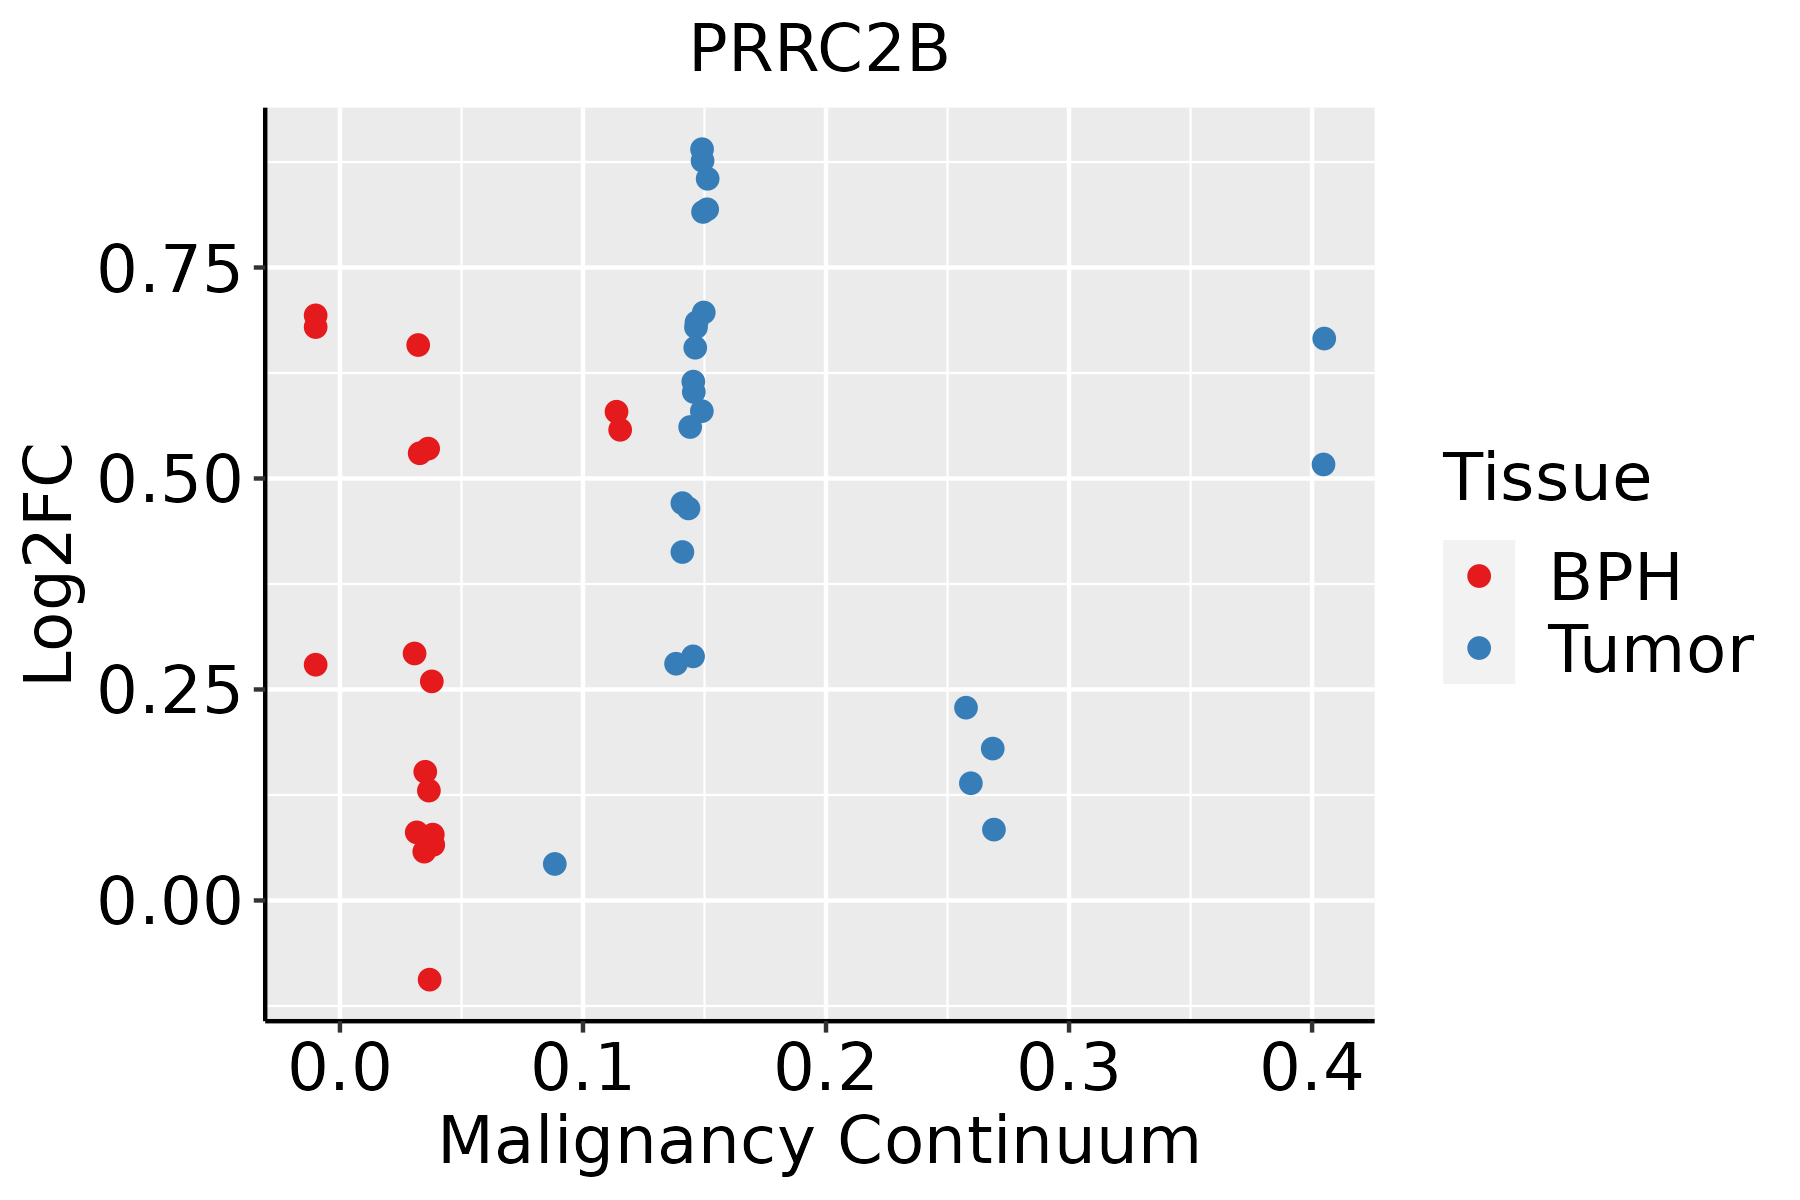 | BPH: Benign Prostatic Hyperplasia |
| Skin | 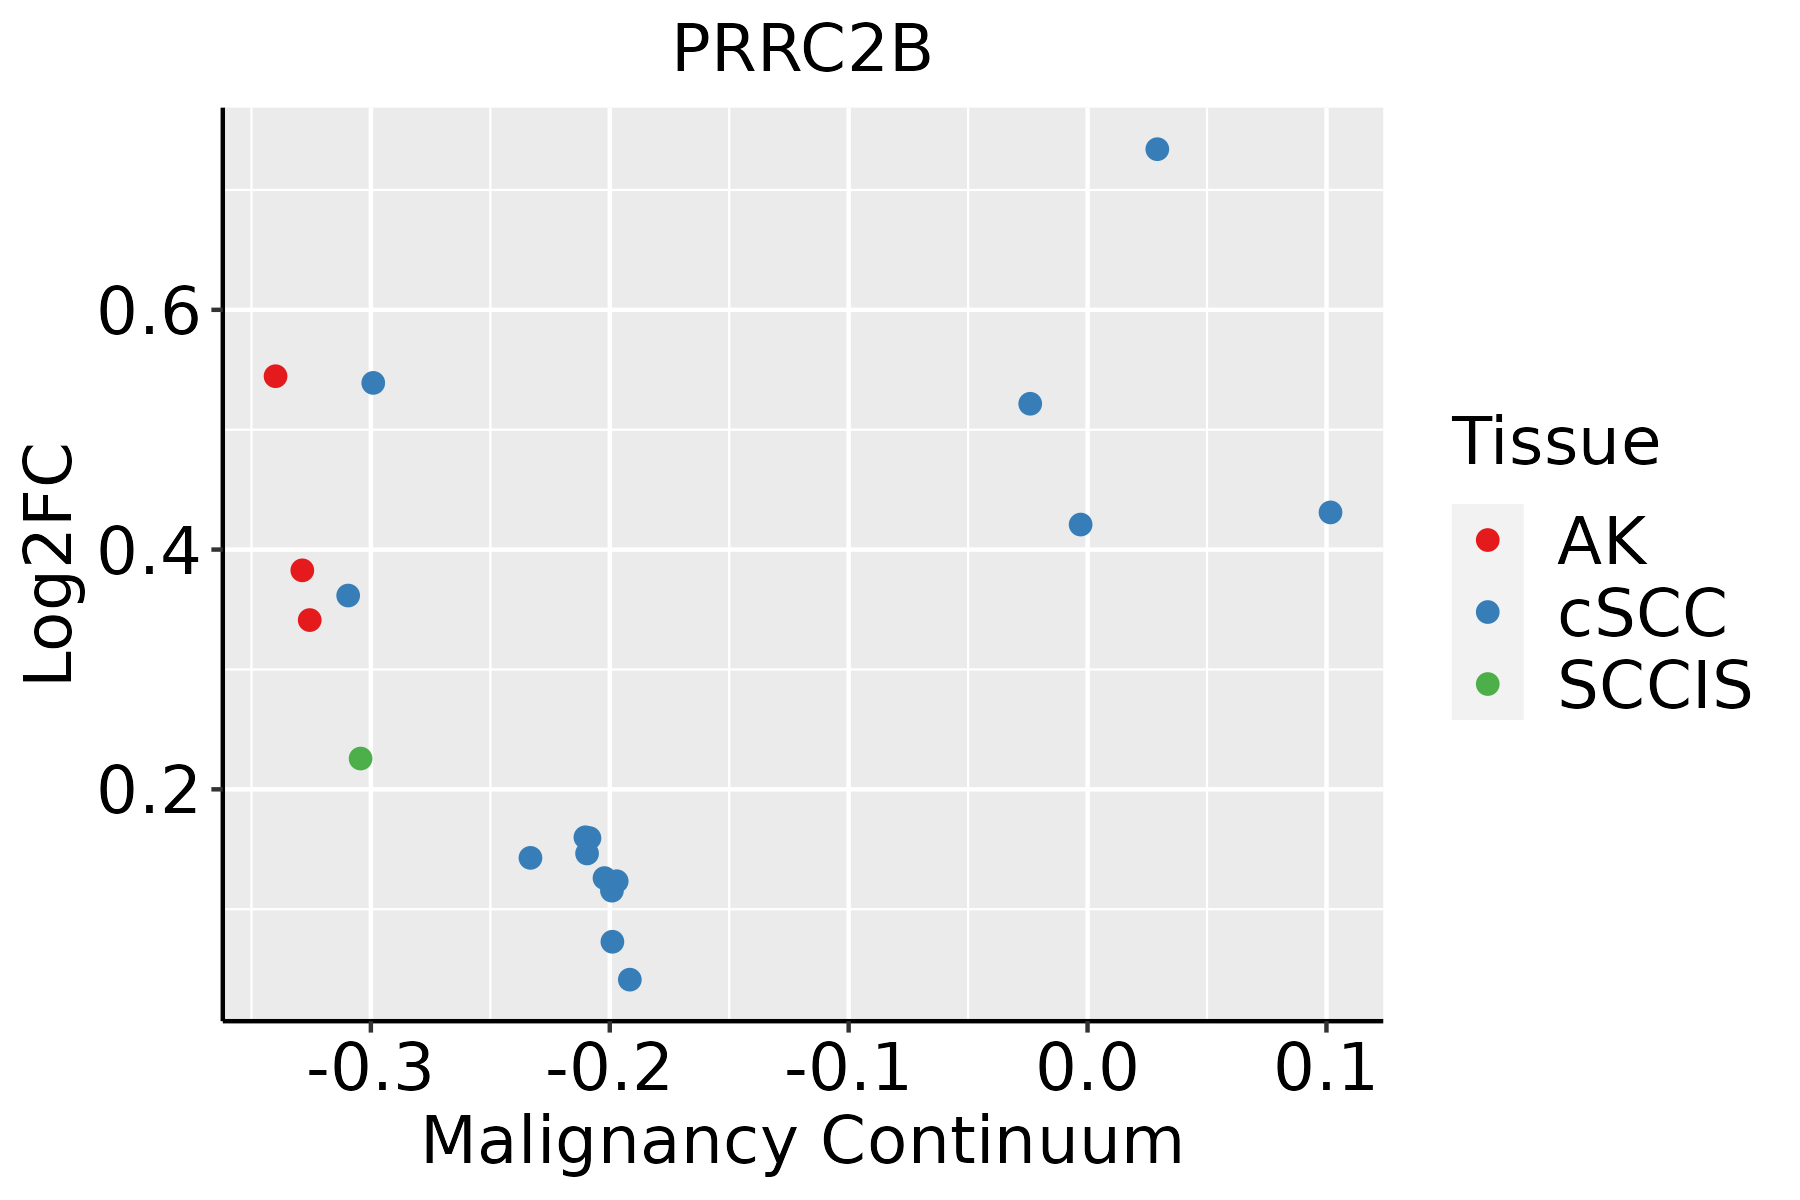 | AK: Actinic keratosis |
| cSCC: Cutaneous squamous cell carcinoma | ||
| SCCIS:squamous cell carcinoma in situ | ||
| Thyroid | 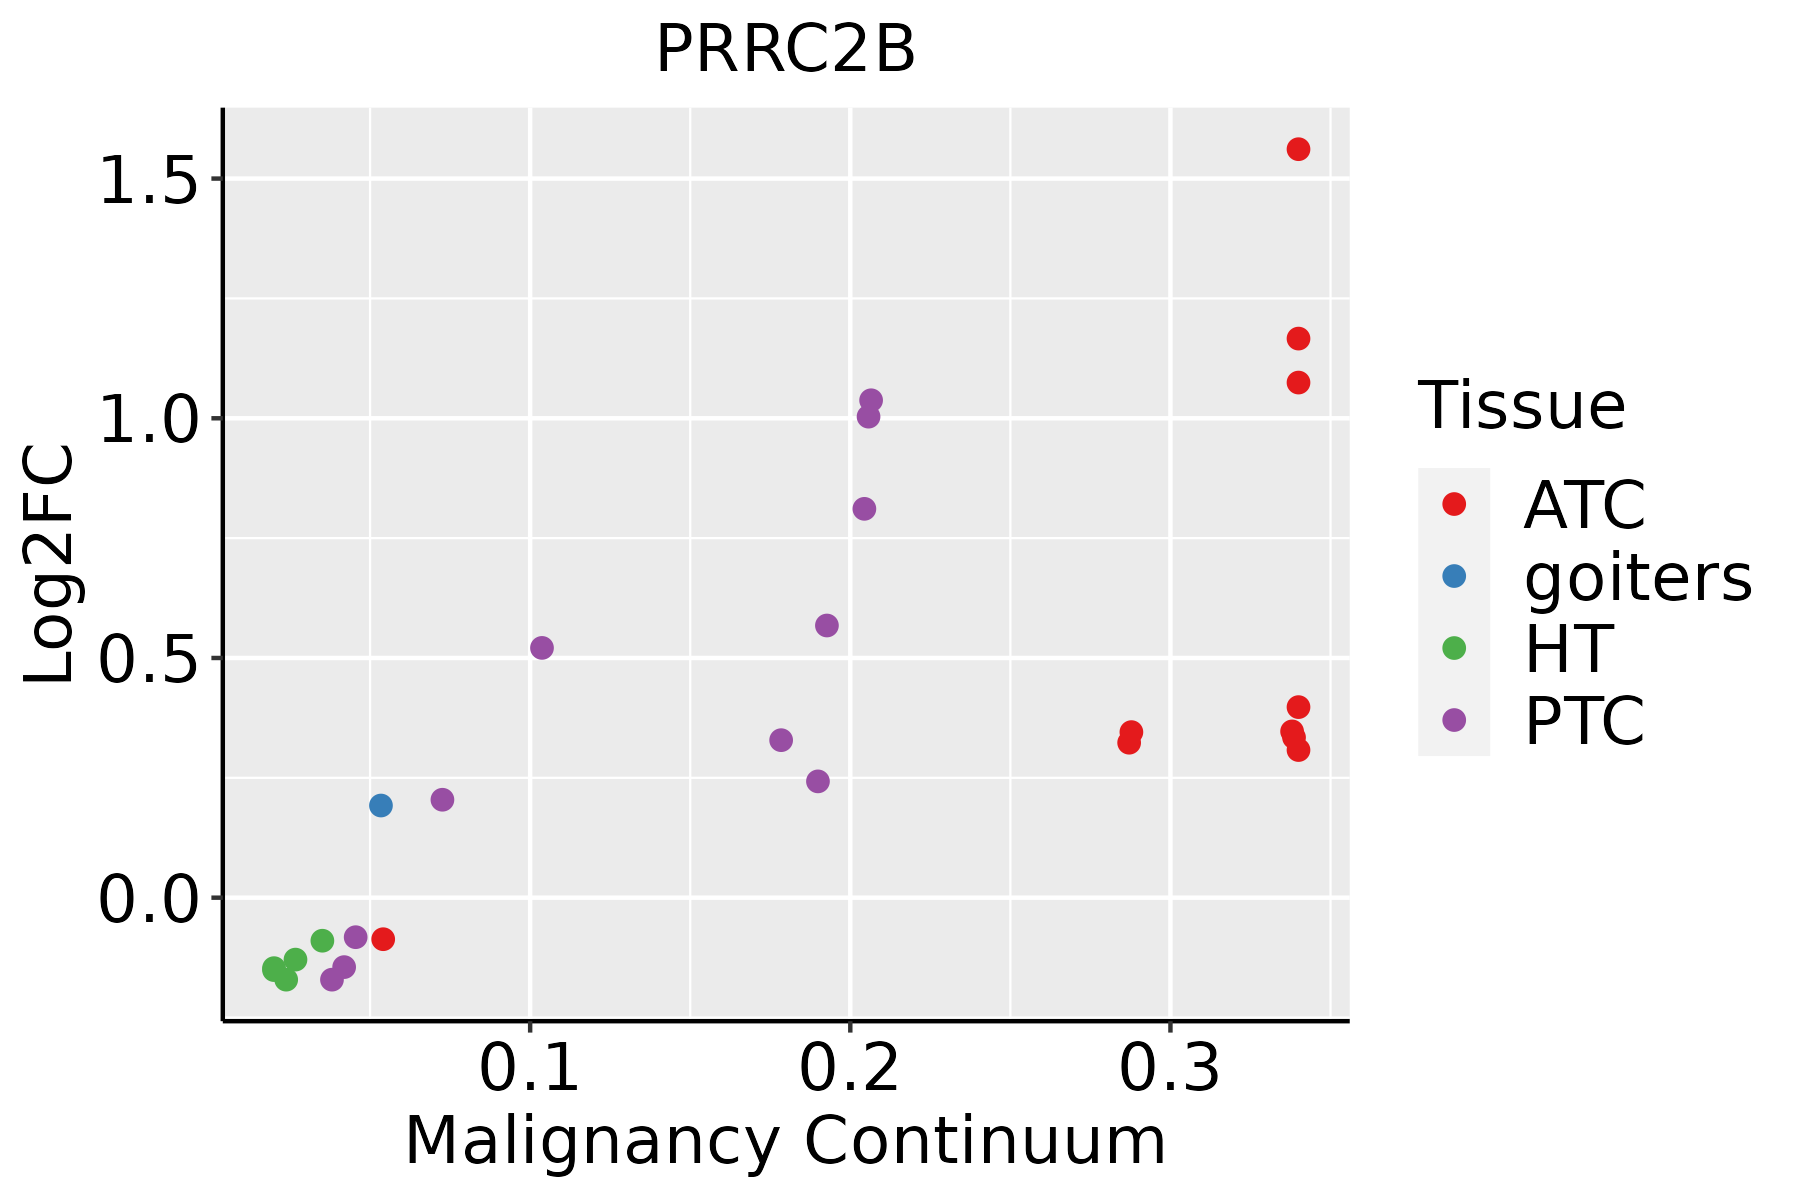 | ATC: Anaplastic thyroid cancer |
| HT: Hashimoto's thyroiditis | ||
| PTC: Papillary thyroid cancer |
| ∗log2FC in expression of this searched gene in stem-like cells from each diseased tissue sample relative to stem-like cells in normal samples in each tissue plotted against the malignancy continuum. Samples are colored based on if they are from different disease stage. |
Top |
Malignant transformation related pathway analysis |
| Find out the enriched GO biological processes and KEGG pathways involved in transition from healthy to precancer to cancer |
| Tissue | Disease Stage | Enriched GO biological Processes |
| Colorectum | AD |  |
| Colorectum | SER |  |
| Colorectum | MSS |  |
| Colorectum | MSI-H |  |
| Colorectum | FAP |  |
| ∗Top 15 enriched GO BP terms are showed in the bar plot of each disease state in each tissue. Each row represents a significant GO biological process which is colored according to the -log10(p.adjust). |
| Page: 1 2 3 4 5 6 7 8 9 |
| GO ID | Tissue | Disease Stage | Description | Gene Ratio | Bg Ratio | pvalue | p.adjust | Count |
| Page: 1 |
| Pathway ID | Tissue | Disease Stage | Description | Gene Ratio | Bg Ratio | pvalue | p.adjust | qvalue | Count |
| Page: 1 |
Top |
Cell-cell communication analysis |
| Identification of potential cell-cell interactions between two cell types and their ligand-receptor pairs for different disease states |
| Ligand | Receptor | LRpair | Pathway | Tissue | Disease Stage |
| Page: 1 |
Top |
Single-cell gene regulatory network inference analysis |
| Find out the significant the regulons (TFs) and the target genes of each regulon across cell types for different disease states |
| TF | Cell Type | Tissue | Disease Stage | Target Gene | RSS | Regulon Activity |
| ∗The dot plots of a searched regulon are shown for all cell subpopulations in each disease state of each tissue based on the regulon specific score inferred using pySCENIC and by calculating the average expression. |
| Page: 1 |
Top |
Somatic mutation of malignant transformation related genes |
| Annotation of somatic variants for genes involved in malignant transformation |
| Hugo Symbol | Variant Class | Variant Classification | dbSNP RS | HGVSc | HGVSp | HGVSp Short | SWISSPROT | BIOTYPE | SIFT | PolyPhen | Tumor Sample Barcode | Tissue | Histology | Sex | Age | Stage | Therapy Types | Drugs | Outcome |
| PRRC2B | SNV | Missense_Mutation | c.2342N>T | p.Ser781Phe | p.S781F | Q5JSZ5 | protein_coding | deleterious(0.01) | benign(0.007) | TCGA-AC-A23H-01 | Breast | breast invasive carcinoma | Female | >=65 | I/II | Unknown | Unknown | PD | |
| PRRC2B | SNV | Missense_Mutation | c.5326N>A | p.Asp1776Asn | p.D1776N | Q5JSZ5 | protein_coding | deleterious(0.02) | probably_damaging(0.998) | TCGA-AC-A23H-01 | Breast | breast invasive carcinoma | Female | >=65 | I/II | Unknown | Unknown | PD | |
| PRRC2B | SNV | Missense_Mutation | c.1955C>A | p.Pro652Gln | p.P652Q | Q5JSZ5 | protein_coding | deleterious(0) | probably_damaging(0.942) | TCGA-AO-A03P-01 | Breast | breast invasive carcinoma | Female | <65 | I/II | Hormone Therapy | letrozole | PD | |
| PRRC2B | SNV | Missense_Mutation | novel | c.283G>T | p.Asp95Tyr | p.D95Y | Q5JSZ5 | protein_coding | deleterious(0) | probably_damaging(0.999) | TCGA-AO-A0J4-01 | Breast | breast invasive carcinoma | Female | <65 | I/II | Chemotherapy | doxorubicin | SD |
| PRRC2B | SNV | Missense_Mutation | c.1774C>T | p.Pro592Ser | p.P592S | Q5JSZ5 | protein_coding | tolerated(0.16) | benign(0.007) | TCGA-AO-A0JB-01 | Breast | breast invasive carcinoma | Female | <65 | III/IV | Chemotherapy | cyclophosphamide | SD | |
| PRRC2B | SNV | Missense_Mutation | rs200364610 | c.101N>G | p.Ala34Gly | p.A34G | Q5JSZ5 | protein_coding | deleterious(0) | benign(0.387) | TCGA-B6-A0I1-01 | Breast | breast invasive carcinoma | Female | >=65 | I/II | Unknown | Unknown | PD |
| PRRC2B | SNV | Missense_Mutation | c.4274N>A | p.Arg1425Lys | p.R1425K | Q5JSZ5 | protein_coding | deleterious(0) | probably_damaging(0.978) | TCGA-BH-A0DX-01 | Breast | breast invasive carcinoma | Female | <65 | I/II | Chemotherapy | taxotere | CR | |
| PRRC2B | SNV | Missense_Mutation | c.568N>A | p.Val190Ile | p.V190I | Q5JSZ5 | protein_coding | tolerated(0.08) | benign(0.339) | TCGA-C8-A12Z-01 | Breast | breast invasive carcinoma | Female | <65 | I/II | Chemotherapy | 5-fluorouracil | CR | |
| PRRC2B | SNV | Missense_Mutation | c.2587N>A | p.Glu863Lys | p.E863K | Q5JSZ5 | protein_coding | tolerated(0.2) | benign(0.024) | TCGA-D8-A1JK-01 | Breast | breast invasive carcinoma | Female | >=65 | I/II | Unknown | Unknown | SD | |
| PRRC2B | SNV | Missense_Mutation | c.806N>C | p.Met269Thr | p.M269T | Q5JSZ5 | protein_coding | tolerated(0.16) | benign(0.039) | TCGA-D8-A1XK-01 | Breast | breast invasive carcinoma | Female | <65 | I/II | Chemotherapy | doxorubicine+cyclophosphamide | SD |
| Page: 1 2 3 4 5 6 7 8 9 10 11 12 13 14 15 16 17 18 19 20 21 |
Top |
Related drugs of malignant transformation related genes |
| Identification of chemicals and drugs interact with genes involved in malignant transfromation |
| (DGIdb 4.0) |
| Entrez ID | Symbol | Category | Interaction Types | Drug Claim Name | Drug Name | PMIDs |
| Page: 1 |

Copyright 2023-Present -The University of Texas Health Science Center at Houston |