
|
|||||
|
 | |
| |
| |
| |
| |
| |
|
Gene: MT1X |
Gene summary for MT1X |
| Gene information | Species | Human | Gene symbol | MT1X | Gene ID | 4501 |
| Gene name | metallothionein 1X | |
| Gene Alias | MT-1l | |
| Cytomap | 16q13 | |
| Gene Type | protein-coding | GO ID | GO:0006873 | UniProtAcc | A0A140VJP8 |
Top |
Malignant transformation analysis |
| Identification of the aberrant gene expression in precancerous and cancerous lesions by comparing the gene expression of stem-like cells in diseased tissues with normal stem cells |
| Entrez ID | Symbol | Replicates | Species | Organ | Tissue | Adj P-value | Log2FC | Malignancy |
| 4501 | MT1X | SYSMH6 | Human | Oral cavity | OSCC | 2.92e-04 | 1.31e+00 | 0.1275 |
| 4501 | MT1X | HTA12-25-1 | Human | Pancreas | PDAC | 1.61e-03 | -7.78e-01 | 0.313 |
| 4501 | MT1X | HTA12-29-1 | Human | Pancreas | PDAC | 1.29e-14 | -7.27e-01 | 0.3722 |
| 4501 | MT1X | 3829-EC | Human | Pancreas | PanIN | 1.32e-07 | 2.23e-01 | 0.009 |
| 4501 | MT1X | 4347-EC | Human | Pancreas | PanIN | 8.16e-13 | 1.20e-01 | 0.0572 |
| 4501 | MT1X | 4741-EC2 | Human | Pancreas | PanIN | 9.33e-04 | -4.25e-01 | 0.0194 |
| 4501 | MT1X | DS20191261Tumor | Human | Pancreas | PDAC | 3.27e-09 | -7.24e-01 | 0.1367 |
| 4501 | MT1X | GSM5252126_BPH283PrGF_Via | Human | Prostate | BPH | 4.27e-11 | 2.76e+00 | -0.1771 |
| 4501 | MT1X | GSM5252127_BPH283PrSF_Via | Human | Prostate | BPH | 3.95e-06 | 1.53e+00 | -0.1453 |
| 4501 | MT1X | GSM5252128_BPH327PrGF_Via | Human | Prostate | BPH | 5.73e-10 | 2.48e+00 | -0.1688 |
| 4501 | MT1X | GSM5252129_BPH327PrSF_Via | Human | Prostate | BPH | 3.23e-06 | 2.04e+00 | -0.1697 |
| 4501 | MT1X | GSM5252130_BPH340PrGF_Via | Human | Prostate | BPH | 1.07e-02 | 1.45e+00 | -0.1972 |
| 4501 | MT1X | GSM5252131_BPH340PrSF_Via | Human | Prostate | BPH | 4.32e-05 | 1.67e+00 | -0.2126 |
| 4501 | MT1X | GSM5252132_BPH389PrGF | Human | Prostate | BPH | 7.22e-03 | 1.26e+00 | -0.2247 |
| 4501 | MT1X | GSM5252134_BPH511PrG_Fcol_3GEX | Human | Prostate | BPH | 5.12e-03 | 1.27e+00 | -0.1433 |
| 4501 | MT1X | GSM5252135_BPH511PrPUr_Fcol_3GEX | Human | Prostate | BPH | 1.11e-13 | 8.36e-01 | -0.1833 |
| 4501 | MT1X | GSM5252136_BPH556PrGA1_Fcol | Human | Prostate | BPH | 4.36e-18 | 2.18e+00 | -0.23 |
| 4501 | MT1X | GSM5252137_BPH556PrGA2_Fcol | Human | Prostate | BPH | 5.60e-13 | 2.59e+00 | -0.23 |
| 4501 | MT1X | 047563_1562-all-cells | Human | Prostate | BPH | 5.92e-11 | -4.91e-01 | 0.0791 |
| 4501 | MT1X | 048752_1579-all-cells | Human | Prostate | BPH | 2.23e-17 | -3.64e-01 | 0.1008 |
| Page: 1 2 3 4 5 6 7 8 9 10 11 12 |
| Tissue | Expression Dynamics | Abbreviation |
| Breast |  | IDC: Invasive ductal carcinoma |
| DCIS: Ductal carcinoma in situ | ||
| Precancer(BRCA1-mut): Precancerous lesion from BRCA1 mutation carriers | ||
| Cervix | 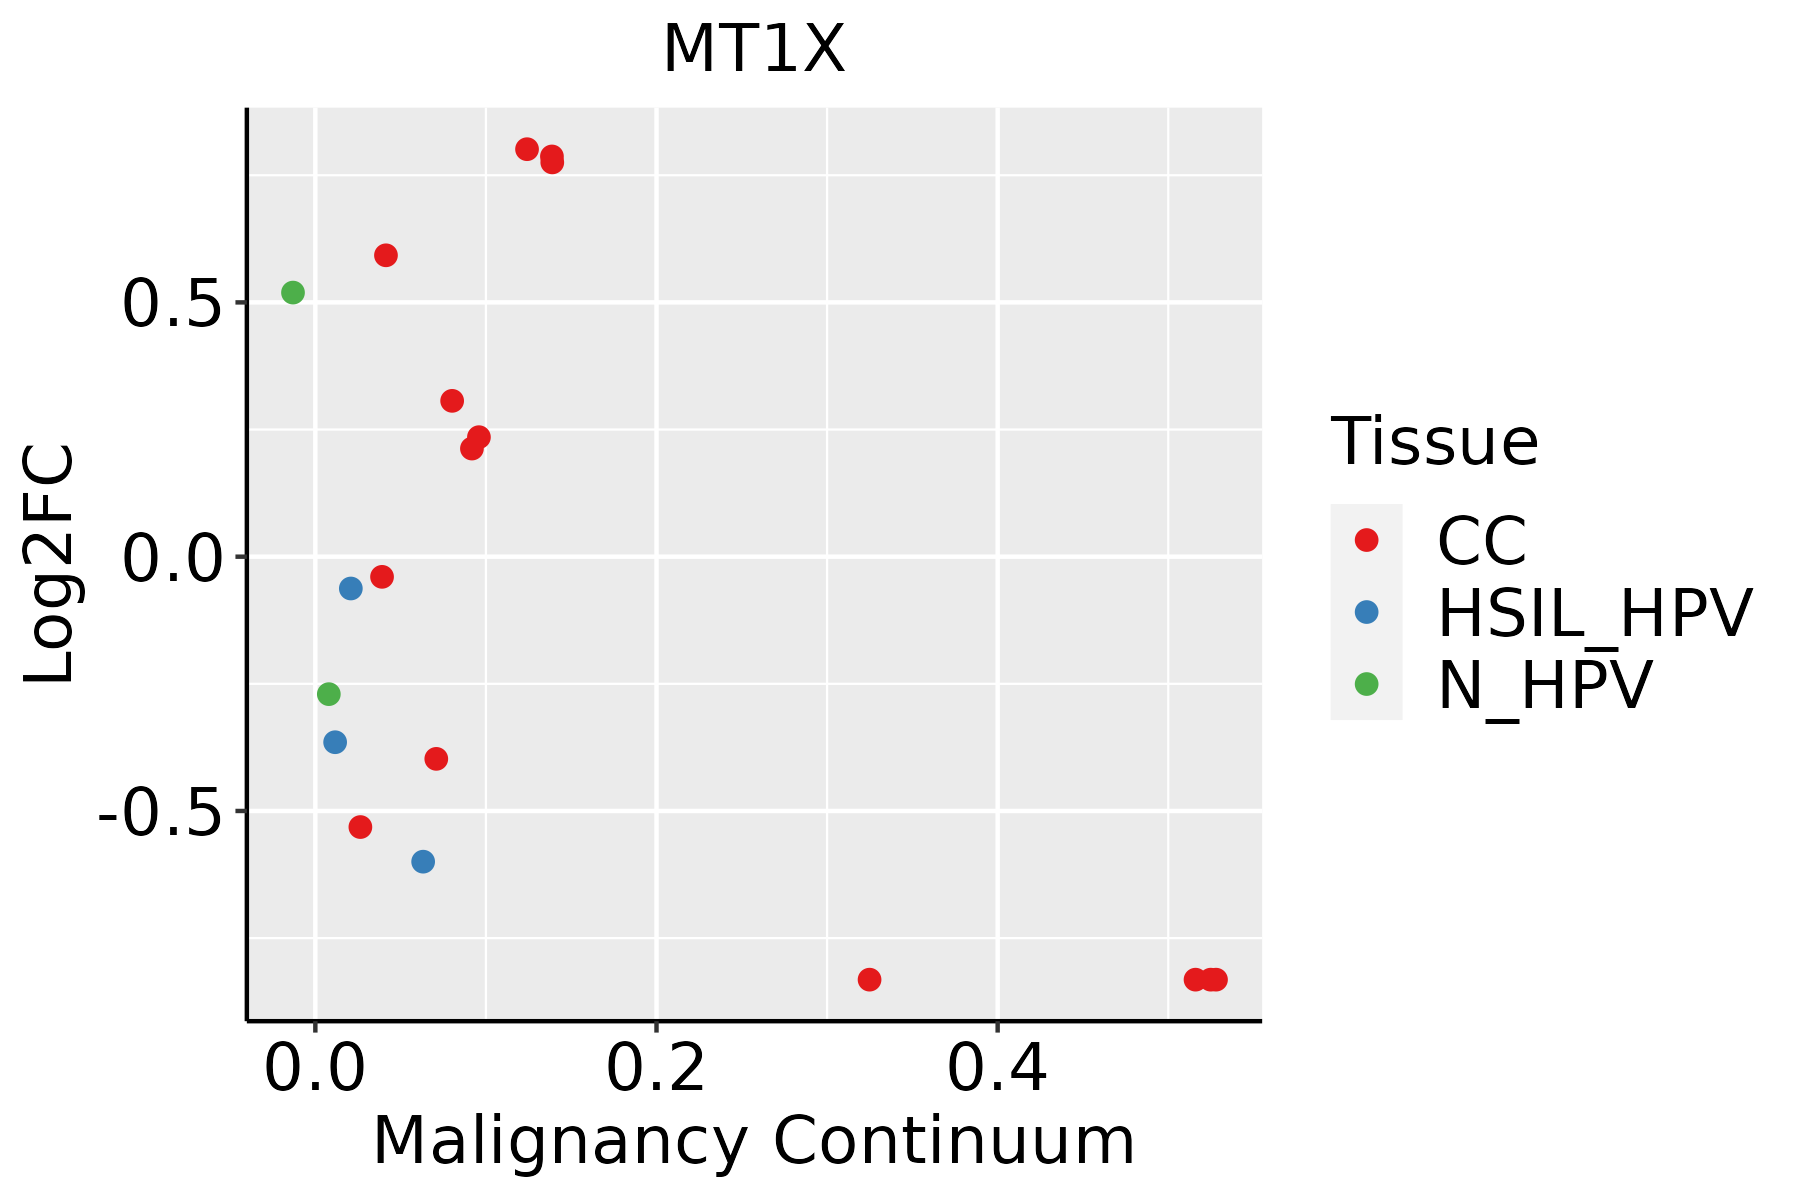 | CC: Cervix cancer |
| HSIL_HPV: HPV-infected high-grade squamous intraepithelial lesions | ||
| N_HPV: HPV-infected normal cervix | ||
| Colorectum (GSE201348) | 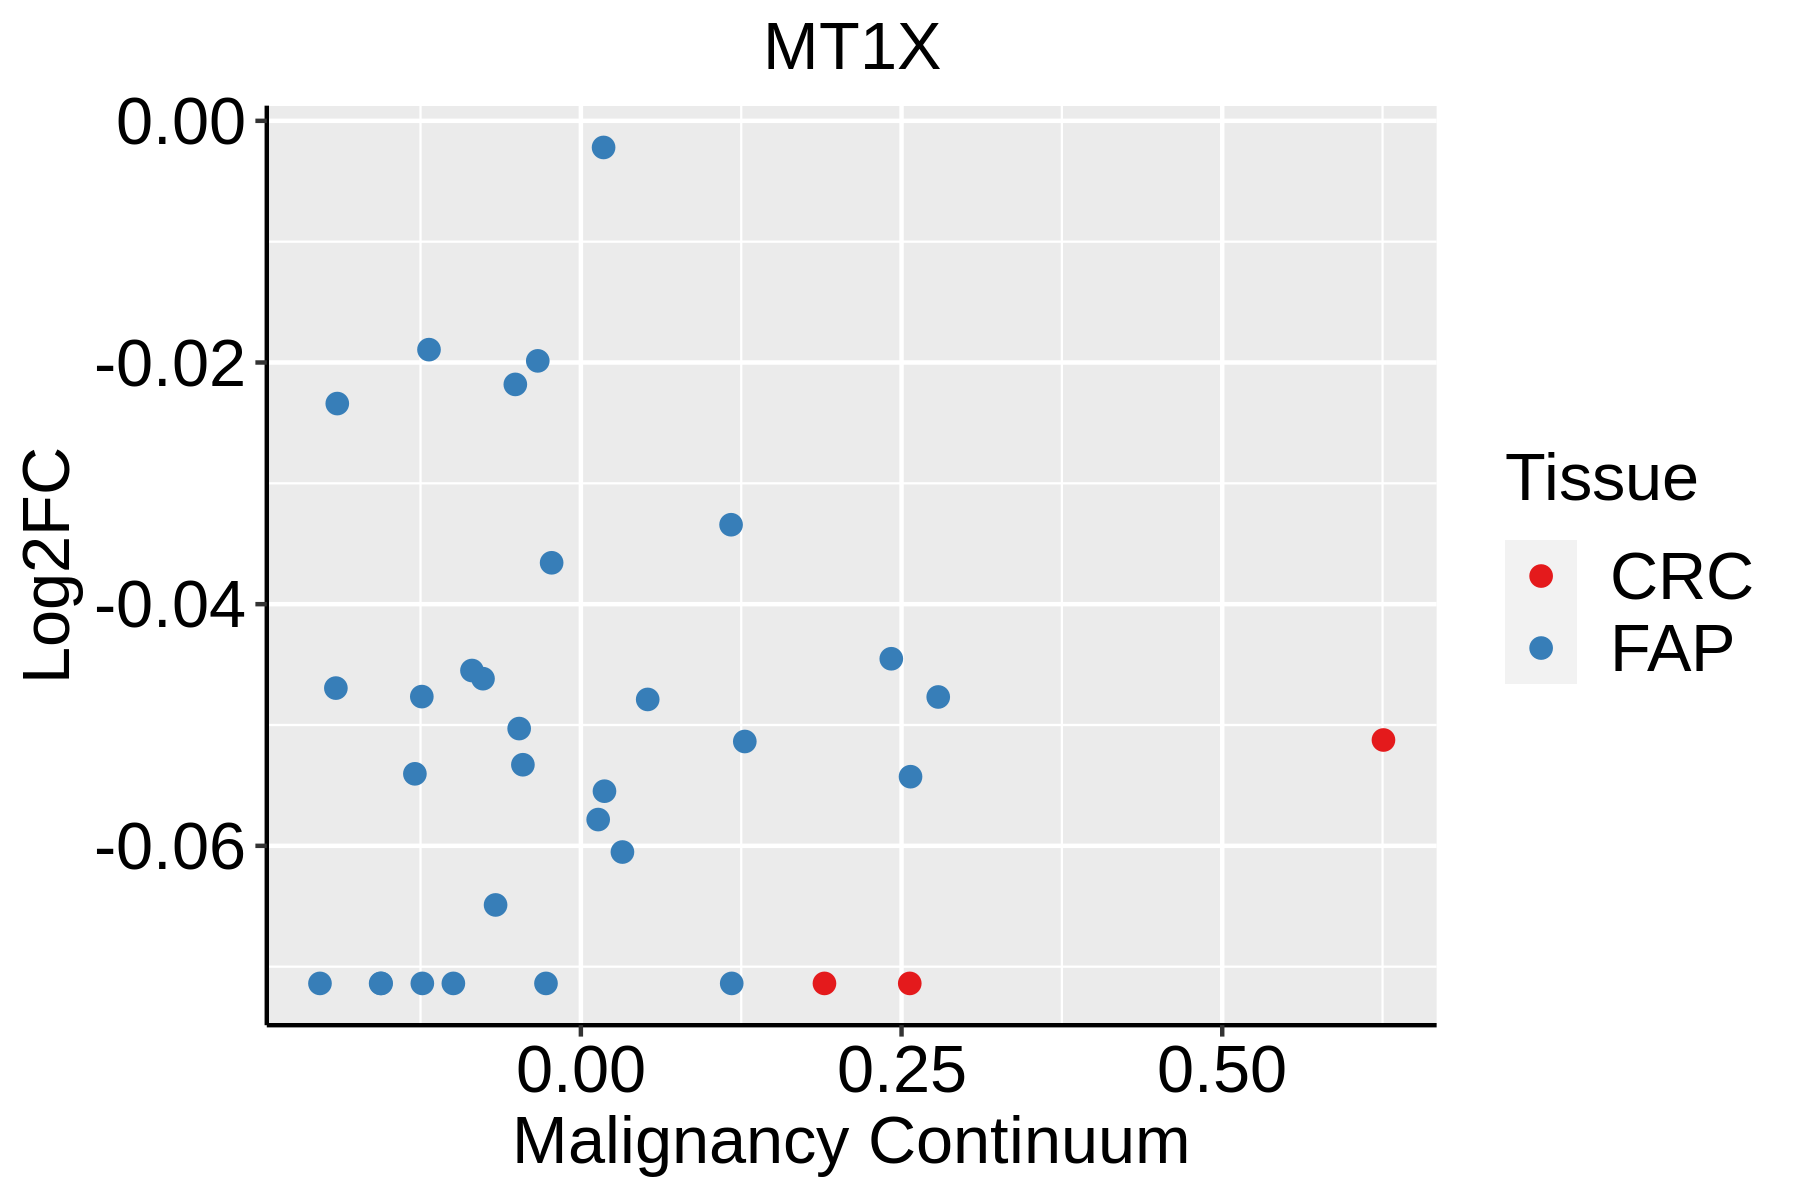 | FAP: Familial adenomatous polyposis |
| CRC: Colorectal cancer | ||
| Colorectum (HTA11) |  | AD: Adenomas |
| SER: Sessile serrated lesions | ||
| MSI-H: Microsatellite-high colorectal cancer | ||
| MSS: Microsatellite stable colorectal cancer | ||
| Esophagus | 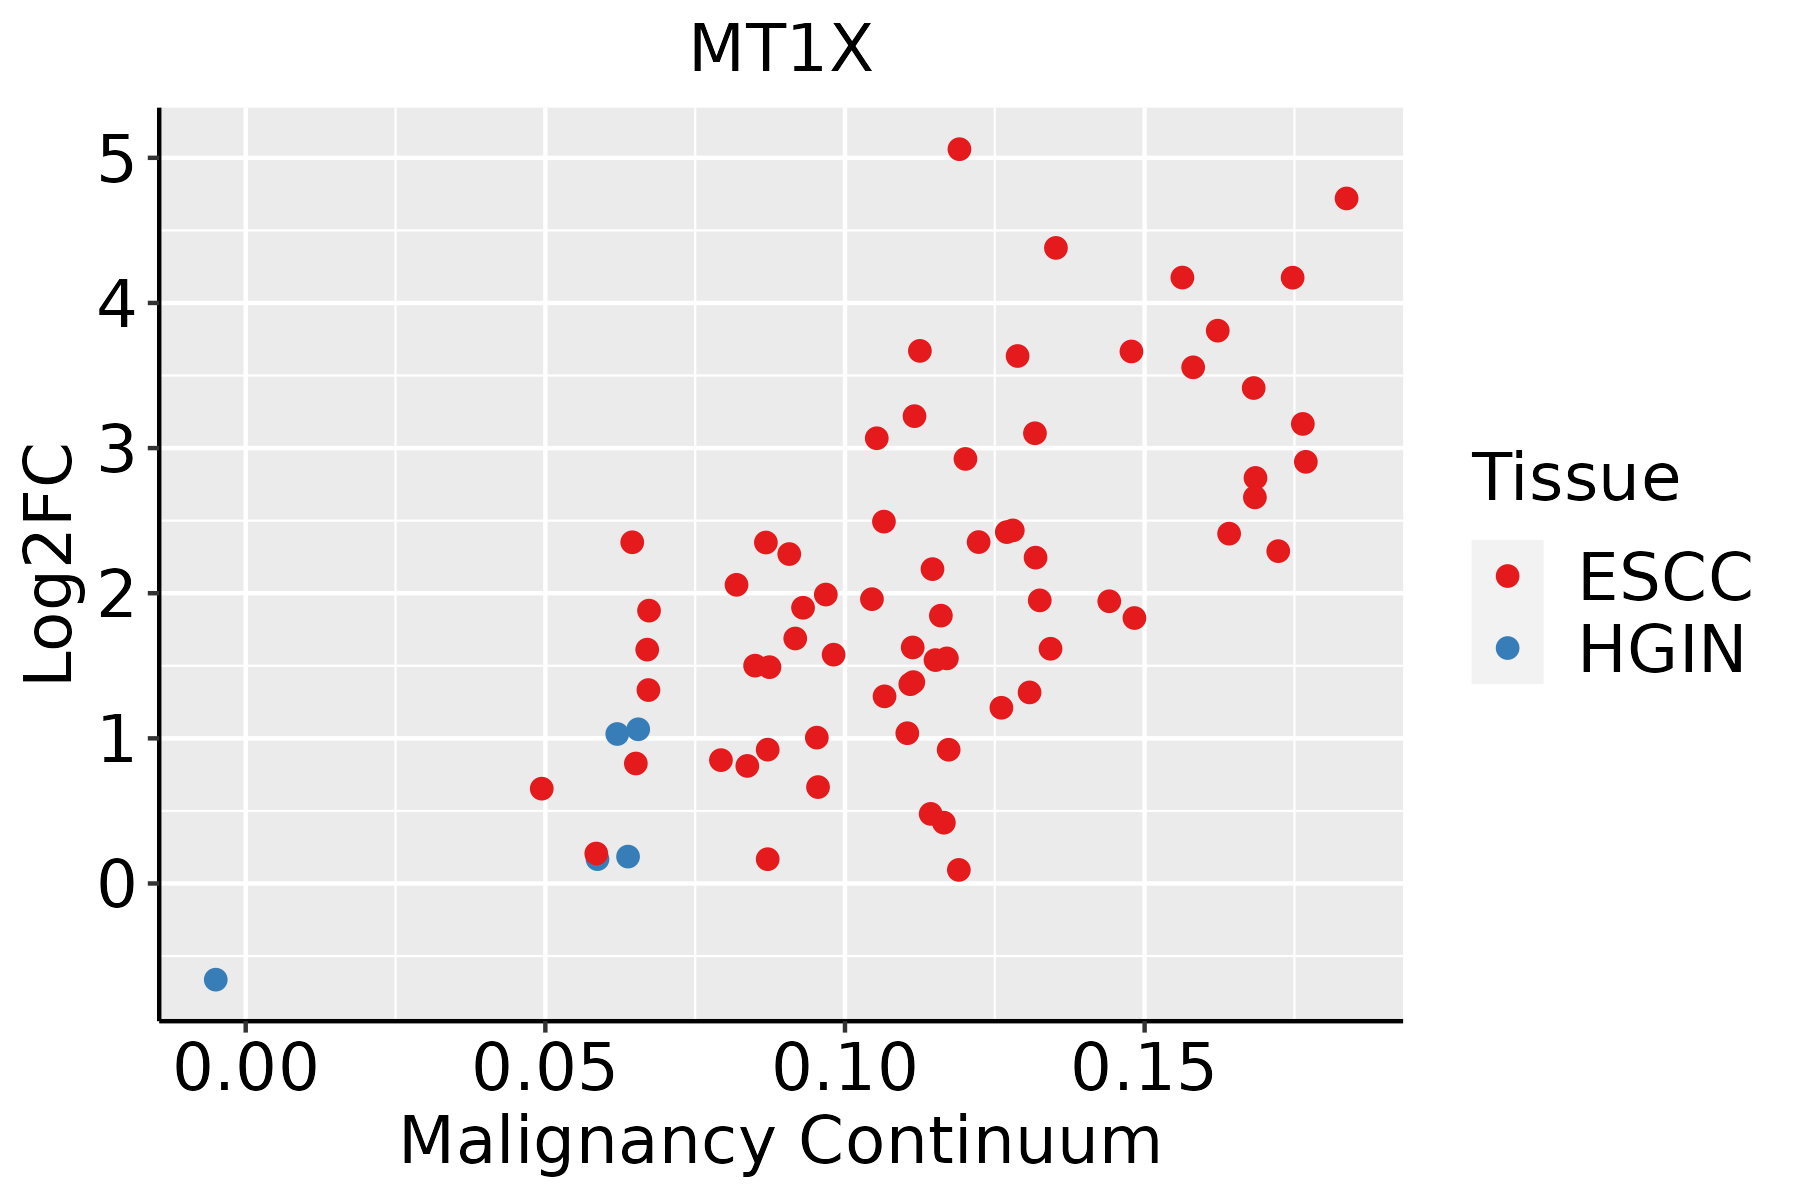 | ESCC: Esophageal squamous cell carcinoma |
| HGIN: High-grade intraepithelial neoplasias | ||
| LGIN: Low-grade intraepithelial neoplasias | ||
| Liver | 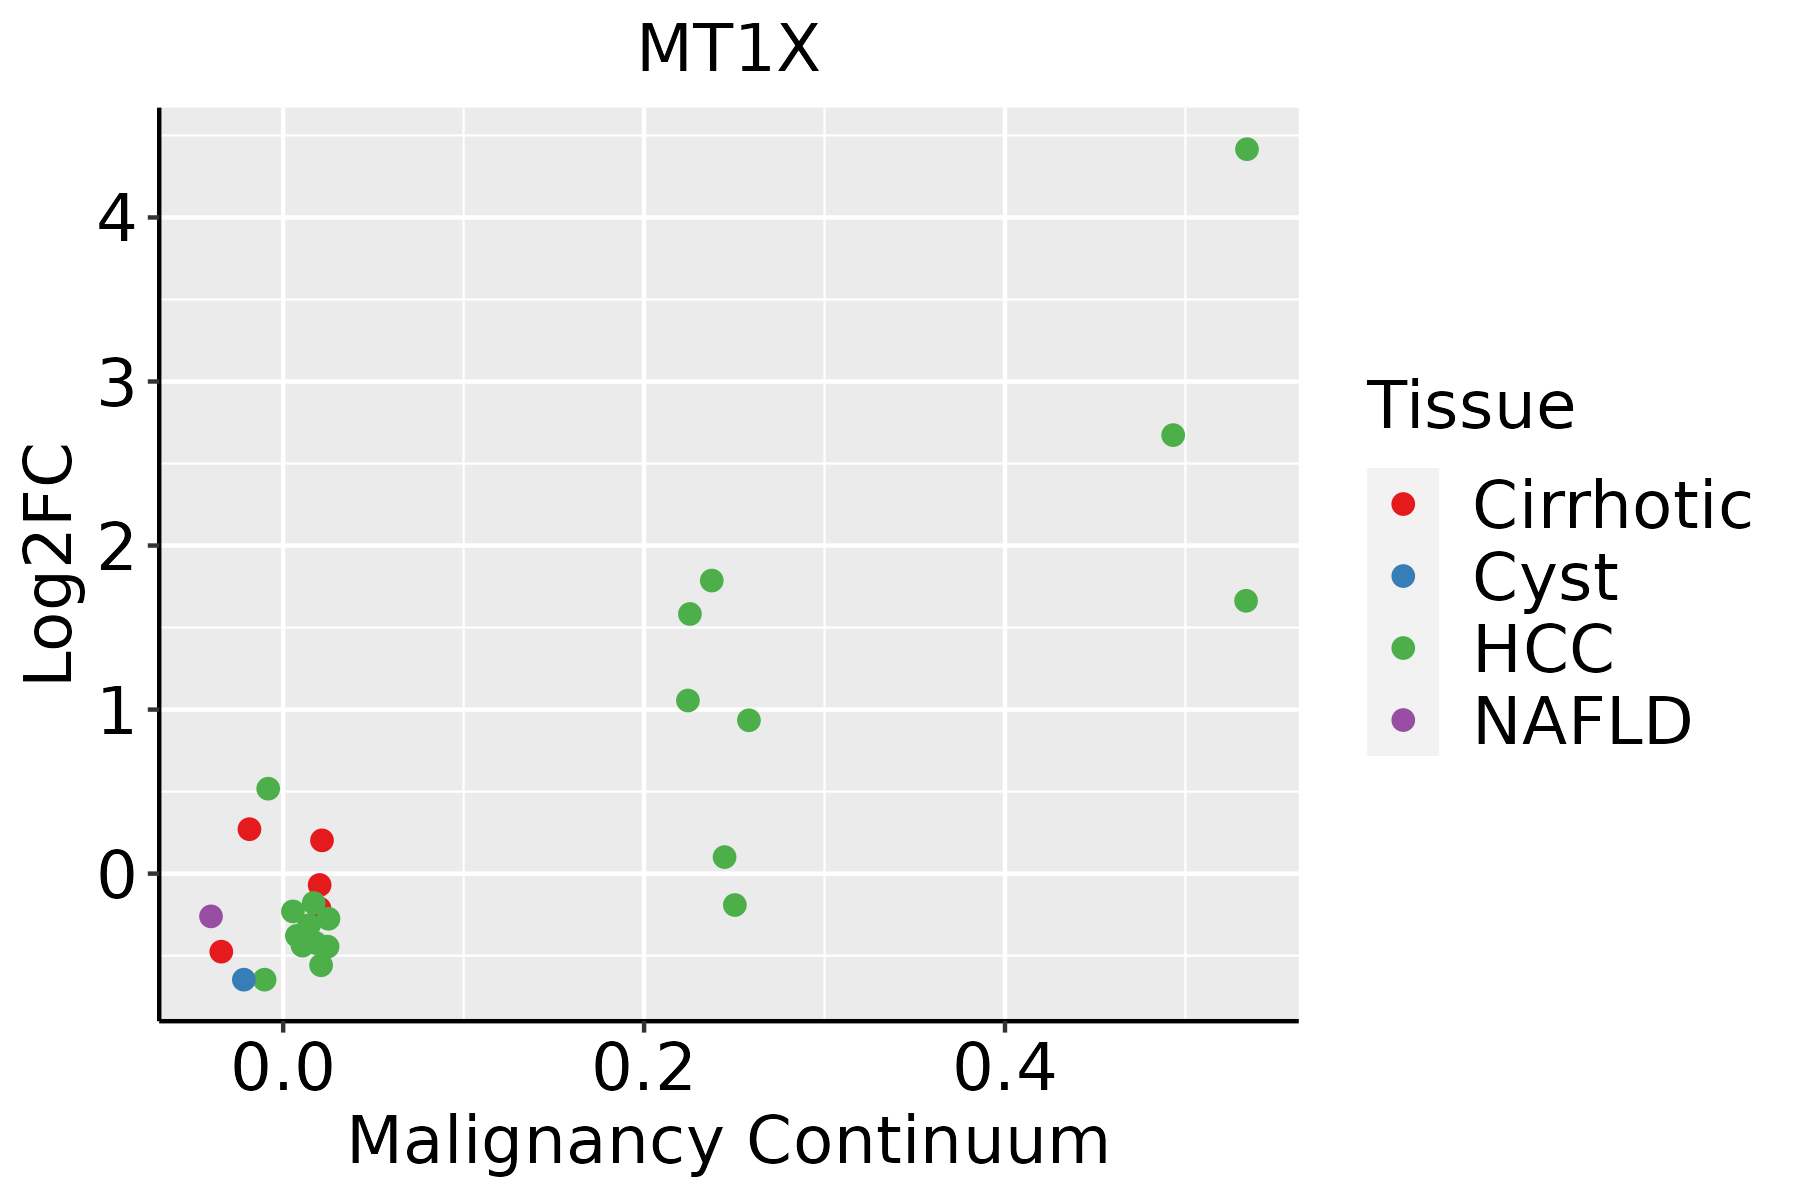 | HCC: Hepatocellular carcinoma |
| NAFLD: Non-alcoholic fatty liver disease | ||
| Oral Cavity |  | EOLP: Erosive Oral lichen planus |
| LP: leukoplakia | ||
| NEOLP: Non-erosive oral lichen planus | ||
| OSCC: Oral squamous cell carcinoma | ||
| Prostate |  | BPH: Benign Prostatic Hyperplasia |
| Skin |  | AK: Actinic keratosis |
| cSCC: Cutaneous squamous cell carcinoma | ||
| SCCIS:squamous cell carcinoma in situ | ||
| Thyroid | 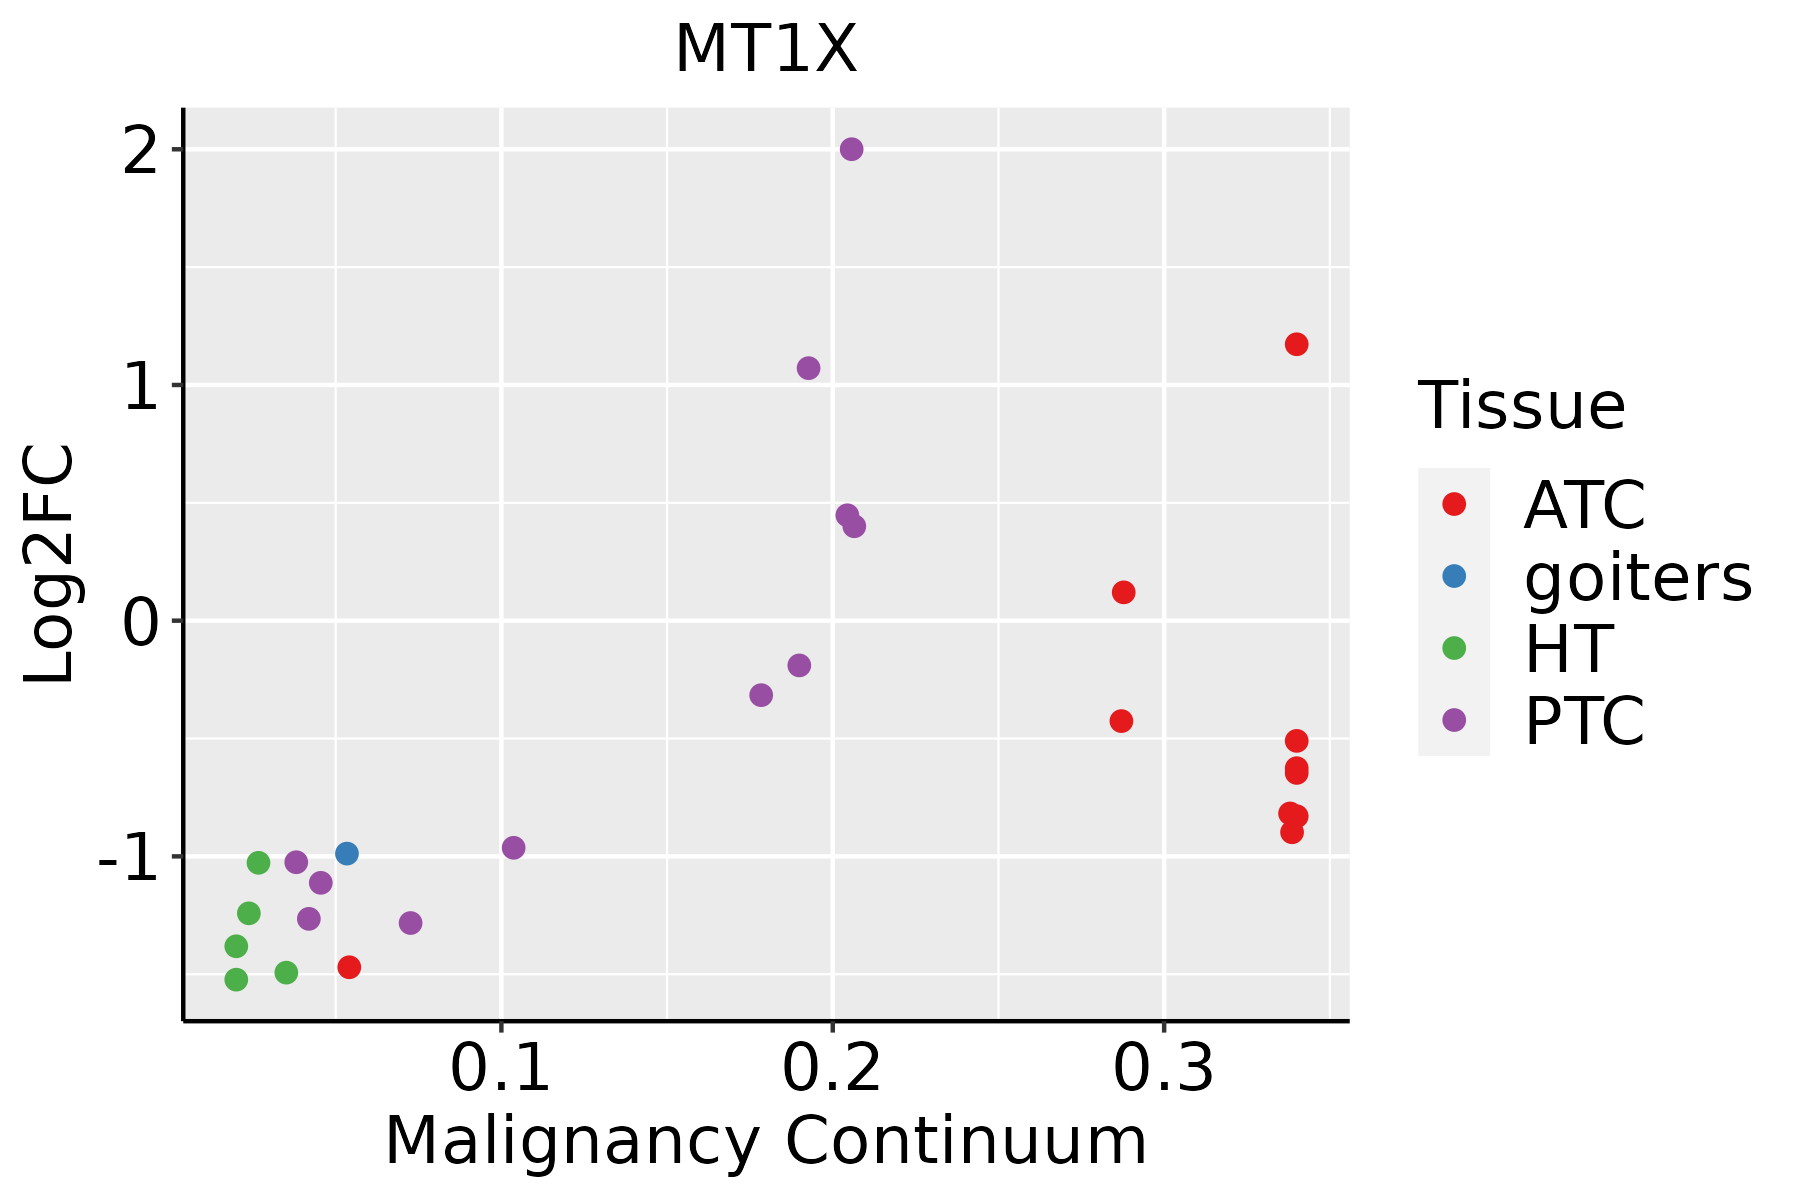 | ATC: Anaplastic thyroid cancer |
| HT: Hashimoto's thyroiditis | ||
| PTC: Papillary thyroid cancer |
| ∗log2FC in expression of this searched gene in stem-like cells from each diseased tissue sample relative to stem-like cells in normal samples in each tissue plotted against the malignancy continuum. Samples are colored based on if they are from different disease stage. |
Top |
Malignant transformation related pathway analysis |
| Find out the enriched GO biological processes and KEGG pathways involved in transition from healthy to precancer to cancer |
| Tissue | Disease Stage | Enriched GO biological Processes |
| Colorectum | AD |  |
| Colorectum | SER |  |
| Colorectum | MSS |  |
| Colorectum | MSI-H |  |
| Colorectum | FAP |  |
| ∗Top 15 enriched GO BP terms are showed in the bar plot of each disease state in each tissue. Each row represents a significant GO biological process which is colored according to the -log10(p.adjust). |
| Page: 1 2 3 4 5 6 7 8 9 |
| GO ID | Tissue | Disease Stage | Description | Gene Ratio | Bg Ratio | pvalue | p.adjust | Count |
| GO:00100389 | Breast | Precancer | response to metal ion | 47/1080 | 373/18723 | 3.88e-07 | 1.79e-05 | 47 |
| GO:00987548 | Breast | Precancer | detoxification | 24/1080 | 152/18723 | 6.49e-06 | 1.81e-04 | 24 |
| GO:00466868 | Breast | Precancer | response to cadmium ion | 14/1080 | 68/18723 | 2.74e-05 | 6.21e-04 | 14 |
| GO:00096368 | Breast | Precancer | response to toxic substance | 31/1080 | 262/18723 | 1.18e-04 | 2.12e-03 | 31 |
| GO:00550767 | Breast | Precancer | transition metal ion homeostasis | 20/1080 | 138/18723 | 1.28e-04 | 2.24e-03 | 20 |
| GO:00469165 | Breast | Precancer | cellular transition metal ion homeostasis | 17/1080 | 115/18723 | 3.15e-04 | 4.49e-03 | 17 |
| GO:00712767 | Breast | Precancer | cellular response to cadmium ion | 9/1080 | 40/18723 | 3.69e-04 | 5.03e-03 | 9 |
| GO:00712488 | Breast | Precancer | cellular response to metal ion | 24/1080 | 197/18723 | 4.35e-04 | 5.79e-03 | 24 |
| GO:00712418 | Breast | Precancer | cellular response to inorganic substance | 26/1080 | 226/18723 | 6.23e-04 | 7.78e-03 | 26 |
| GO:00975017 | Breast | Precancer | stress response to metal ion | 5/1080 | 19/18723 | 3.73e-03 | 3.04e-02 | 5 |
| GO:00100435 | Breast | Precancer | response to zinc ion | 9/1080 | 58/18723 | 5.67e-03 | 4.08e-02 | 9 |
| GO:0072503 | Breast | Precancer | cellular divalent inorganic cation homeostasis | 42/1080 | 486/18723 | 5.91e-03 | 4.21e-02 | 42 |
| GO:001003814 | Breast | IDC | response to metal ion | 65/1434 | 373/18723 | 2.95e-10 | 3.42e-08 | 65 |
| GO:004668613 | Breast | IDC | response to cadmium ion | 19/1434 | 68/18723 | 4.97e-07 | 2.45e-05 | 19 |
| GO:000963613 | Breast | IDC | response to toxic substance | 44/1434 | 262/18723 | 6.33e-07 | 3.00e-05 | 44 |
| GO:009875413 | Breast | IDC | detoxification | 29/1434 | 152/18723 | 3.97e-06 | 1.43e-04 | 29 |
| GO:007127613 | Breast | IDC | cellular response to cadmium ion | 11/1434 | 40/18723 | 1.48e-04 | 2.60e-03 | 11 |
| GO:005507613 | Breast | IDC | transition metal ion homeostasis | 23/1434 | 138/18723 | 3.20e-04 | 4.79e-03 | 23 |
| GO:001004311 | Breast | IDC | response to zinc ion | 13/1434 | 58/18723 | 3.59e-04 | 5.18e-03 | 13 |
| GO:004691612 | Breast | IDC | cellular transition metal ion homeostasis | 20/1434 | 115/18723 | 4.35e-04 | 5.90e-03 | 20 |
| Page: 1 2 3 4 5 6 7 8 9 10 11 12 13 14 15 |
| Pathway ID | Tissue | Disease Stage | Description | Gene Ratio | Bg Ratio | pvalue | p.adjust | qvalue | Count |
| hsa0497812 | Breast | IDC | Mineral absorption | 13/867 | 60/8465 | 6.73e-03 | 3.42e-02 | 2.56e-02 | 13 |
| hsa0497813 | Breast | IDC | Mineral absorption | 13/867 | 60/8465 | 6.73e-03 | 3.42e-02 | 2.56e-02 | 13 |
| hsa0497821 | Breast | DCIS | Mineral absorption | 13/846 | 60/8465 | 5.48e-03 | 2.81e-02 | 2.07e-02 | 13 |
| hsa0497831 | Breast | DCIS | Mineral absorption | 13/846 | 60/8465 | 5.48e-03 | 2.81e-02 | 2.07e-02 | 13 |
| hsa0497810 | Liver | Cyst | Mineral absorption | 8/339 | 60/8465 | 2.53e-03 | 2.08e-02 | 1.72e-02 | 8 |
| hsa0497811 | Liver | Cyst | Mineral absorption | 8/339 | 60/8465 | 2.53e-03 | 2.08e-02 | 1.72e-02 | 8 |
| hsa0497814 | Prostate | BPH | Mineral absorption | 20/1718 | 60/8465 | 1.22e-02 | 3.61e-02 | 2.23e-02 | 20 |
| hsa0497815 | Prostate | BPH | Mineral absorption | 20/1718 | 60/8465 | 1.22e-02 | 3.61e-02 | 2.23e-02 | 20 |
| Page: 1 |
Top |
Cell-cell communication analysis |
| Identification of potential cell-cell interactions between two cell types and their ligand-receptor pairs for different disease states |
| Ligand | Receptor | LRpair | Pathway | Tissue | Disease Stage |
| Page: 1 |
Top |
Single-cell gene regulatory network inference analysis |
| Find out the significant the regulons (TFs) and the target genes of each regulon across cell types for different disease states |
| TF | Cell Type | Tissue | Disease Stage | Target Gene | RSS | Regulon Activity |
| ∗The dot plots of a searched regulon are shown for all cell subpopulations in each disease state of each tissue based on the regulon specific score inferred using pySCENIC and by calculating the average expression. |
| Page: 1 |
Top |
Somatic mutation of malignant transformation related genes |
| Annotation of somatic variants for genes involved in malignant transformation |
| Hugo Symbol | Variant Class | Variant Classification | dbSNP RS | HGVSc | HGVSp | HGVSp Short | SWISSPROT | BIOTYPE | SIFT | PolyPhen | Tumor Sample Barcode | Tissue | Histology | Sex | Age | Stage | Therapy Types | Drugs | Outcome |
| MT1X | insertion | Nonsense_Mutation | novel | c.32_33insTCAGGGGGCTGCTGGCTGAGCCCCAATGCT | p.Gly11_Ser12insGlnGlyAlaAlaGlyTerAlaProMetLeu | p.G11_S12insQGAAG*APML | P80297 | protein_coding | TCGA-A2-A04T-01 | Breast | breast invasive carcinoma | Female | <65 | I/II | Chemotherapy | cyclophosphamide | SD | ||
| MT1X | deletion | In_Frame_Del | novel | c.55_69delNNNNNNNNNNNNNNN | p.Lys22_Cys26del | p.K22_C26del | P80297 | protein_coding | TCGA-OL-A5RY-01 | Breast | breast invasive carcinoma | Female | <65 | I/II | Unknown | Unknown | SD | ||
| MT1X | SNV | Missense_Mutation | rs376283692 | c.64N>G | p.Lys22Glu | p.K22E | P80297 | protein_coding | deleterious(0.03) | probably_damaging(0.989) | TCGA-D1-A175-01 | Endometrium | uterine corpus endometrioid carcinoma | Female | <65 | I/II | Chemotherapy | paclitaxel | SD |
| MT1X | insertion | In_Frame_Ins | novel | c.28_28+1insTTGGCTCCTGTGCCTGTGCCGGCTCCT | p.Ser18_Cys19insPheGlySerCysAlaCysAlaGlySer | p.S18_C19insFGSCACAGS | P80297 | protein_coding | TCGA-FP-7829-01 | Stomach | stomach adenocarcinoma | Male | >=65 | I/II | Chemotherapy | 5-fluorouracil | CR |
| Page: 1 |
Top |
Related drugs of malignant transformation related genes |
| Identification of chemicals and drugs interact with genes involved in malignant transfromation |
| (DGIdb 4.0) |
| Entrez ID | Symbol | Category | Interaction Types | Drug Claim Name | Drug Name | PMIDs |
| Page: 1 |

Copyright 2023-Present -The University of Texas Health Science Center at Houston |