| Tissue | Expression Dynamics | Abbreviation |
| Breast | 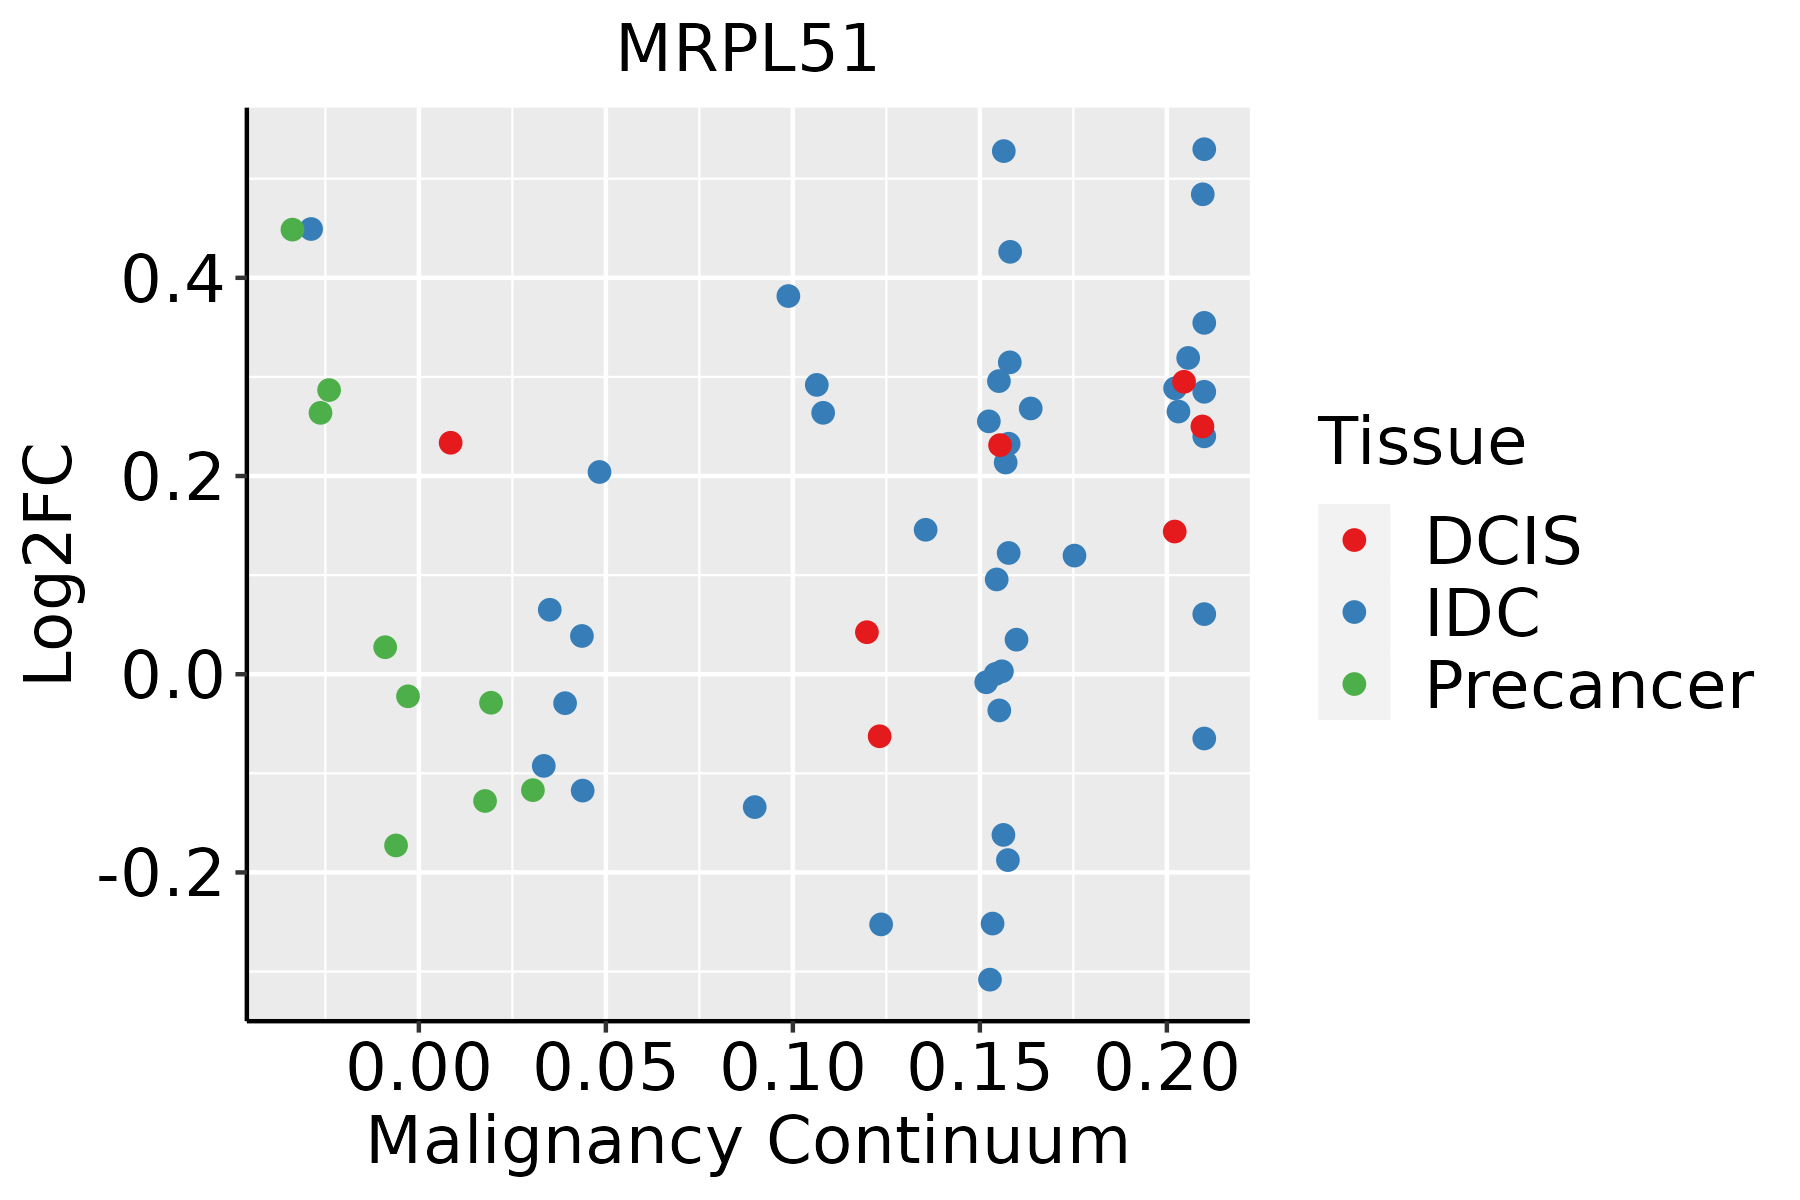 | IDC: Invasive ductal carcinoma |
| DCIS: Ductal carcinoma in situ |
| Precancer(BRCA1-mut): Precancerous lesion from BRCA1 mutation carriers |
| Cervix | 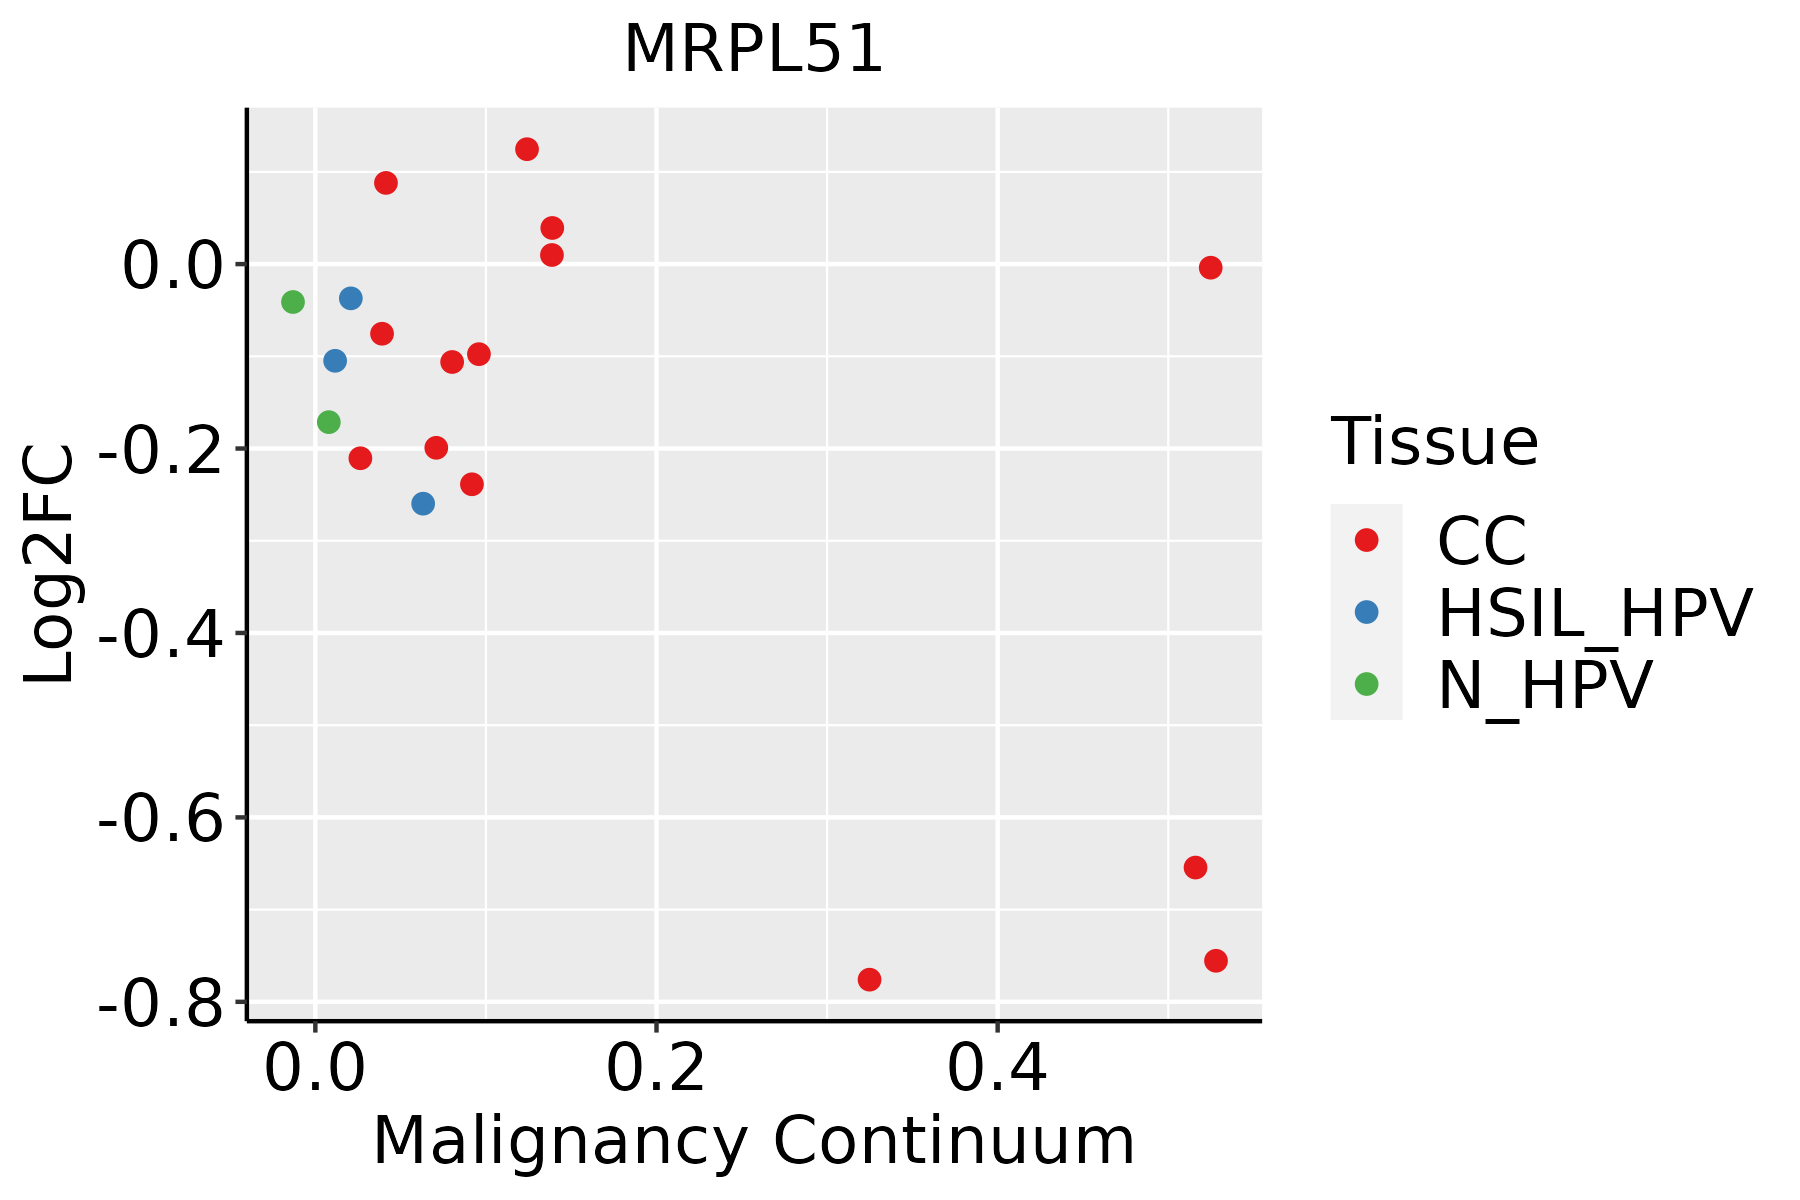 | CC: Cervix cancer |
| HSIL_HPV: HPV-infected high-grade squamous intraepithelial lesions |
| N_HPV: HPV-infected normal cervix |
| Colorectum (GSE201348) |  | FAP: Familial adenomatous polyposis |
| CRC: Colorectal cancer |
| Colorectum (HTA11) |  | AD: Adenomas |
| SER: Sessile serrated lesions |
| MSI-H: Microsatellite-high colorectal cancer |
| MSS: Microsatellite stable colorectal cancer |
| Endometrium | 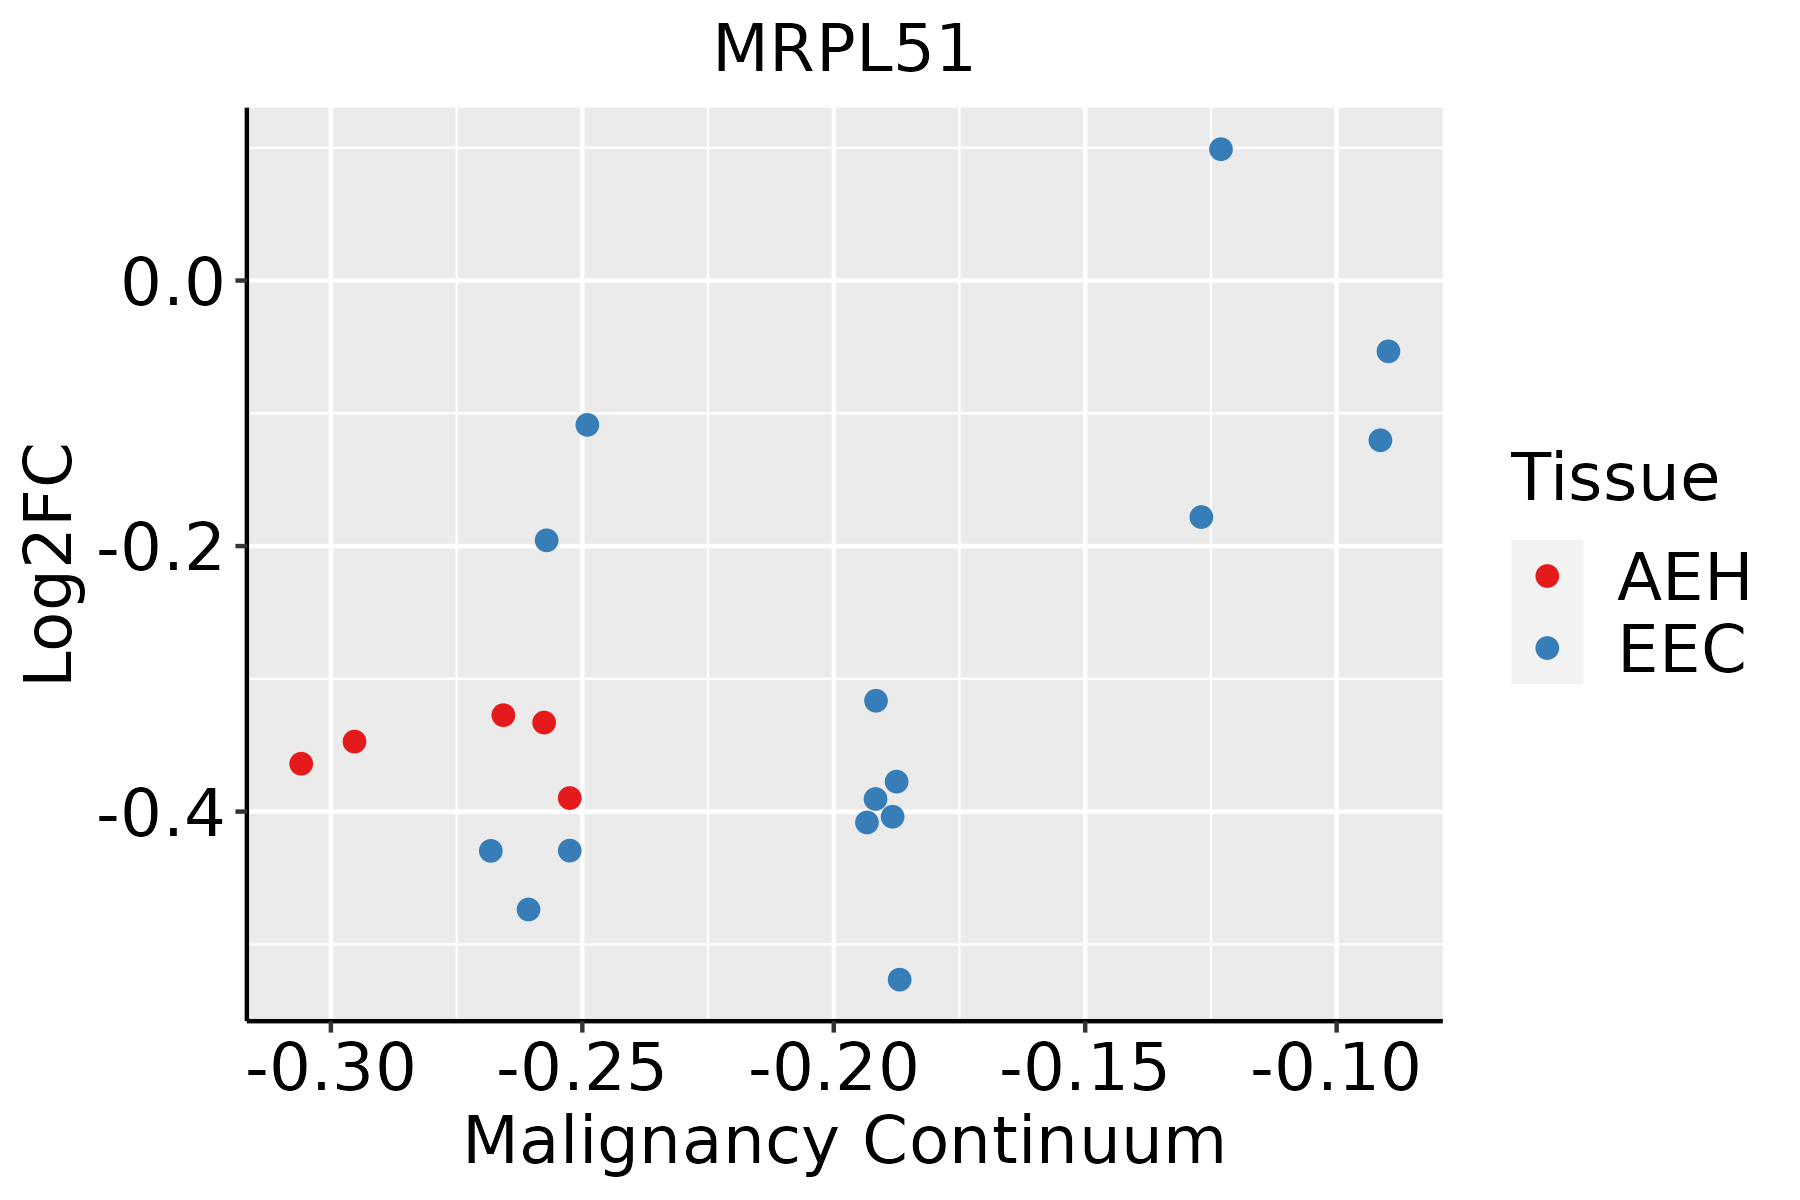 | AEH: Atypical endometrial hyperplasia |
| EEC: Endometrioid Cancer |
| Esophagus | 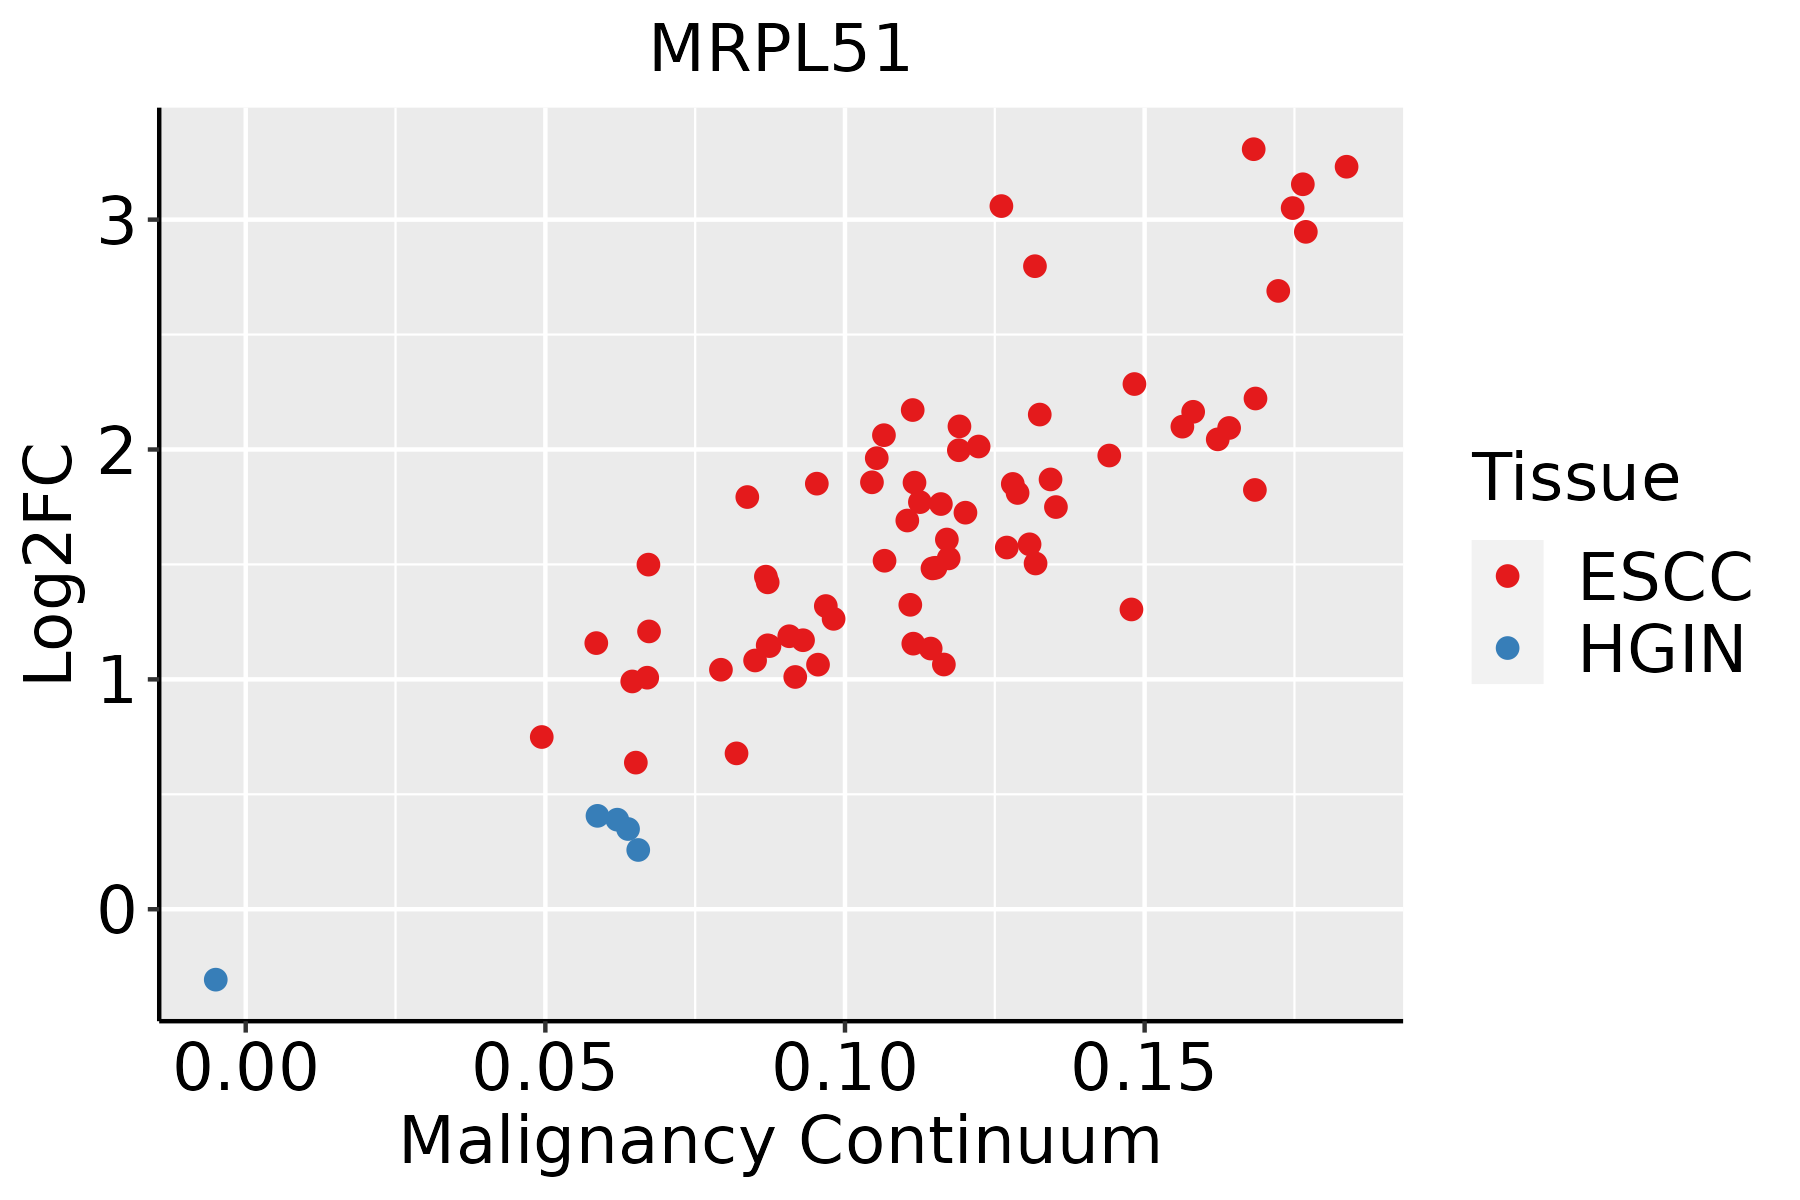 | ESCC: Esophageal squamous cell carcinoma |
| HGIN: High-grade intraepithelial neoplasias |
| LGIN: Low-grade intraepithelial neoplasias |
| Liver | 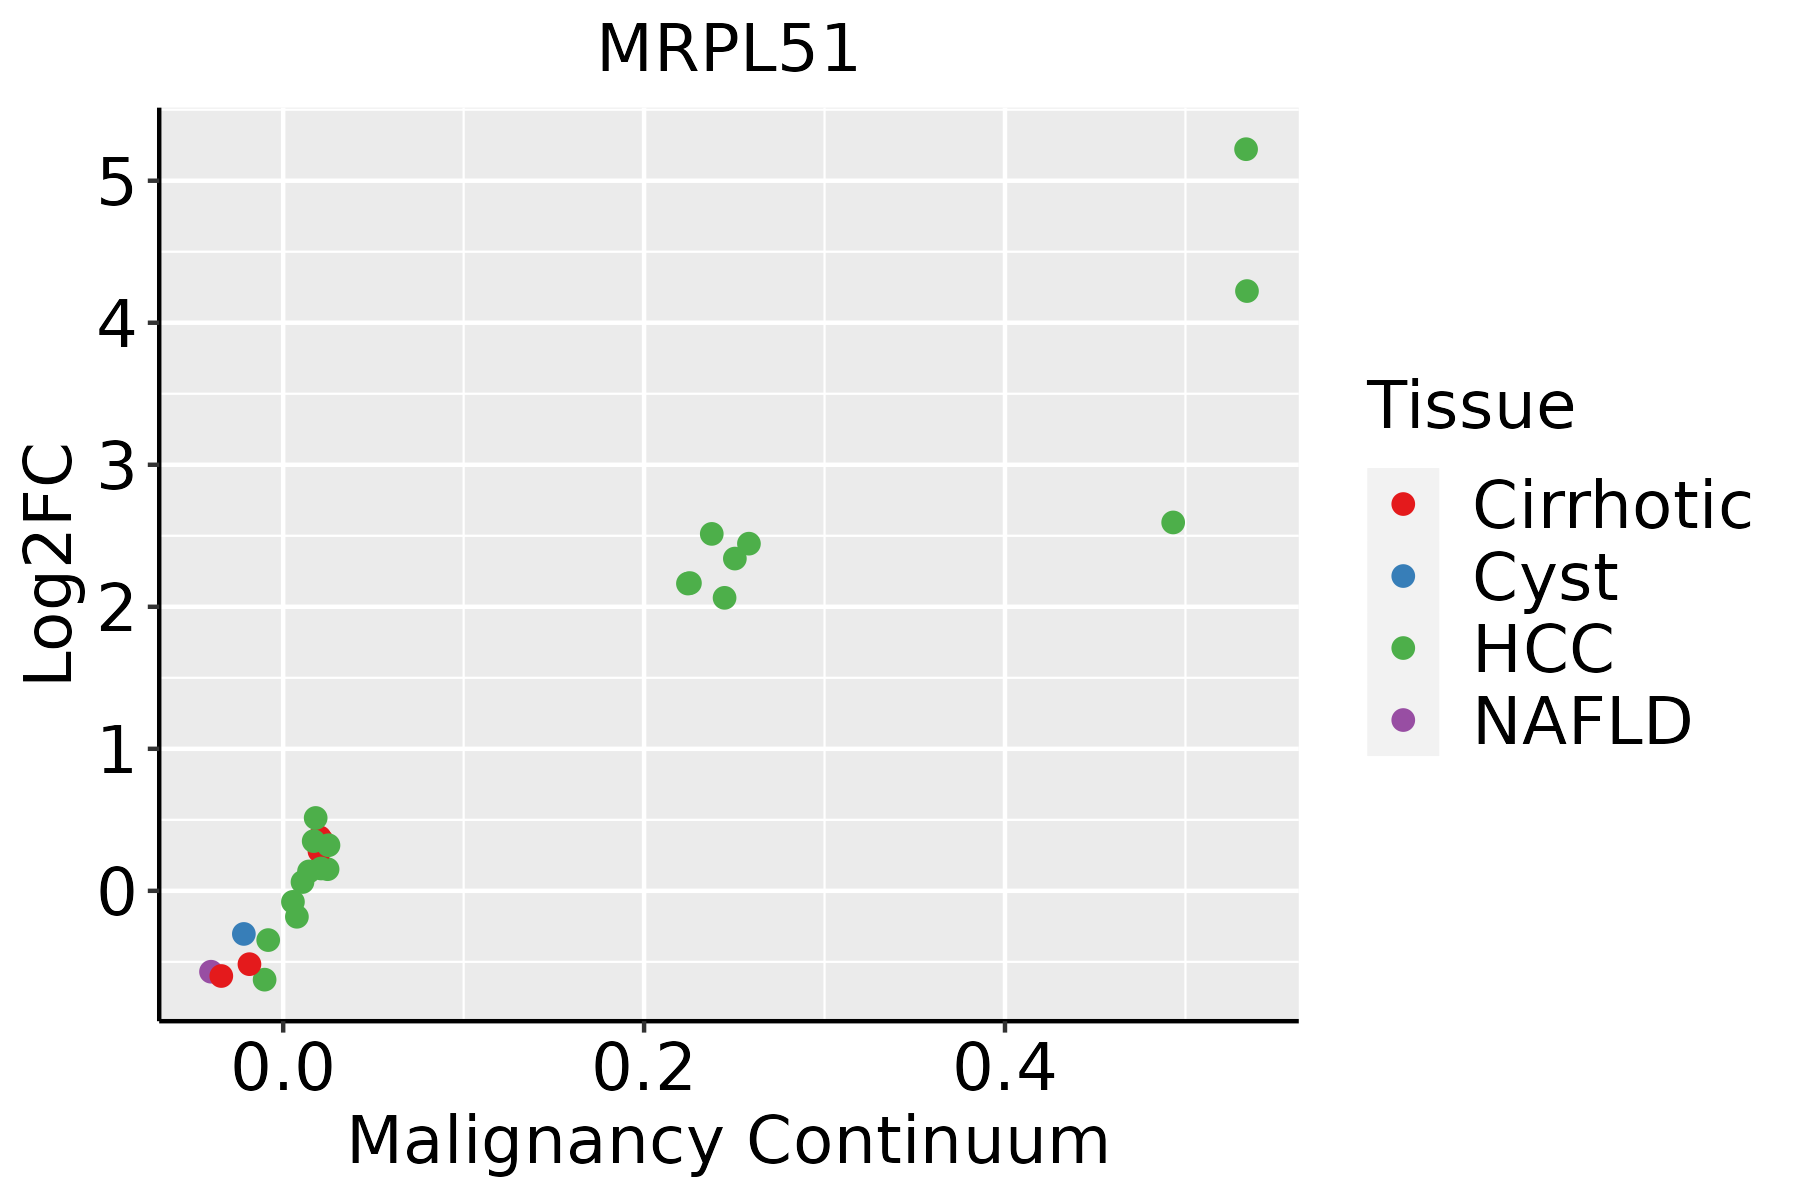 | HCC: Hepatocellular carcinoma |
| NAFLD: Non-alcoholic fatty liver disease |
| Oral Cavity |  | EOLP: Erosive Oral lichen planus |
| LP: leukoplakia |
| NEOLP: Non-erosive oral lichen planus |
| OSCC: Oral squamous cell carcinoma |
| Prostate | 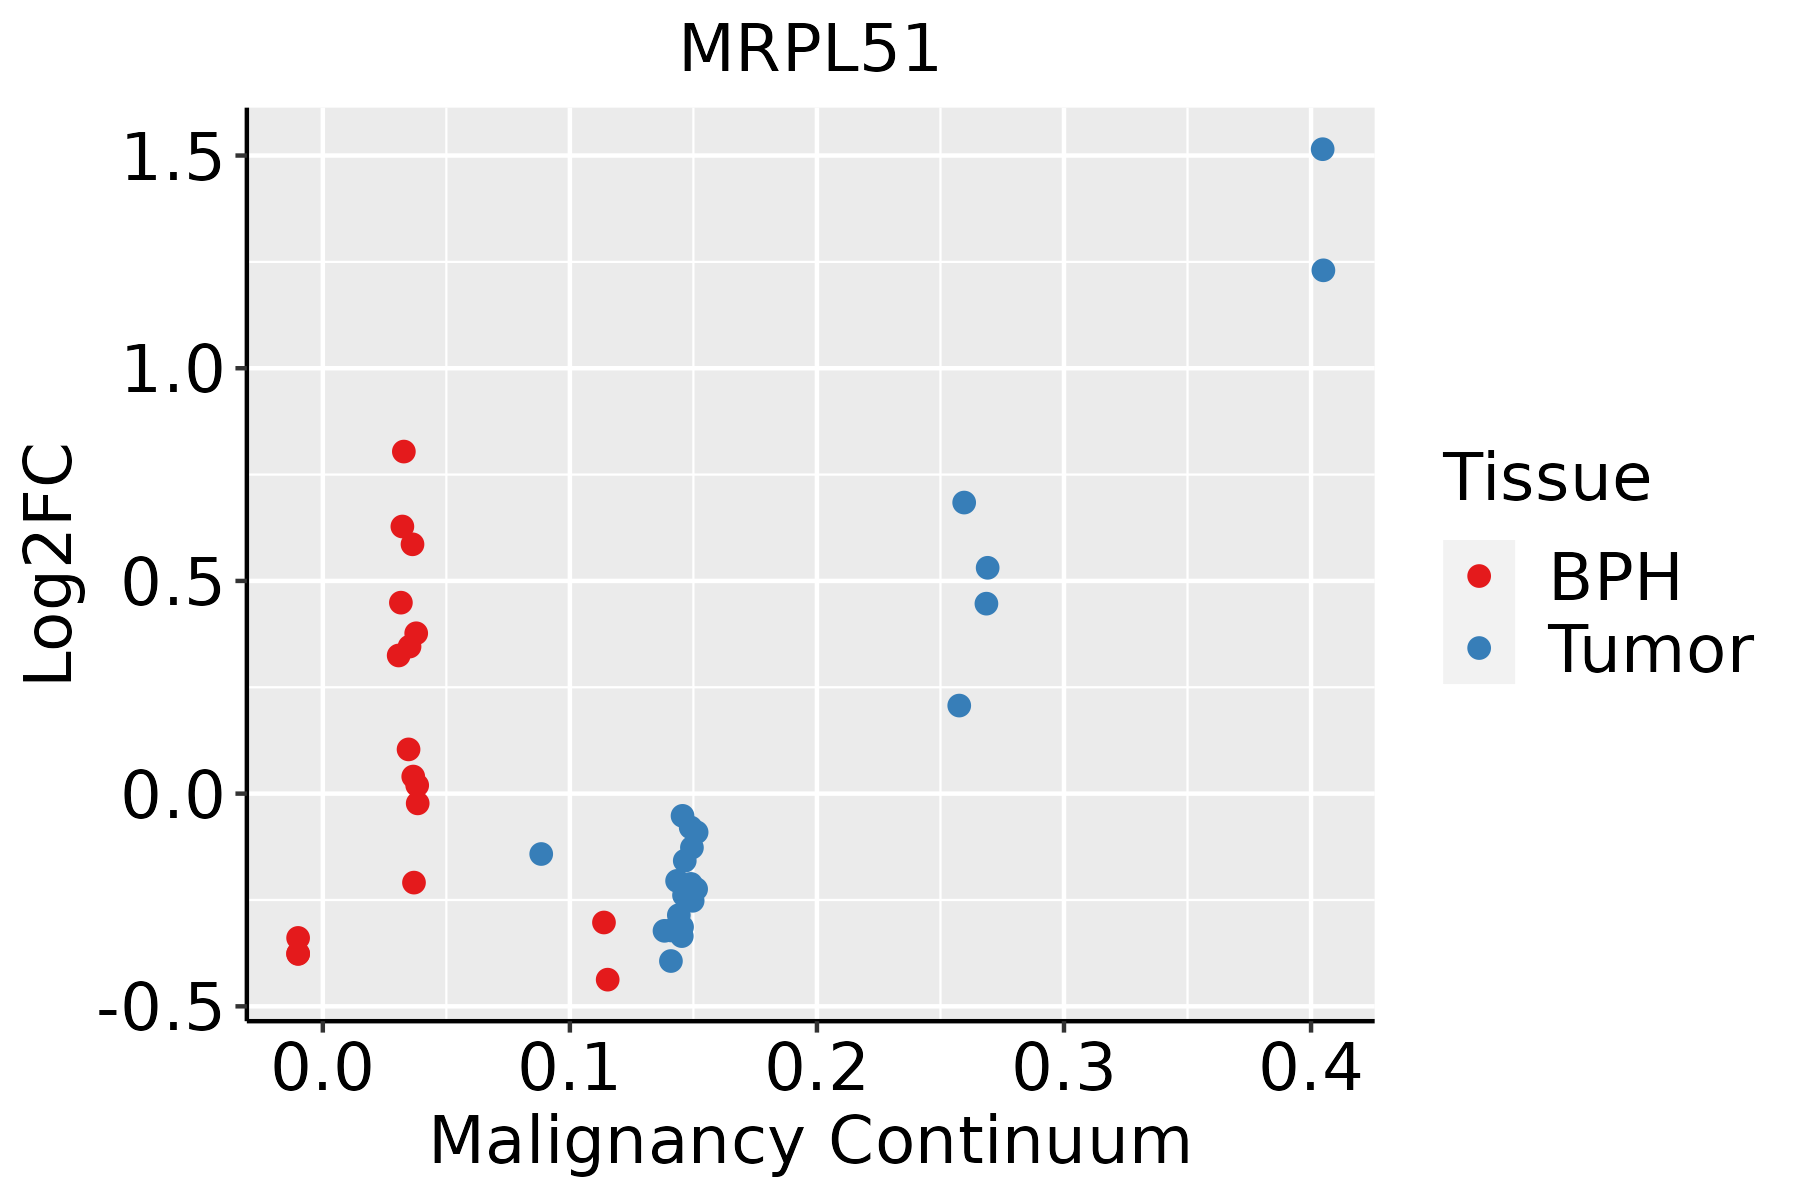 | BPH: Benign Prostatic Hyperplasia |
| Skin | 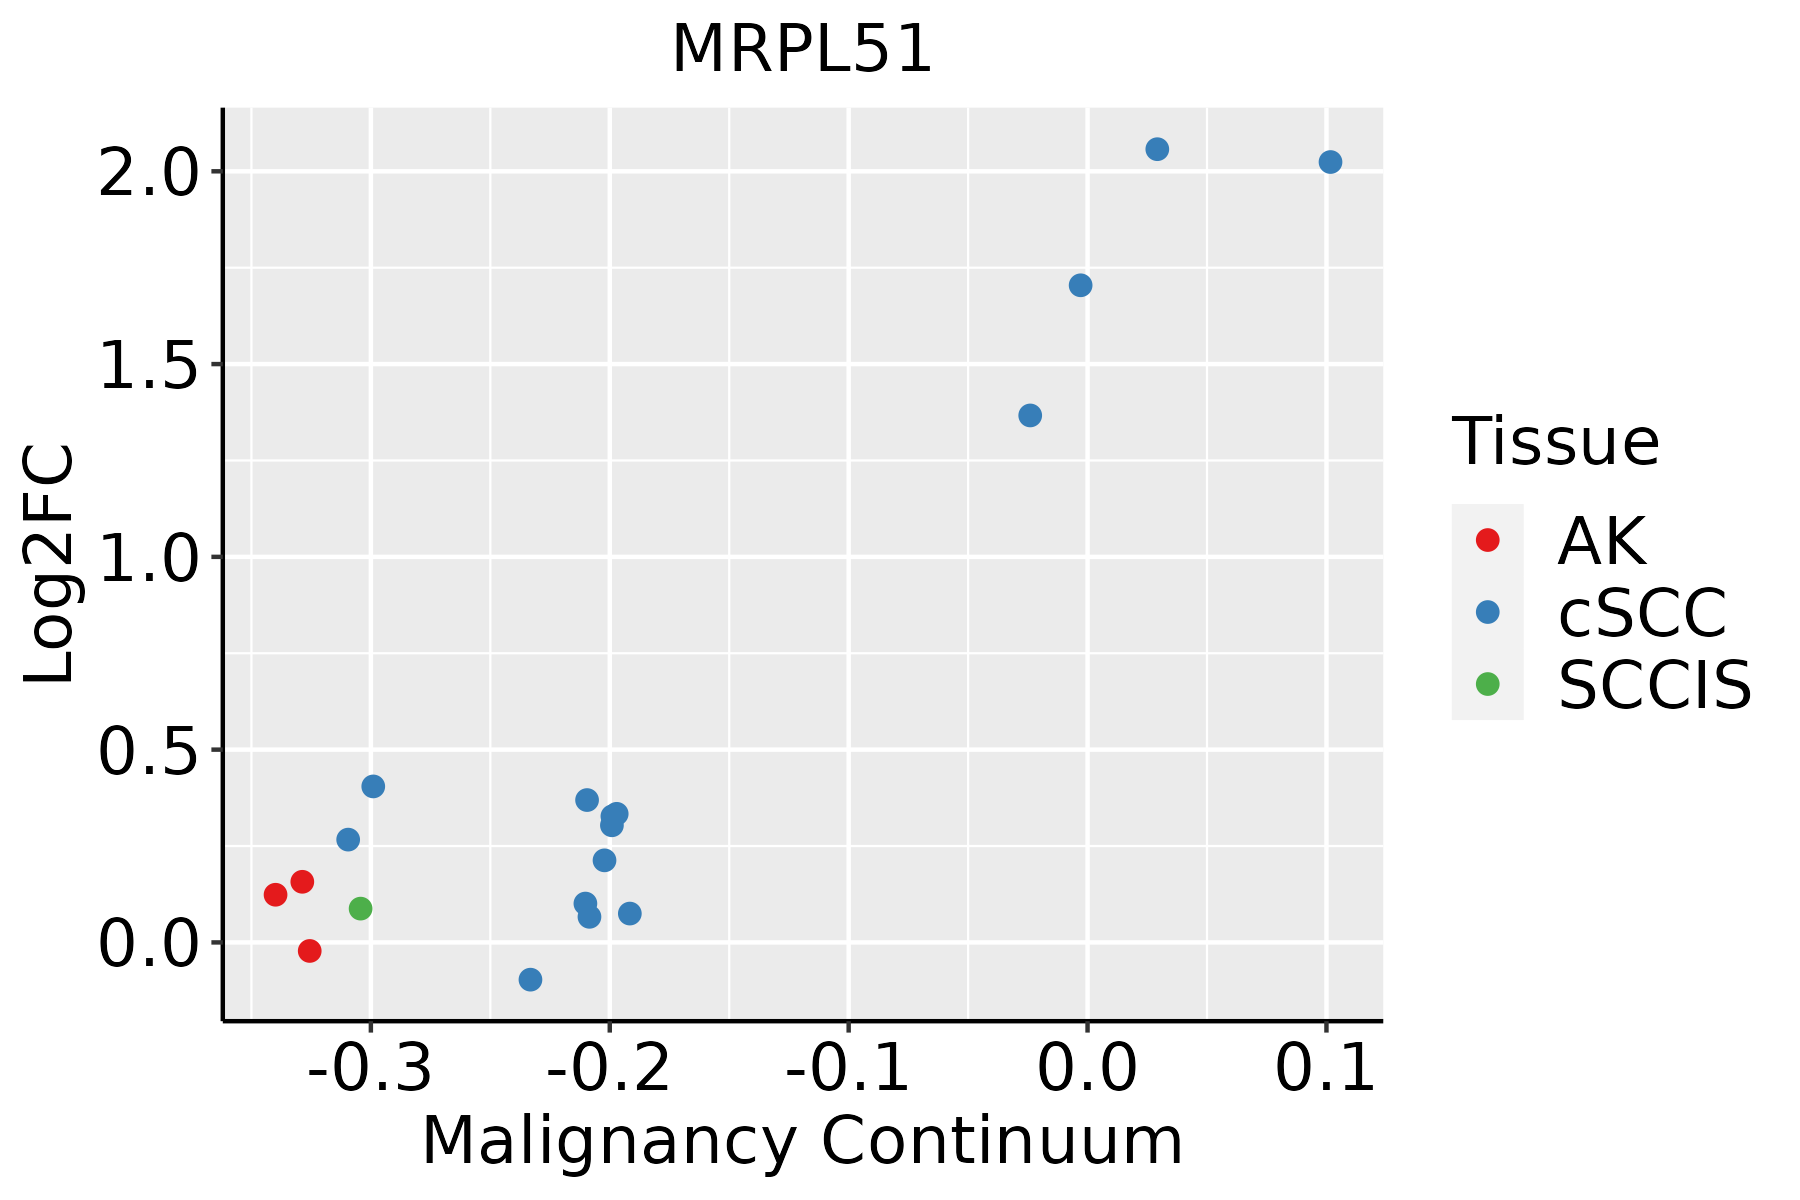 | AK: Actinic keratosis |
| cSCC: Cutaneous squamous cell carcinoma |
| SCCIS:squamous cell carcinoma in situ |
| Thyroid |  | ATC: Anaplastic thyroid cancer |
| HT: Hashimoto's thyroiditis |
| PTC: Papillary thyroid cancer |
| GO ID | Tissue | Disease Stage | Description | Gene Ratio | Bg Ratio | pvalue | p.adjust | Count |
| GO:00325432 | Breast | IDC | mitochondrial translation | 13/1434 | 76/18723 | 4.81e-03 | 3.67e-02 | 13 |
| GO:003254311 | Breast | DCIS | mitochondrial translation | 13/1390 | 76/18723 | 3.70e-03 | 2.99e-02 | 13 |
| GO:00325435 | Esophagus | HGIN | mitochondrial translation | 23/2587 | 76/18723 | 1.61e-04 | 3.16e-03 | 23 |
| GO:01400534 | Esophagus | HGIN | mitochondrial gene expression | 27/2587 | 108/18723 | 1.34e-03 | 1.57e-02 | 27 |
| GO:014005313 | Esophagus | ESCC | mitochondrial gene expression | 93/8552 | 108/18723 | 1.96e-18 | 2.03e-16 | 93 |
| GO:003254314 | Esophagus | ESCC | mitochondrial translation | 68/8552 | 76/18723 | 1.02e-15 | 6.86e-14 | 68 |
| GO:0032543 | Liver | Cirrhotic | mitochondrial translation | 40/4634 | 76/18723 | 1.61e-07 | 4.29e-06 | 40 |
| GO:0140053 | Liver | Cirrhotic | mitochondrial gene expression | 49/4634 | 108/18723 | 2.35e-06 | 4.31e-05 | 49 |
| GO:01400531 | Liver | HCC | mitochondrial gene expression | 82/7958 | 108/18723 | 1.49e-12 | 7.20e-11 | 82 |
| GO:00325431 | Liver | HCC | mitochondrial translation | 62/7958 | 76/18723 | 2.95e-12 | 1.34e-10 | 62 |
| GO:01400533 | Oral cavity | OSCC | mitochondrial gene expression | 78/7305 | 108/18723 | 2.37e-12 | 9.86e-11 | 78 |
| GO:00325434 | Oral cavity | OSCC | mitochondrial translation | 59/7305 | 76/18723 | 7.21e-12 | 2.70e-10 | 59 |
| GO:003254313 | Oral cavity | LP | mitochondrial translation | 43/4623 | 76/18723 | 2.85e-09 | 1.26e-07 | 43 |
| GO:014005312 | Oral cavity | LP | mitochondrial gene expression | 53/4623 | 108/18723 | 3.54e-08 | 1.27e-06 | 53 |
| GO:00325433 | Prostate | BPH | mitochondrial translation | 23/3107 | 76/18723 | 2.21e-03 | 1.22e-02 | 23 |
| GO:01400532 | Prostate | BPH | mitochondrial gene expression | 29/3107 | 108/18723 | 4.68e-03 | 2.25e-02 | 29 |
| GO:003254312 | Prostate | Tumor | mitochondrial translation | 24/3246 | 76/18723 | 1.73e-03 | 1.03e-02 | 24 |
| GO:014005311 | Prostate | Tumor | mitochondrial gene expression | 31/3246 | 108/18723 | 2.31e-03 | 1.30e-02 | 31 |
| GO:00325436 | Skin | cSCC | mitochondrial translation | 47/4864 | 76/18723 | 4.70e-11 | 2.22e-09 | 47 |
| GO:01400535 | Skin | cSCC | mitochondrial gene expression | 56/4864 | 108/18723 | 8.06e-09 | 2.56e-07 | 56 |
| Hugo Symbol | Variant Class | Variant Classification | dbSNP RS | HGVSc | HGVSp | HGVSp Short | SWISSPROT | BIOTYPE | SIFT | PolyPhen | Tumor Sample Barcode | Tissue | Histology | Sex | Age | Stage | Therapy Types | Drugs | Outcome |
| MRPL51 | SNV | Missense_Mutation | | c.209N>T | p.Pro70Leu | p.P70L | Q4U2R6 | protein_coding | deleterious(0.02) | probably_damaging(0.999) | TCGA-A8-A097-01 | Breast | breast invasive carcinoma | Female | >=65 | I/II | Hormone Therapy | tamoxiphen | SD |
| MRPL51 | SNV | Missense_Mutation | rs776718738 | c.383G>A | p.Arg128Gln | p.R128Q | Q4U2R6 | protein_coding | deleterious(0) | probably_damaging(0.998) | TCGA-A5-A0G2-01 | Endometrium | uterine corpus endometrioid carcinoma | Female | <65 | III/IV | Unknown | Unknown | SD |
| MRPL51 | SNV | Missense_Mutation | rs191438555 | c.338G>A | p.Arg113His | p.R113H | Q4U2R6 | protein_coding | deleterious(0) | probably_damaging(0.999) | TCGA-A5-A1OF-01 | Endometrium | uterine corpus endometrioid carcinoma | Female | <65 | I/II | Unknown | Unknown | SD |
| MRPL51 | SNV | Missense_Mutation | | c.238N>A | p.Leu80Ile | p.L80I | Q4U2R6 | protein_coding | deleterious(0.01) | probably_damaging(0.912) | TCGA-AP-A059-01 | Endometrium | uterine corpus endometrioid carcinoma | Female | >=65 | I/II | Unknown | Unknown | SD |
| MRPL51 | SNV | Missense_Mutation | rs191438555 | c.338N>A | p.Arg113His | p.R113H | Q4U2R6 | protein_coding | deleterious(0) | probably_damaging(0.999) | TCGA-AX-A0J1-01 | Endometrium | uterine corpus endometrioid carcinoma | Female | >=65 | I/II | Unknown | Unknown | SD |
| MRPL51 | SNV | Missense_Mutation | rs377340253 | c.269N>A | p.Arg90His | p.R90H | Q4U2R6 | protein_coding | deleterious(0.03) | probably_damaging(0.999) | TCGA-AX-A0J1-01 | Endometrium | uterine corpus endometrioid carcinoma | Female | >=65 | I/II | Unknown | Unknown | SD |
| MRPL51 | SNV | Missense_Mutation | novel | c.193N>C | p.Asn65His | p.N65H | Q4U2R6 | protein_coding | deleterious(0.03) | possibly_damaging(0.771) | TCGA-D1-A16X-01 | Endometrium | uterine corpus endometrioid carcinoma | Female | <65 | I/II | Unknown | Unknown | SD |
| MRPL51 | SNV | Missense_Mutation | | c.100A>G | p.Ile34Val | p.I34V | Q4U2R6 | protein_coding | tolerated(1) | benign(0) | TCGA-MI-A75G-01 | Liver | liver hepatocellular carcinoma | Male | <65 | I/II | Unknown | Unknown | SD |
| MRPL51 | SNV | Missense_Mutation | | c.147N>C | p.Glu49Asp | p.E49D | Q4U2R6 | protein_coding | deleterious(0.01) | possibly_damaging(0.492) | TCGA-75-5126-01 | Lung | lung adenocarcinoma | Female | Unknown | III/IV | Unknown | Unknown | SD |
| MRPL51 | SNV | Missense_Mutation | novel | c.188N>A | p.Leu63Gln | p.L63Q | Q4U2R6 | protein_coding | deleterious(0) | probably_damaging(1) | TCGA-21-1083-01 | Lung | lung squamous cell carcinoma | Male | >=65 | I/II | Unknown | Unknown | SD |


