
|
|||||
|
 | |
| |
| |
| |
| |
| |
|
Gene: LRRFIP1 |
Gene summary for LRRFIP1 |
| Gene information | Species | Human | Gene symbol | LRRFIP1 | Gene ID | 9208 |
| Gene name | LRR binding FLII interacting protein 1 | |
| Gene Alias | FLAP-1 | |
| Cytomap | 2q37.3 | |
| Gene Type | protein-coding | GO ID | GO:0000122 | UniProtAcc | Q32MZ4 |
Top |
Malignant transformation analysis |
| Identification of the aberrant gene expression in precancerous and cancerous lesions by comparing the gene expression of stem-like cells in diseased tissues with normal stem cells |
| Entrez ID | Symbol | Replicates | Species | Organ | Tissue | Adj P-value | Log2FC | Malignancy |
| 9208 | LRRFIP1 | C04 | Human | Oral cavity | OSCC | 3.73e-20 | 1.34e+00 | 0.2633 |
| 9208 | LRRFIP1 | C21 | Human | Oral cavity | OSCC | 7.21e-54 | 2.05e+00 | 0.2678 |
| 9208 | LRRFIP1 | C30 | Human | Oral cavity | OSCC | 1.27e-46 | 2.00e+00 | 0.3055 |
| 9208 | LRRFIP1 | C38 | Human | Oral cavity | OSCC | 1.73e-08 | 1.30e+00 | 0.172 |
| 9208 | LRRFIP1 | C43 | Human | Oral cavity | OSCC | 2.96e-16 | 6.44e-01 | 0.1704 |
| 9208 | LRRFIP1 | C46 | Human | Oral cavity | OSCC | 4.86e-02 | 3.63e-01 | 0.1673 |
| 9208 | LRRFIP1 | C51 | Human | Oral cavity | OSCC | 2.87e-20 | 1.37e+00 | 0.2674 |
| 9208 | LRRFIP1 | C57 | Human | Oral cavity | OSCC | 8.53e-40 | 1.66e+00 | 0.1679 |
| 9208 | LRRFIP1 | C06 | Human | Oral cavity | OSCC | 2.81e-14 | 1.60e+00 | 0.2699 |
| 9208 | LRRFIP1 | C07 | Human | Oral cavity | OSCC | 1.53e-03 | 1.03e+00 | 0.2491 |
| 9208 | LRRFIP1 | C08 | Human | Oral cavity | OSCC | 7.71e-20 | 8.36e-01 | 0.1919 |
| 9208 | LRRFIP1 | C09 | Human | Oral cavity | OSCC | 2.29e-45 | 1.71e+00 | 0.1431 |
| 9208 | LRRFIP1 | LN22 | Human | Oral cavity | OSCC | 1.21e-03 | 1.00e+00 | 0.1733 |
| 9208 | LRRFIP1 | LN46 | Human | Oral cavity | OSCC | 7.33e-03 | 6.20e-01 | 0.1666 |
| 9208 | LRRFIP1 | LP15 | Human | Oral cavity | LP | 1.12e-05 | 1.25e+00 | 0.2174 |
| 9208 | LRRFIP1 | LP17 | Human | Oral cavity | LP | 3.89e-06 | 1.18e+00 | 0.2349 |
| 9208 | LRRFIP1 | EOLP-1 | Human | Oral cavity | EOLP | 1.23e-09 | 5.02e-01 | -0.0202 |
| 9208 | LRRFIP1 | NEOLP-1 | Human | Oral cavity | NEOLP | 6.38e-06 | 4.51e-01 | -0.0194 |
| 9208 | LRRFIP1 | NEOLP-3 | Human | Oral cavity | NEOLP | 1.16e-06 | 4.65e-01 | -0.0191 |
| 9208 | LRRFIP1 | SYSMH1 | Human | Oral cavity | OSCC | 6.40e-16 | 7.26e-01 | 0.1127 |
| Page: 1 2 3 4 5 6 7 8 9 10 11 12 13 |
| Tissue | Expression Dynamics | Abbreviation |
| Colorectum (GSE201348) |  | FAP: Familial adenomatous polyposis |
| CRC: Colorectal cancer | ||
| Colorectum (HTA11) |  | AD: Adenomas |
| SER: Sessile serrated lesions | ||
| MSI-H: Microsatellite-high colorectal cancer | ||
| MSS: Microsatellite stable colorectal cancer | ||
| Endometrium | 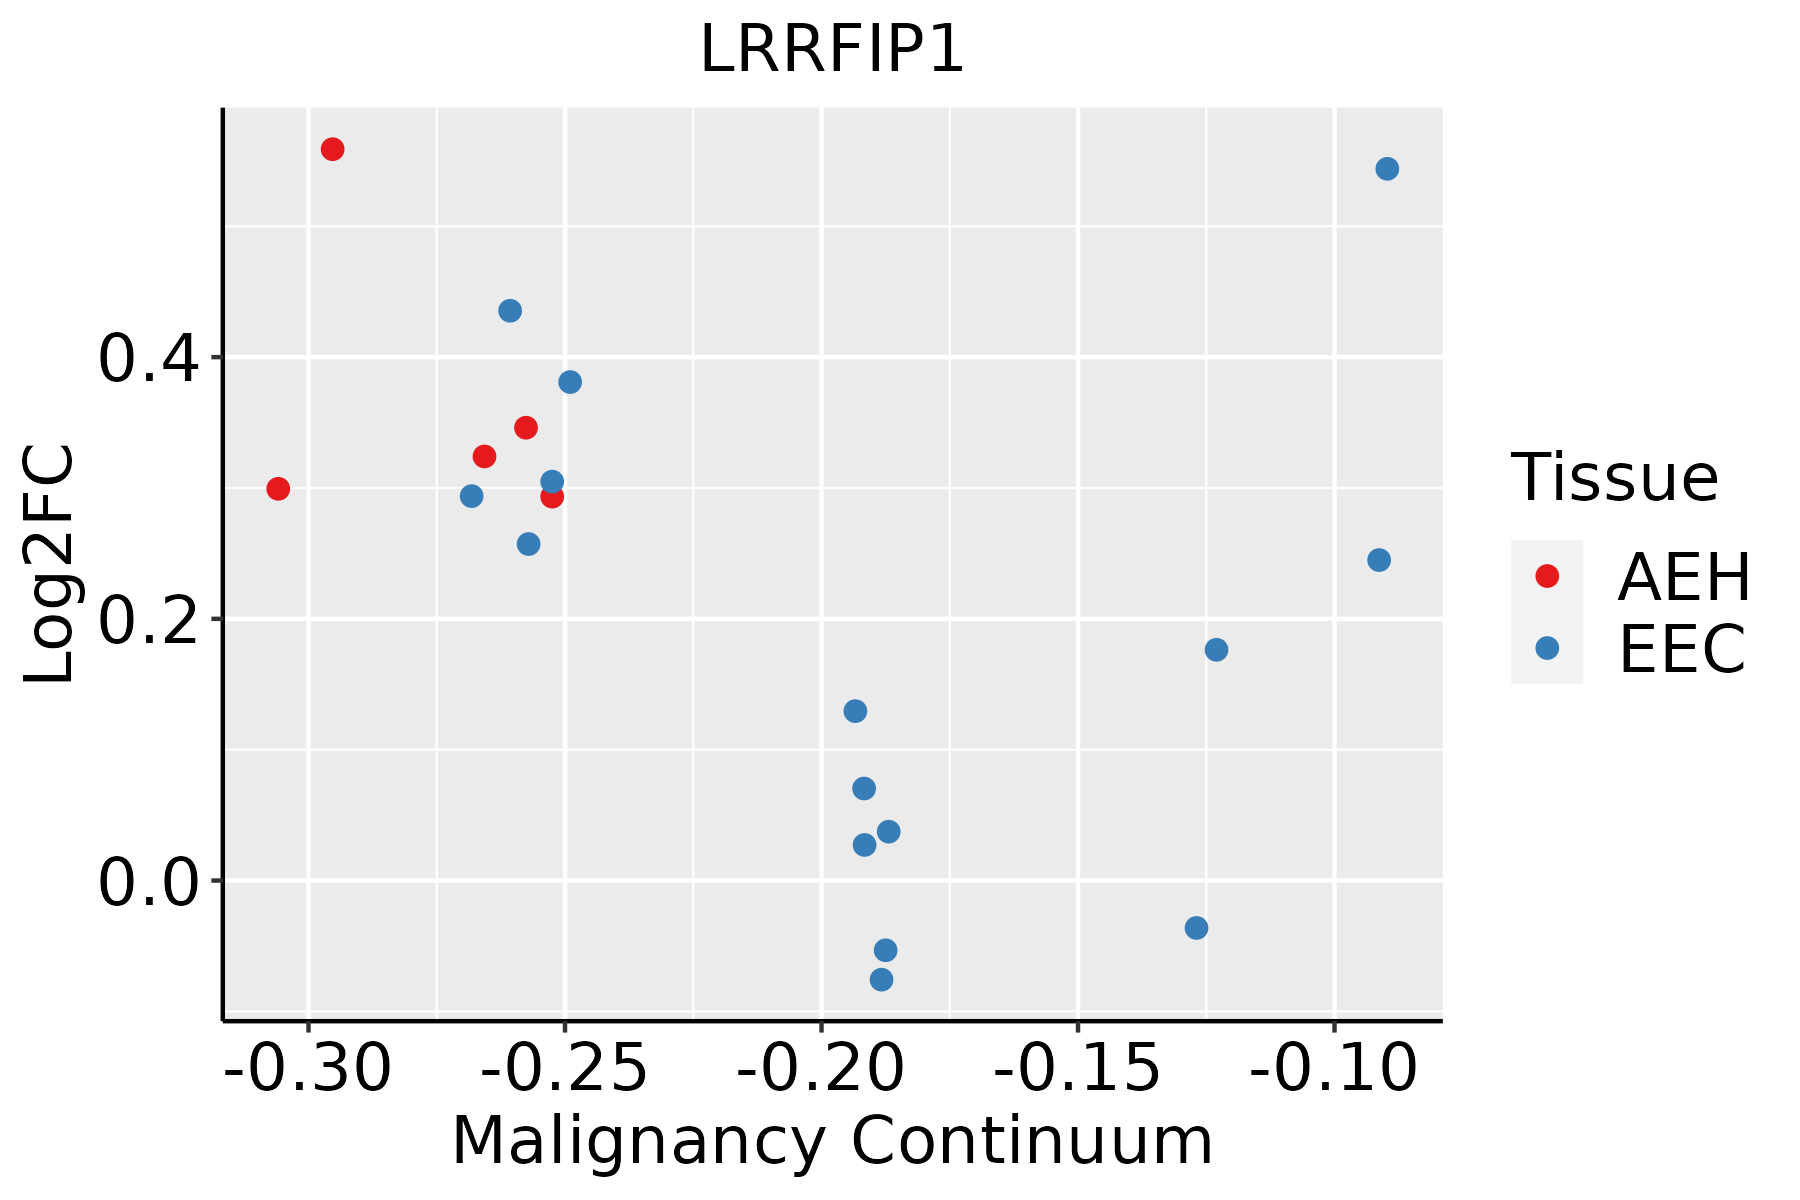 | AEH: Atypical endometrial hyperplasia |
| EEC: Endometrioid Cancer | ||
| Esophagus | 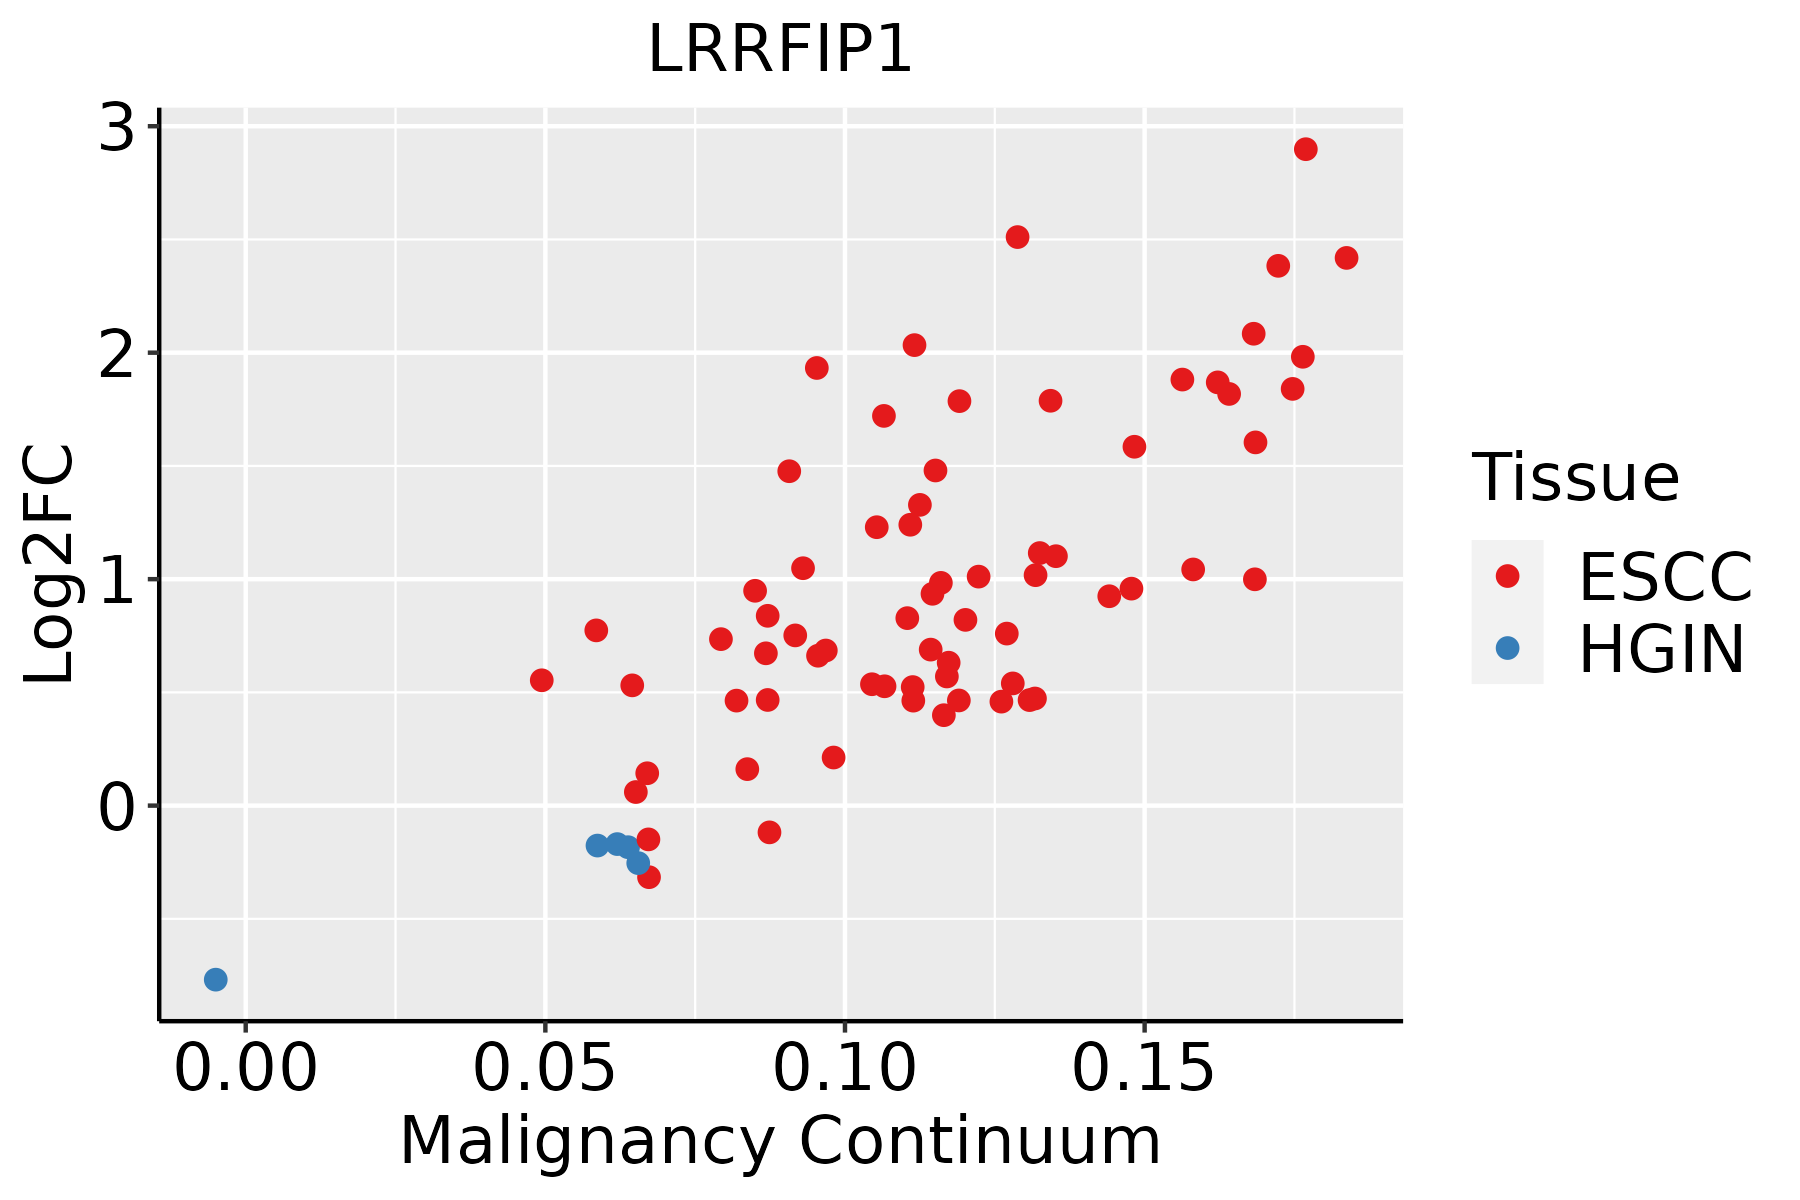 | ESCC: Esophageal squamous cell carcinoma |
| HGIN: High-grade intraepithelial neoplasias | ||
| LGIN: Low-grade intraepithelial neoplasias | ||
| Liver |  | HCC: Hepatocellular carcinoma |
| NAFLD: Non-alcoholic fatty liver disease | ||
| Lung | 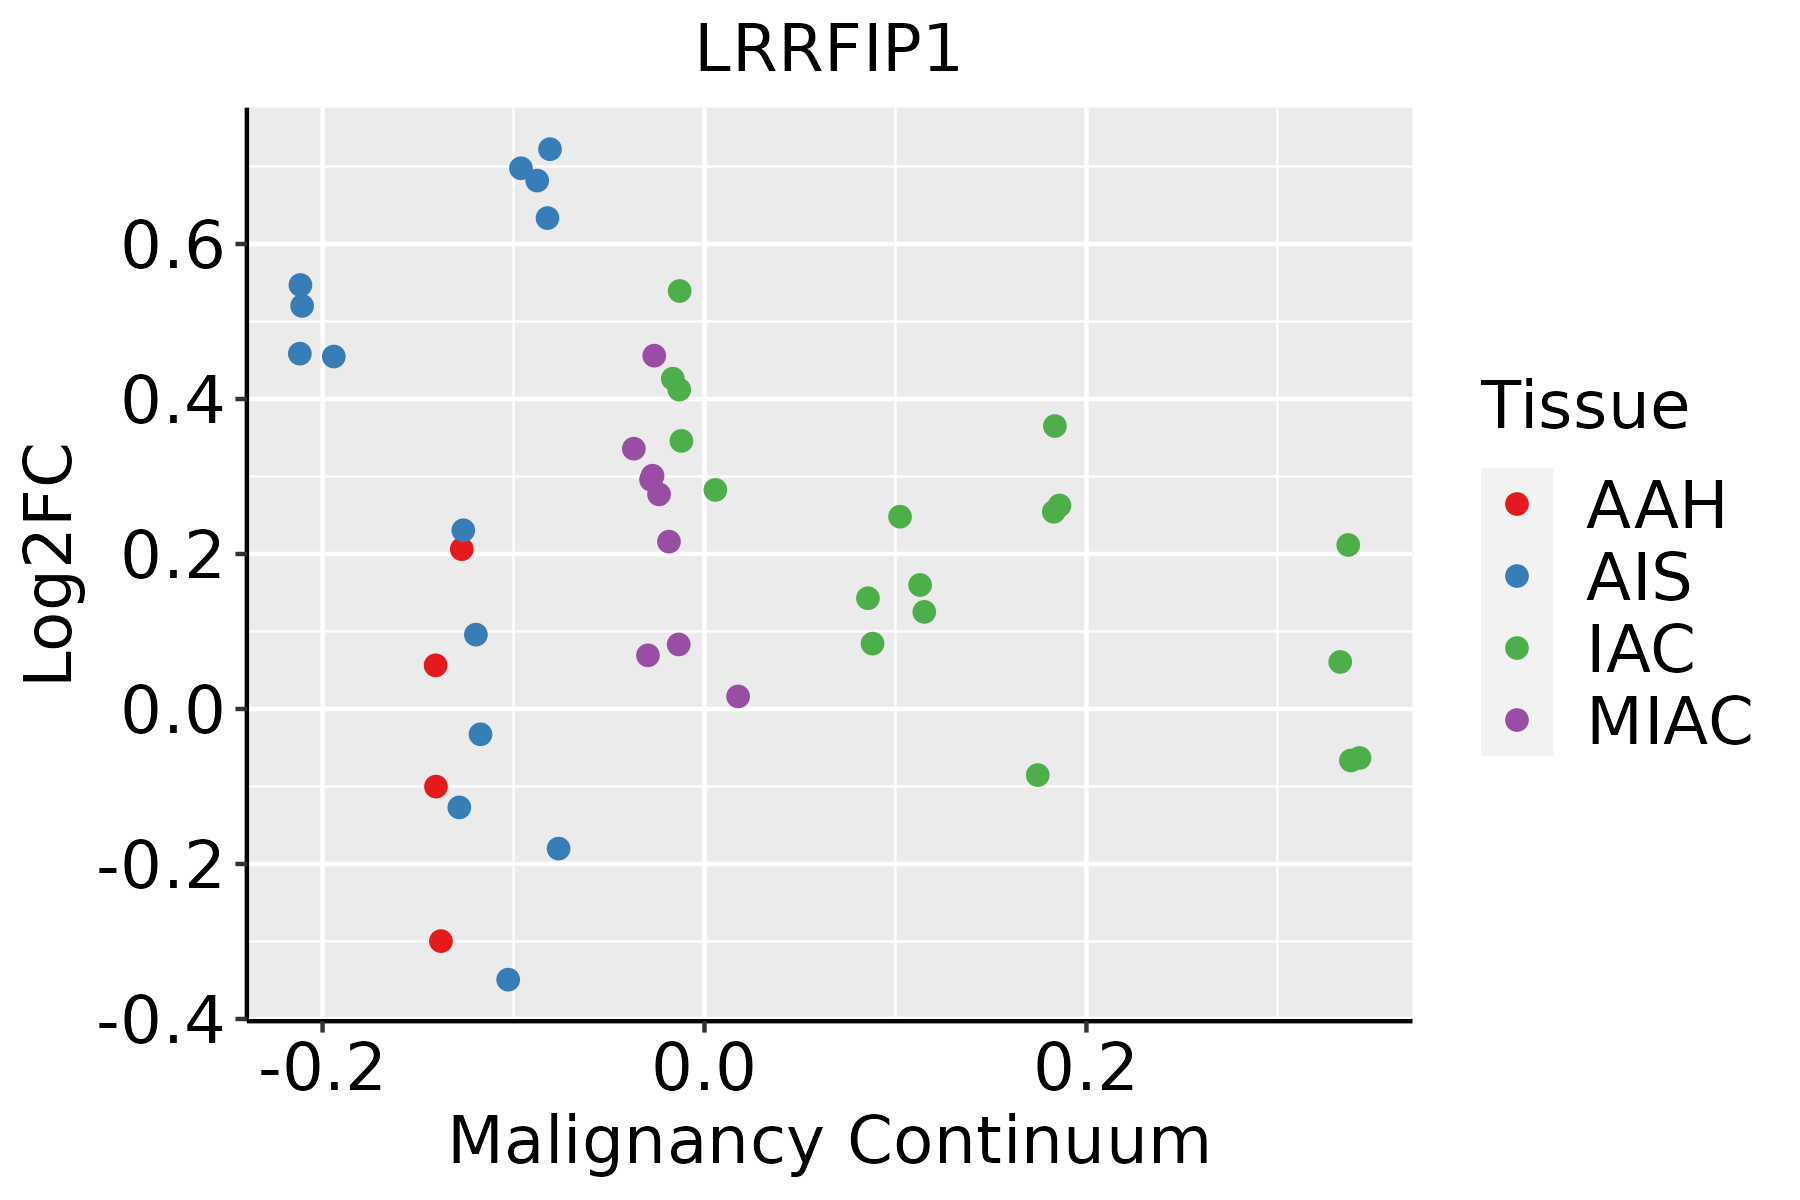 | AAH: Atypical adenomatous hyperplasia |
| AIS: Adenocarcinoma in situ | ||
| IAC: Invasive lung adenocarcinoma | ||
| MIA: Minimally invasive adenocarcinoma | ||
| Oral Cavity | 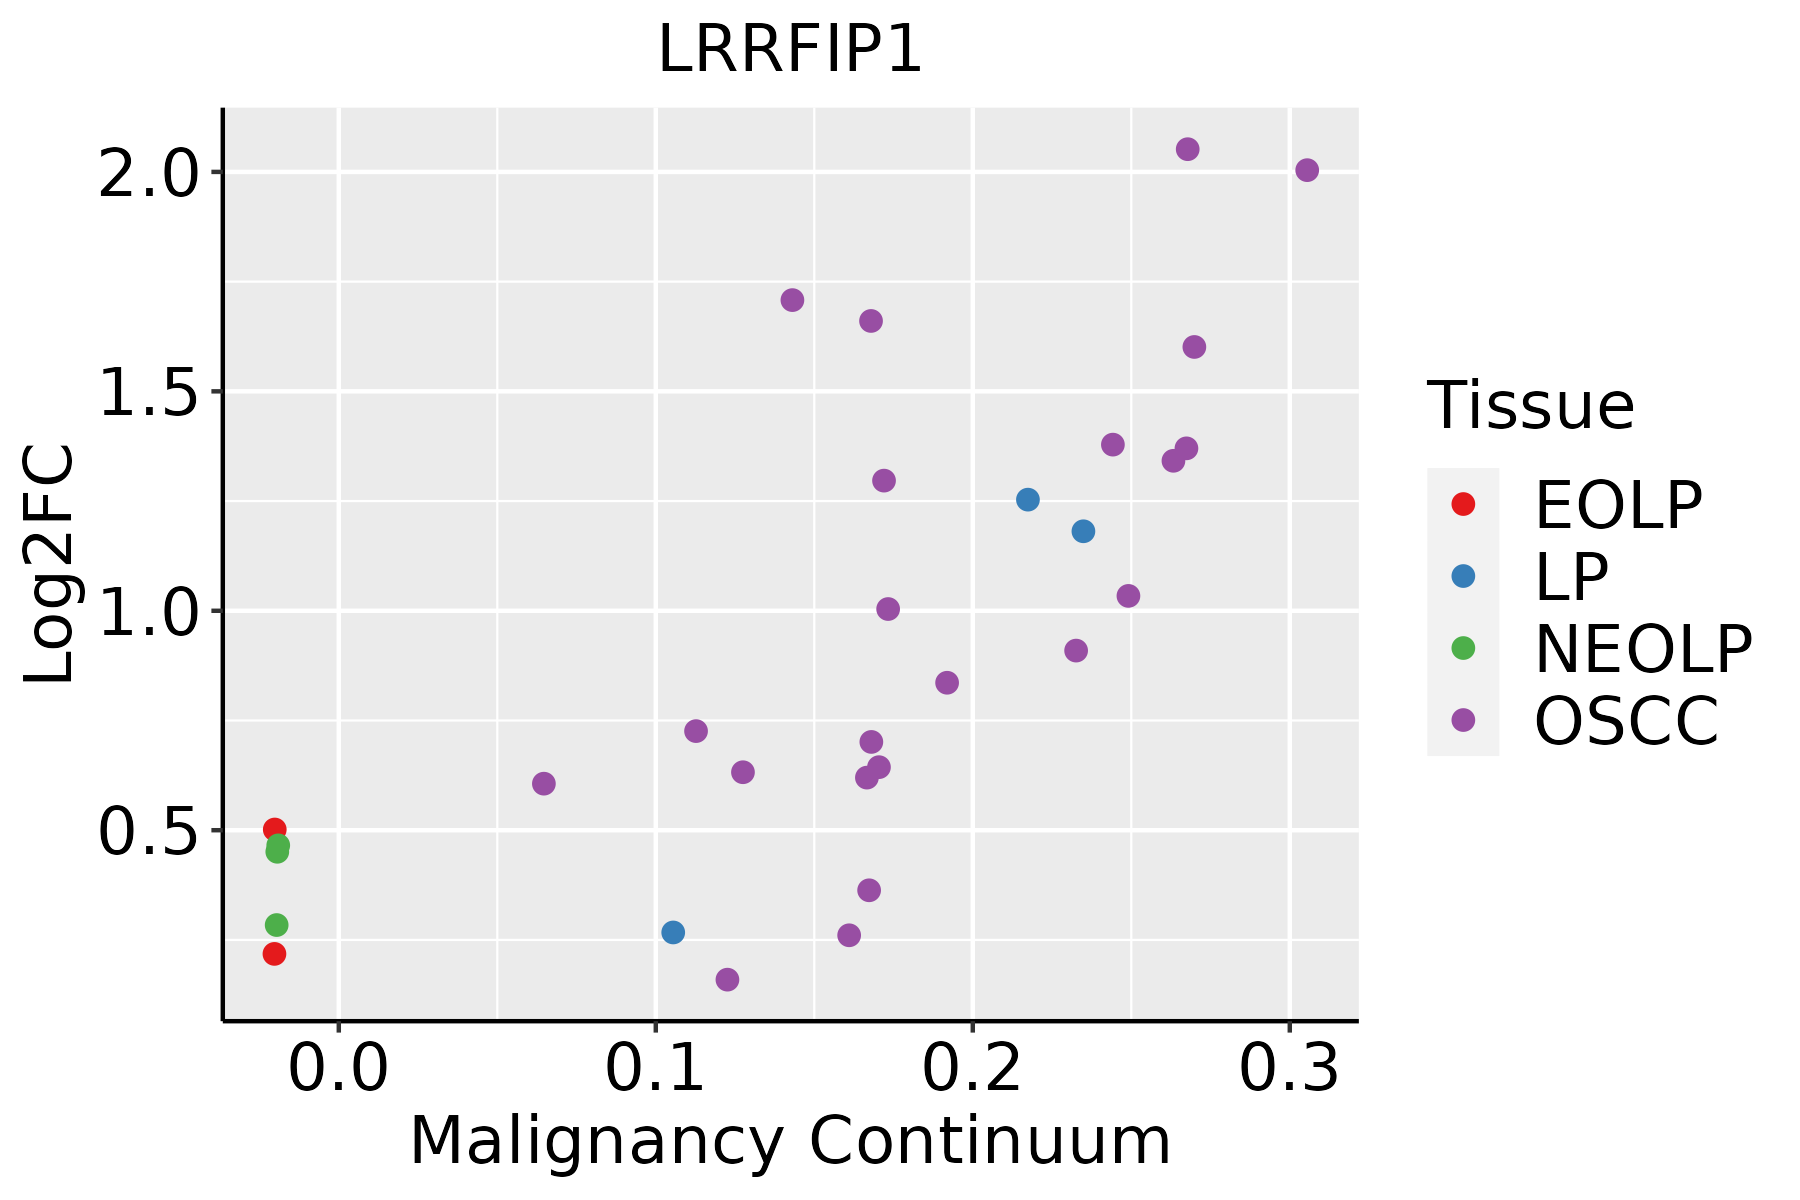 | EOLP: Erosive Oral lichen planus |
| LP: leukoplakia | ||
| NEOLP: Non-erosive oral lichen planus | ||
| OSCC: Oral squamous cell carcinoma | ||
| Prostate |  | BPH: Benign Prostatic Hyperplasia |
| Skin | 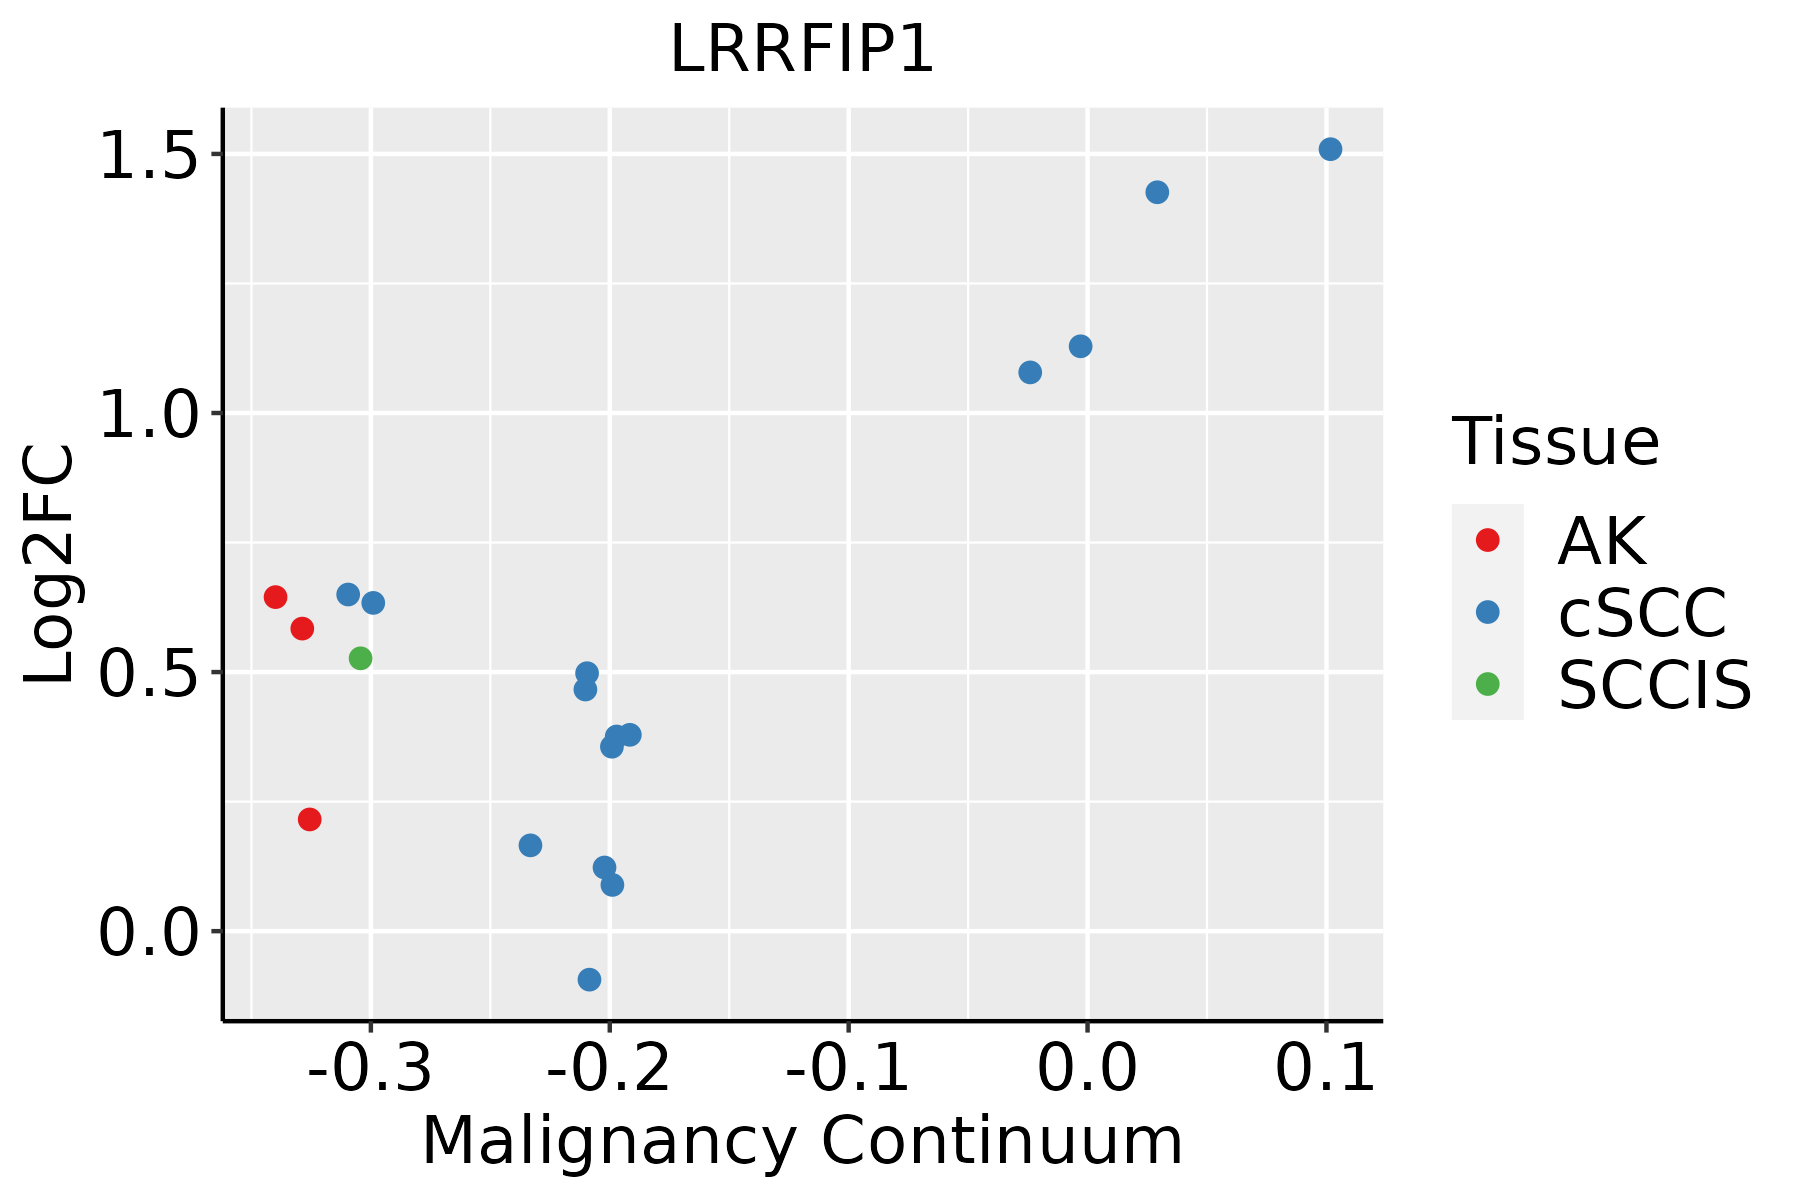 | AK: Actinic keratosis |
| cSCC: Cutaneous squamous cell carcinoma | ||
| SCCIS:squamous cell carcinoma in situ | ||
| Thyroid |  | ATC: Anaplastic thyroid cancer |
| HT: Hashimoto's thyroiditis | ||
| PTC: Papillary thyroid cancer |
| ∗log2FC in expression of this searched gene in stem-like cells from each diseased tissue sample relative to stem-like cells in normal samples in each tissue plotted against the malignancy continuum. Samples are colored based on if they are from different disease stage. |
Top |
Malignant transformation related pathway analysis |
| Find out the enriched GO biological processes and KEGG pathways involved in transition from healthy to precancer to cancer |
| Tissue | Disease Stage | Enriched GO biological Processes |
| Colorectum | AD |  |
| Colorectum | SER |  |
| Colorectum | MSS |  |
| Colorectum | MSI-H |  |
| Colorectum | FAP |  |
| ∗Top 15 enriched GO BP terms are showed in the bar plot of each disease state in each tissue. Each row represents a significant GO biological process which is colored according to the -log10(p.adjust). |
| Page: 1 2 3 4 5 6 7 8 9 |
| GO ID | Tissue | Disease Stage | Description | Gene Ratio | Bg Ratio | pvalue | p.adjust | Count |
| Page: 1 |
| Pathway ID | Tissue | Disease Stage | Description | Gene Ratio | Bg Ratio | pvalue | p.adjust | qvalue | Count |
| Page: 1 |
Top |
Cell-cell communication analysis |
| Identification of potential cell-cell interactions between two cell types and their ligand-receptor pairs for different disease states |
| Ligand | Receptor | LRpair | Pathway | Tissue | Disease Stage |
| Page: 1 |
Top |
Single-cell gene regulatory network inference analysis |
| Find out the significant the regulons (TFs) and the target genes of each regulon across cell types for different disease states |
| TF | Cell Type | Tissue | Disease Stage | Target Gene | RSS | Regulon Activity |
| ∗The dot plots of a searched regulon are shown for all cell subpopulations in each disease state of each tissue based on the regulon specific score inferred using pySCENIC and by calculating the average expression. |
| Page: 1 |
Top |
Somatic mutation of malignant transformation related genes |
| Annotation of somatic variants for genes involved in malignant transformation |
| Hugo Symbol | Variant Class | Variant Classification | dbSNP RS | HGVSc | HGVSp | HGVSp Short | SWISSPROT | BIOTYPE | SIFT | PolyPhen | Tumor Sample Barcode | Tissue | Histology | Sex | Age | Stage | Therapy Types | Drugs | Outcome |
| LRRFIP1 | SNV | Missense_Mutation | c.964N>A | p.Glu322Lys | p.E322K | Q32MZ4 | protein_coding | deleterious(0.01) | probably_damaging(0.924) | TCGA-AC-A23H-01 | Breast | breast invasive carcinoma | Female | >=65 | I/II | Unknown | Unknown | PD | |
| LRRFIP1 | SNV | Missense_Mutation | c.892A>G | p.Arg298Gly | p.R298G | Q32MZ4 | protein_coding | deleterious(0) | possibly_damaging(0.812) | TCGA-AN-A0AT-01 | Breast | breast invasive carcinoma | Female | <65 | I/II | Unknown | Unknown | SD | |
| LRRFIP1 | SNV | Missense_Mutation | c.731G>C | p.Arg244Thr | p.R244T | Q32MZ4 | protein_coding | deleterious(0.03) | possibly_damaging(0.809) | TCGA-AN-A0XW-01 | Breast | breast invasive carcinoma | Female | <65 | III/IV | Unknown | Unknown | SD | |
| LRRFIP1 | insertion | Frame_Shift_Ins | novel | c.1417dupG | p.Glu473GlyfsTer11 | p.E473Gfs*11 | Q32MZ4 | protein_coding | TCGA-A8-A06P-01 | Breast | breast invasive carcinoma | Female | <65 | III/IV | Unspecific | SD | |||
| LRRFIP1 | insertion | Frame_Shift_Ins | novel | c.1418_1419insAGCTTTCATCTTATTTCTTTTTATTTATG | p.Lys474AlafsTer31 | p.K474Afs*31 | Q32MZ4 | protein_coding | TCGA-A8-A06P-01 | Breast | breast invasive carcinoma | Female | <65 | III/IV | Unspecific | SD | |||
| LRRFIP1 | insertion | Nonsense_Mutation | novel | c.634_635insCCTGAACTGGCAGCTCTTGCCGCTGCCTTT | p.Gln212delinsProTerThrGlySerSerCysArgCysLeuTer | p.Q212delinsP*TGSSCRCL* | Q32MZ4 | protein_coding | TCGA-A8-A0A4-01 | Breast | breast invasive carcinoma | Female | >=65 | I/II | Hormone Therapy | tamoxiphen | CR | ||
| LRRFIP1 | insertion | Frame_Shift_Ins | novel | c.1351_1352insCTGGGGAATCCAGTAG | p.Tyr451SerfsTer8 | p.Y451Sfs*8 | Q32MZ4 | protein_coding | TCGA-BH-A0B1-01 | Breast | breast invasive carcinoma | Female | >=65 | I/II | Chemotherapy | adriamycin | SD | ||
| LRRFIP1 | SNV | Missense_Mutation | novel | c.31G>A | p.Glu11Lys | p.E11K | Q32MZ4 | protein_coding | deleterious(0) | benign(0.142) | TCGA-EK-A2RE-01 | Cervix | cervical & endocervical cancer | Female | <65 | I/II | Unknown | Unknown | SD |
| LRRFIP1 | SNV | Missense_Mutation | c.1574N>G | p.Ser525Cys | p.S525C | Q32MZ4 | protein_coding | deleterious(0.02) | possibly_damaging(0.764) | TCGA-EK-A2RJ-01 | Cervix | cervical & endocervical cancer | Female | <65 | I/II | Unknown | Unknown | SD | |
| LRRFIP1 | SNV | Missense_Mutation | c.645G>C | p.Glu215Asp | p.E215D | Q32MZ4 | protein_coding | tolerated(0.07) | benign(0.232) | TCGA-FU-A3HY-01 | Cervix | cervical & endocervical cancer | Female | <65 | I/II | Chemotherapy | cisplatin | CR |
| Page: 1 2 3 4 5 6 7 8 9 |
Top |
Related drugs of malignant transformation related genes |
| Identification of chemicals and drugs interact with genes involved in malignant transfromation |
| (DGIdb 4.0) |
| Entrez ID | Symbol | Category | Interaction Types | Drug Claim Name | Drug Name | PMIDs |
| Page: 1 |

Copyright 2023-Present -The University of Texas Health Science Center at Houston |