| Entrez ID | Symbol | Replicates | Species | Organ | Tissue | Adj P-value | Log2FC | Malignancy |
| 8870 | IER3 | SYSMH2 | Human | Oral cavity | OSCC | 5.28e-22 | 2.37e+00 | 0.2326 |
| 8870 | IER3 | SYSMH3 | Human | Oral cavity | OSCC | 4.49e-45 | 2.39e+00 | 0.2442 |
| 8870 | IER3 | SYSMH4 | Human | Oral cavity | OSCC | 5.04e-64 | 2.24e+00 | 0.1226 |
| 8870 | IER3 | SYSMH5 | Human | Oral cavity | OSCC | 1.23e-24 | 1.83e+00 | 0.0647 |
| 8870 | IER3 | SYSMH6 | Human | Oral cavity | OSCC | 2.87e-44 | 2.58e+00 | 0.1275 |
| 8870 | IER3 | GSM5252126_BPH283PrGF_Via | Human | Prostate | BPH | 2.91e-03 | 1.60e+00 | -0.1771 |
| 8870 | IER3 | GSM5252127_BPH283PrSF_Via | Human | Prostate | BPH | 5.09e-07 | 1.32e+00 | -0.1453 |
| 8870 | IER3 | GSM5252129_BPH327PrSF_Via | Human | Prostate | BPH | 4.38e-09 | 1.29e+00 | -0.1697 |
| 8870 | IER3 | GSM5252130_BPH340PrGF_Via | Human | Prostate | BPH | 8.80e-19 | 1.44e+00 | -0.1972 |
| 8870 | IER3 | GSM5252131_BPH340PrSF_Via | Human | Prostate | BPH | 2.09e-24 | 2.09e+00 | -0.2126 |
| 8870 | IER3 | GSM5252132_BPH389PrGF | Human | Prostate | BPH | 1.60e-05 | 2.39e+00 | -0.2247 |
| 8870 | IER3 | GSM5252133_BPH389PrSF | Human | Prostate | BPH | 8.50e-16 | 3.20e+00 | -0.2027 |
| 8870 | IER3 | GSM5252134_BPH511PrG_Fcol_3GEX | Human | Prostate | BPH | 4.55e-13 | 1.74e+00 | -0.1433 |
| 8870 | IER3 | GSM5252135_BPH511PrPUr_Fcol_3GEX | Human | Prostate | BPH | 2.55e-33 | 3.45e+00 | -0.1833 |
| 8870 | IER3 | GSM5252136_BPH556PrGA1_Fcol | Human | Prostate | BPH | 3.49e-24 | 2.45e+00 | -0.23 |
| 8870 | IER3 | GSM5252137_BPH556PrGA2_Fcol | Human | Prostate | BPH | 3.18e-11 | 2.64e+00 | -0.23 |
| 8870 | IER3 | 047563_1562-all-cells | Human | Prostate | BPH | 3.71e-09 | 1.45e-01 | 0.0791 |
| 8870 | IER3 | 052099_1652-all-cells | Human | Prostate | BPH | 3.35e-03 | -3.33e-01 | 0.1038 |
| 8870 | IER3 | Dong_P1 | Human | Prostate | Tumor | 1.98e-12 | 2.23e-01 | 0.035 |
| 8870 | IER3 | Dong_P3 | Human | Prostate | Tumor | 1.73e-08 | -1.86e-01 | 0.0278 |
| Tissue | Expression Dynamics | Abbreviation |
| Breast | 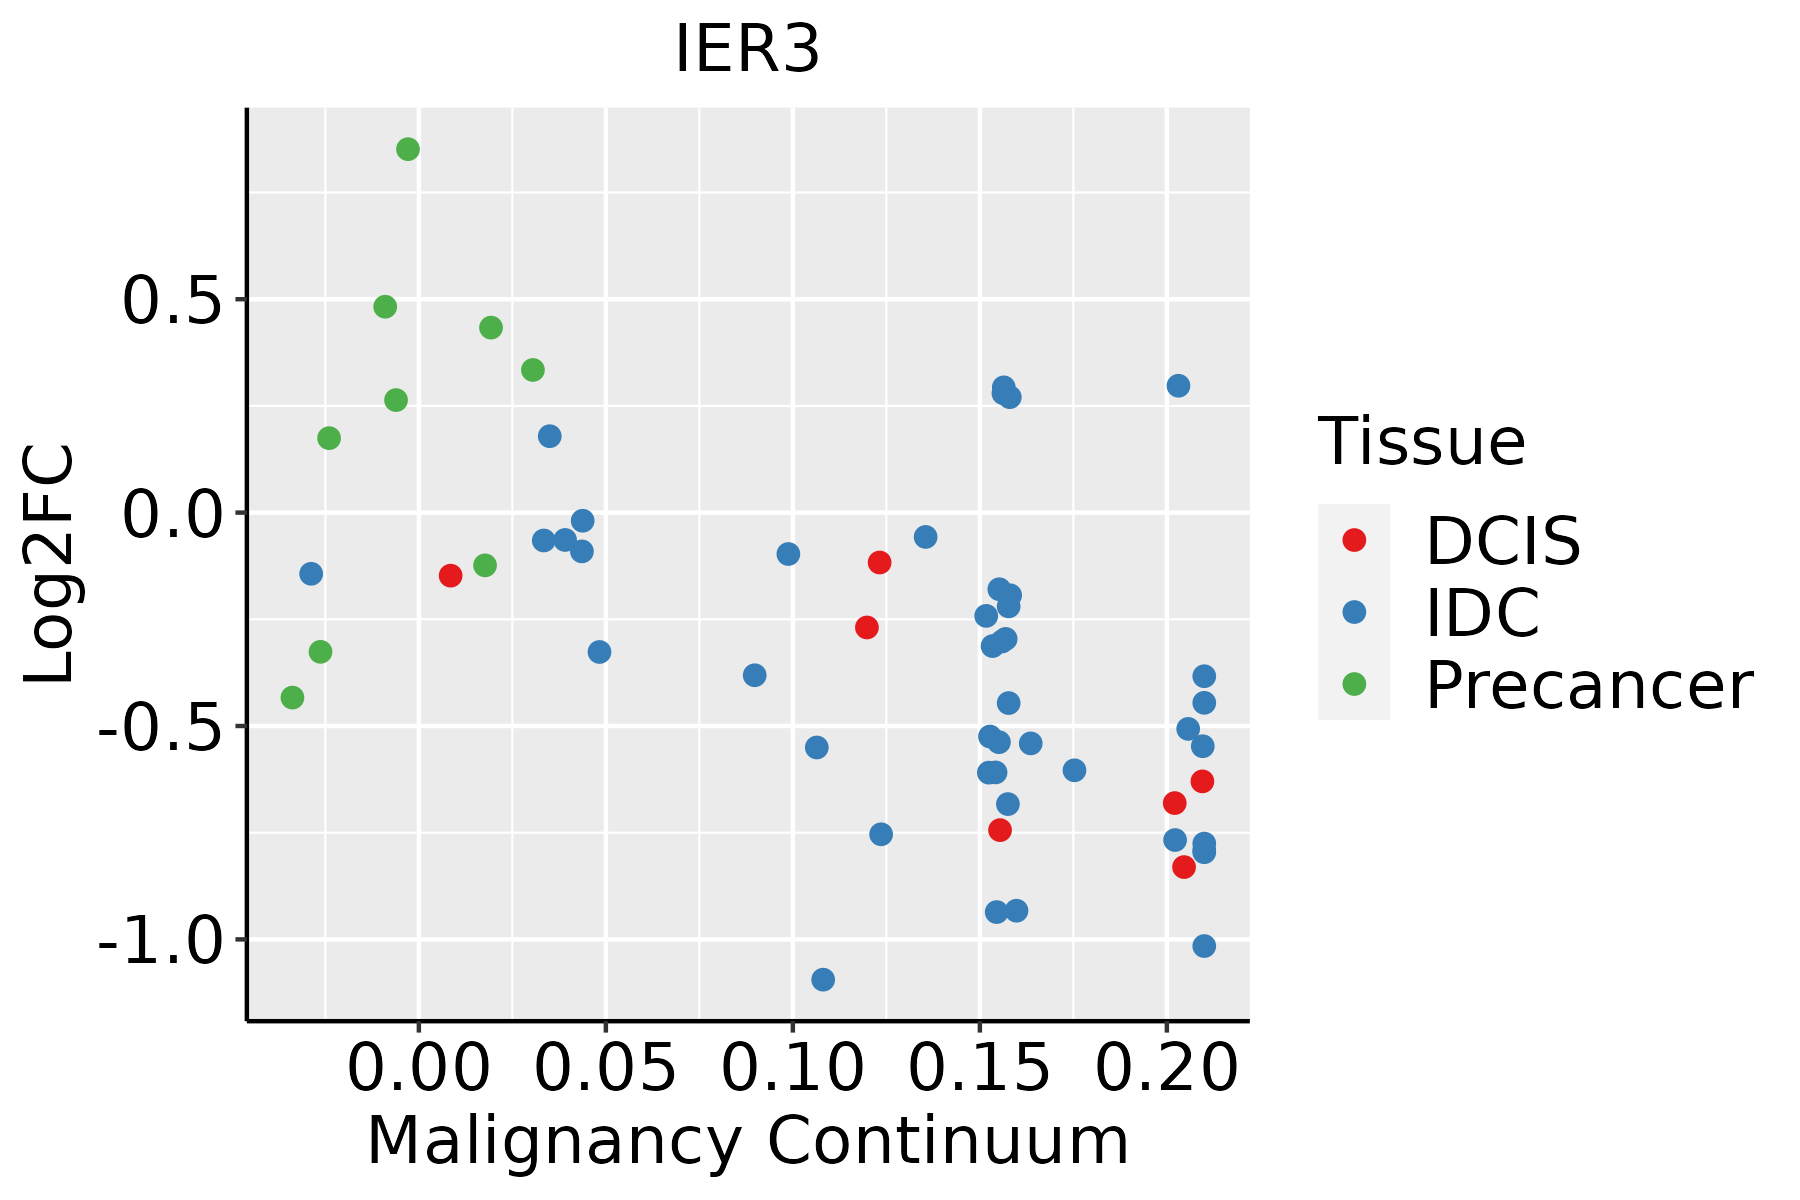 | IDC: Invasive ductal carcinoma |
| DCIS: Ductal carcinoma in situ |
| Precancer(BRCA1-mut): Precancerous lesion from BRCA1 mutation carriers |
| Cervix | 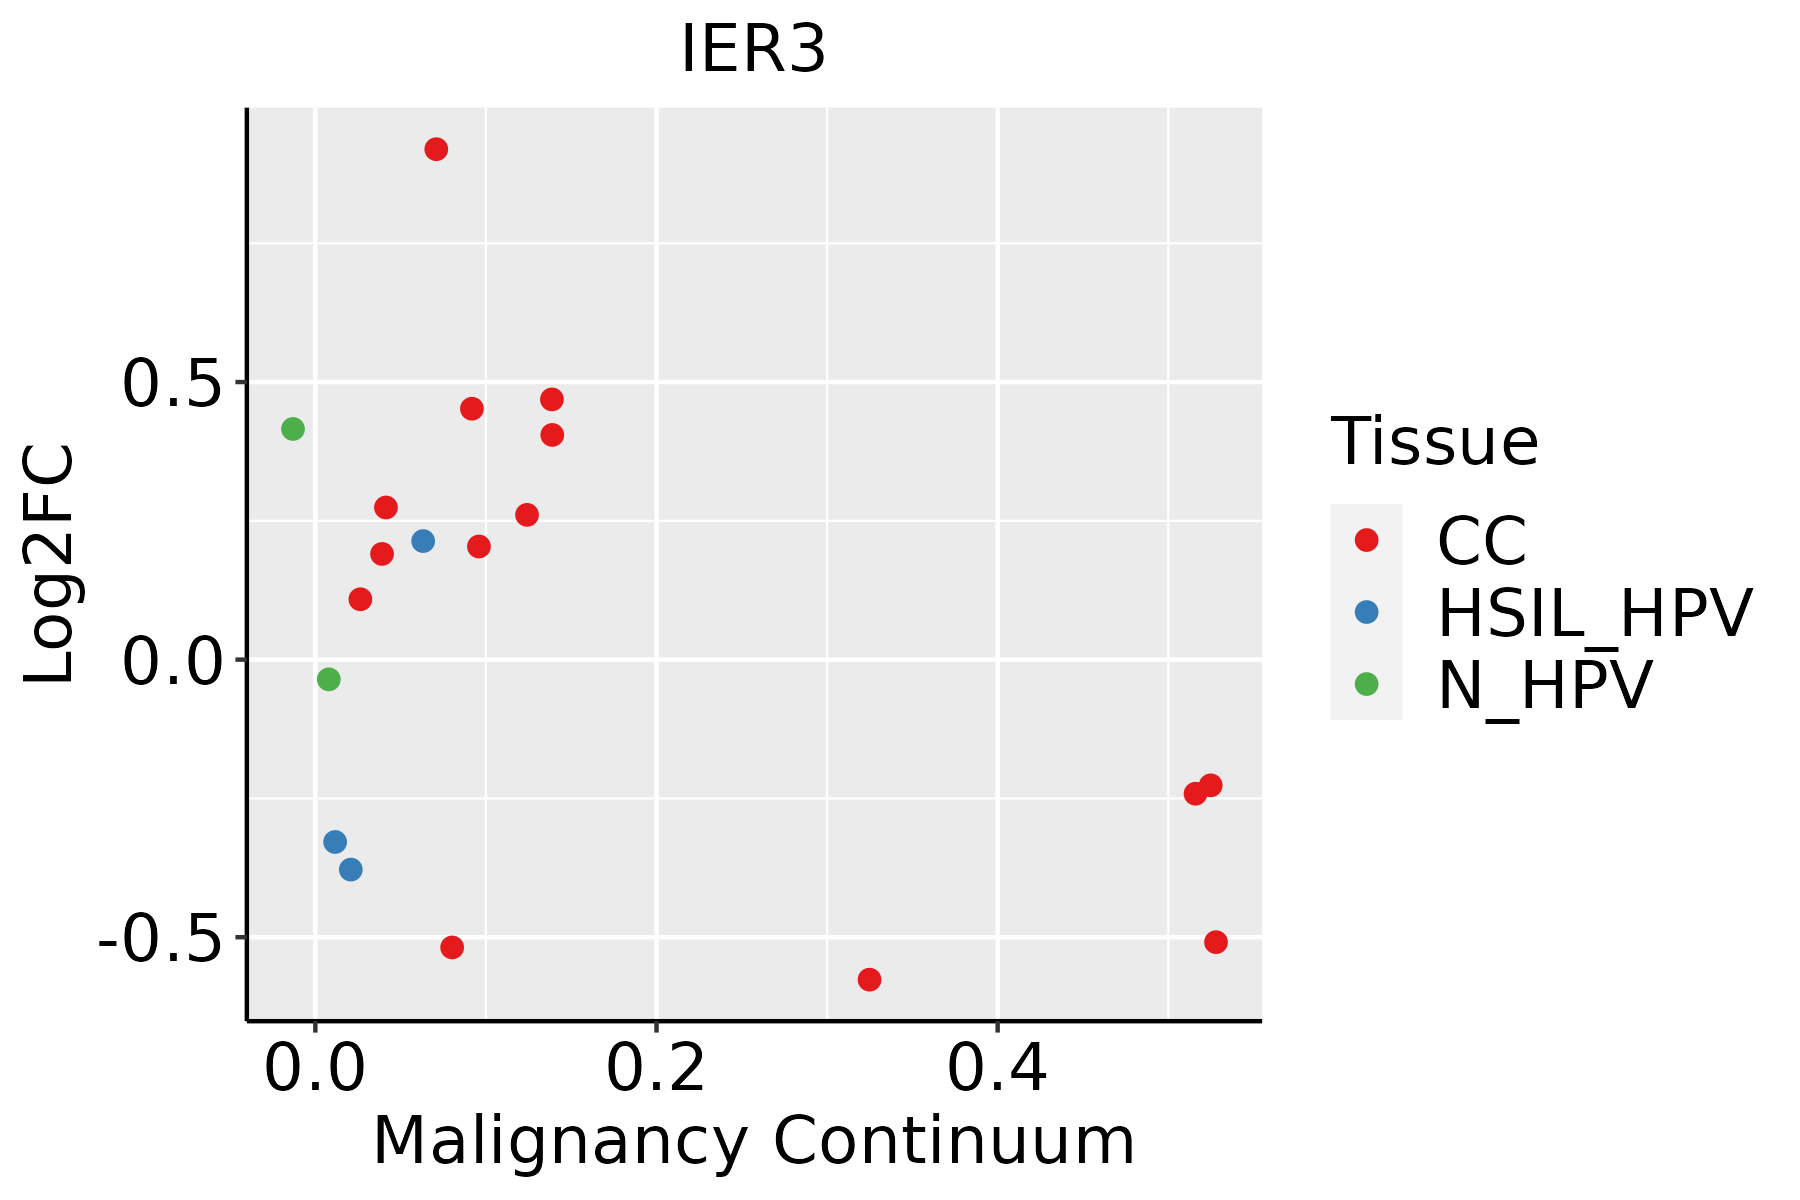 | CC: Cervix cancer |
| HSIL_HPV: HPV-infected high-grade squamous intraepithelial lesions |
| N_HPV: HPV-infected normal cervix |
| Endometrium | 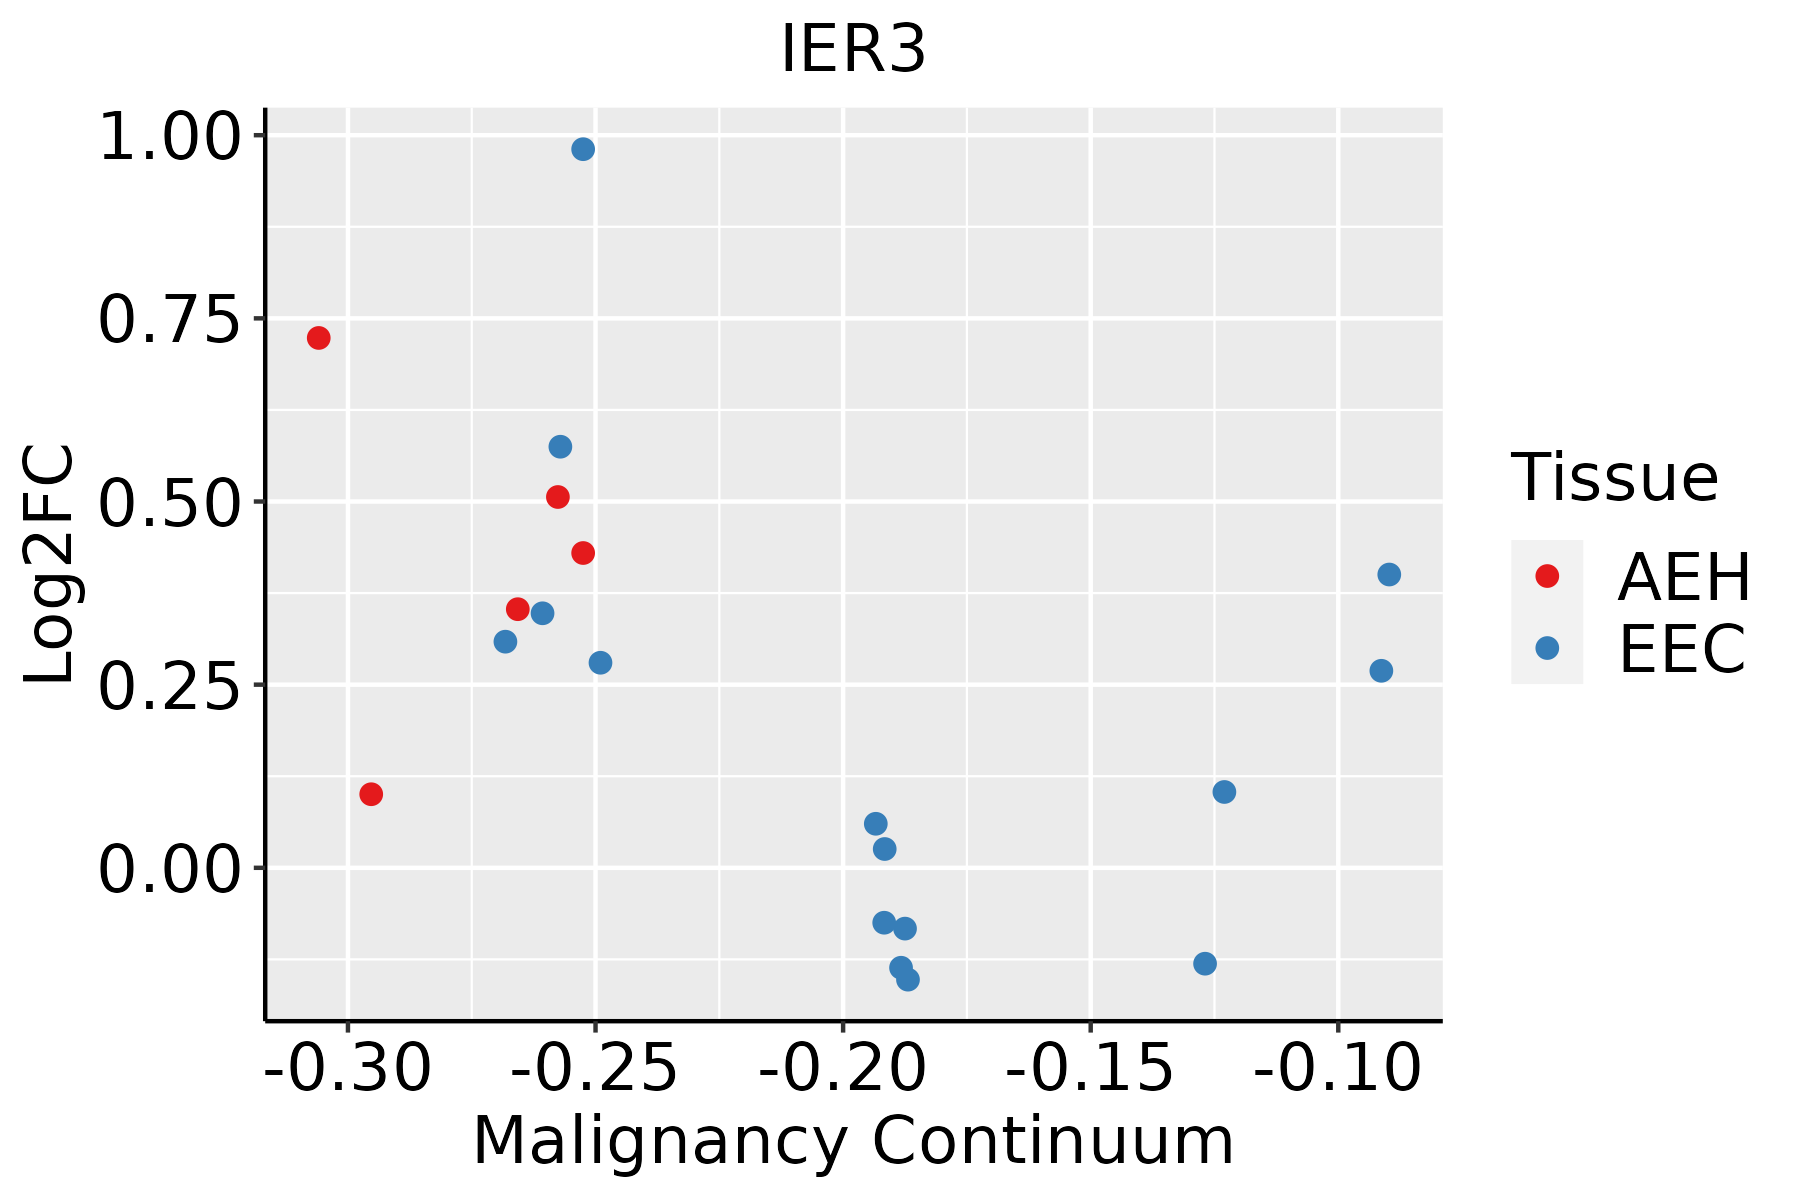 | AEH: Atypical endometrial hyperplasia |
| EEC: Endometrioid Cancer |
| Esophagus | 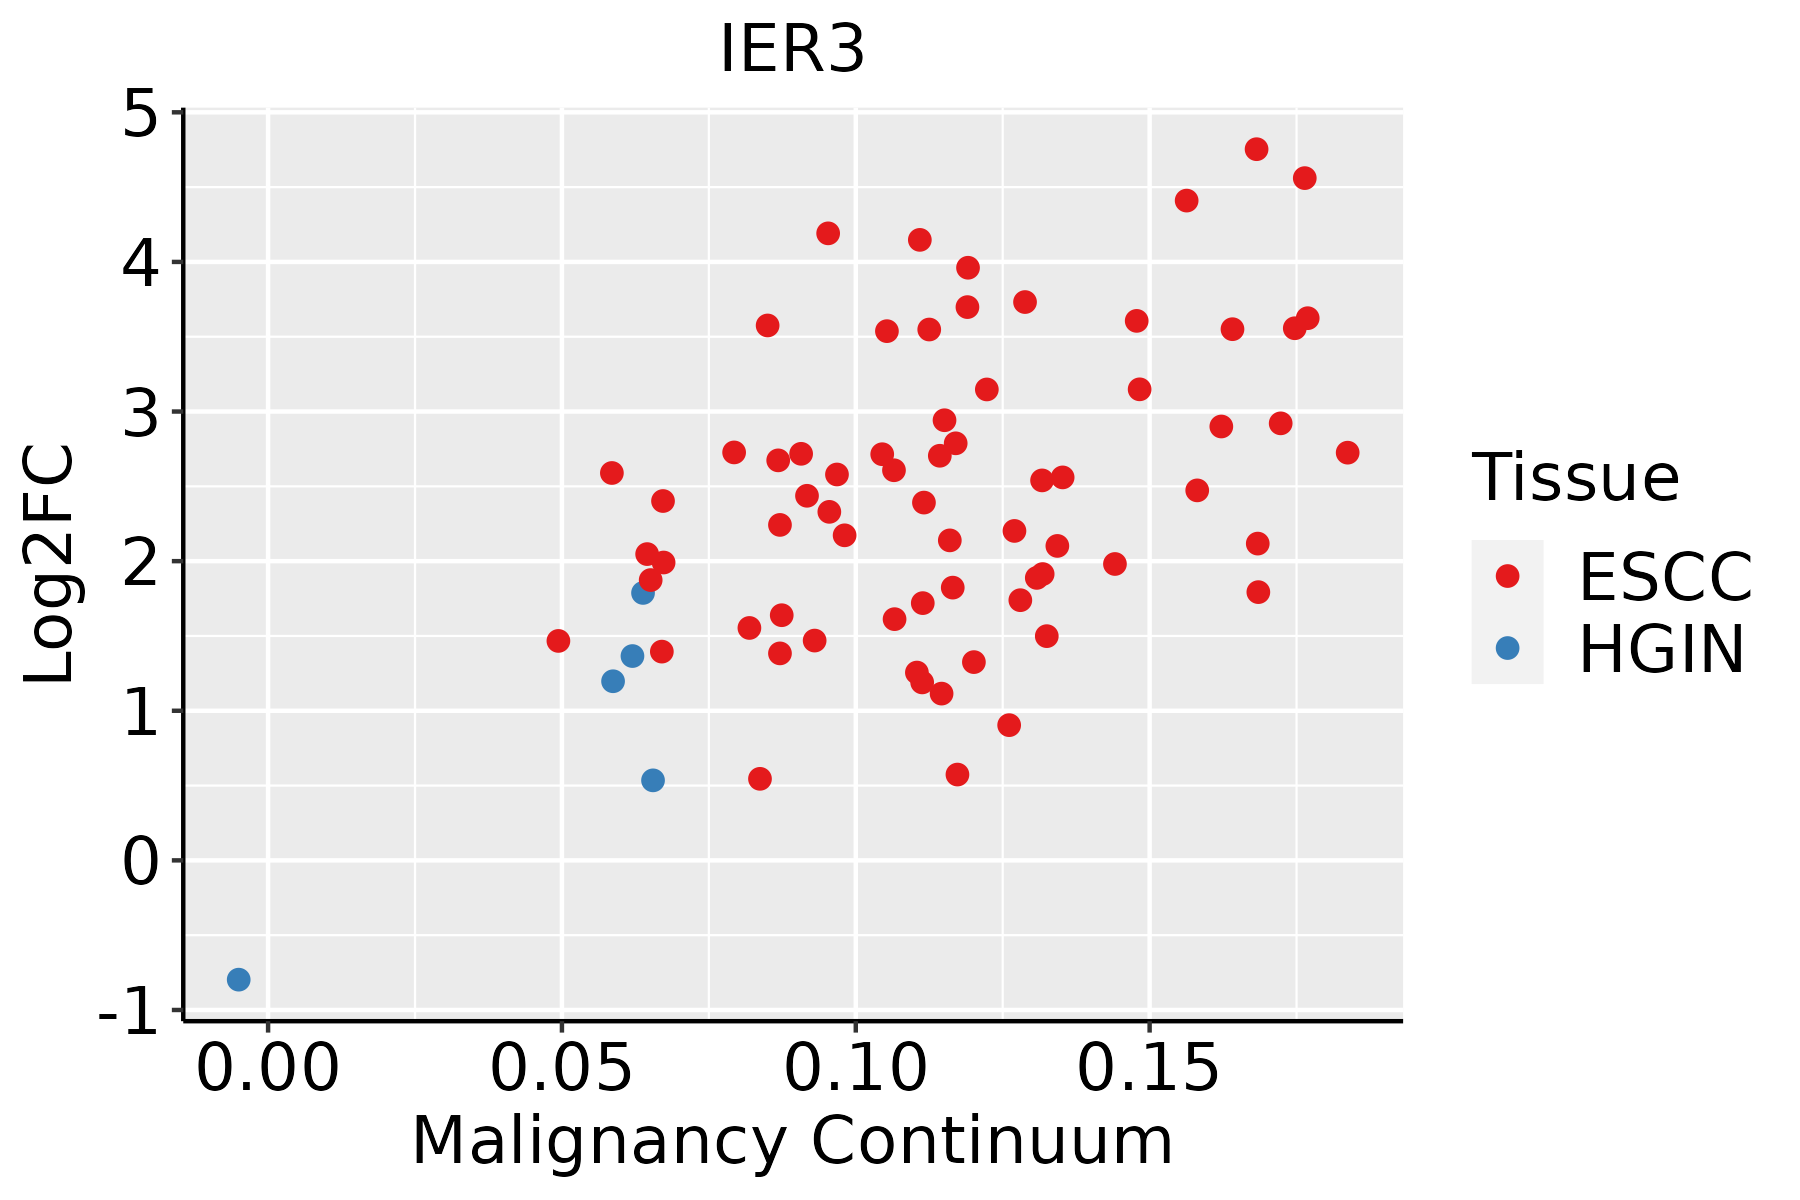 | ESCC: Esophageal squamous cell carcinoma |
| HGIN: High-grade intraepithelial neoplasias |
| LGIN: Low-grade intraepithelial neoplasias |
| GC |  | CAG: Chronic atrophic gastritis |
| CAG with IM: Chronic atrophic gastritis with intestinal metaplasia |
| CSG: Chronic superficial gastritis |
| GC: Gastric cancer |
| SIM: Severe intestinal metaplasia |
| WIM: Wild intestinal metaplasia |
| Liver | 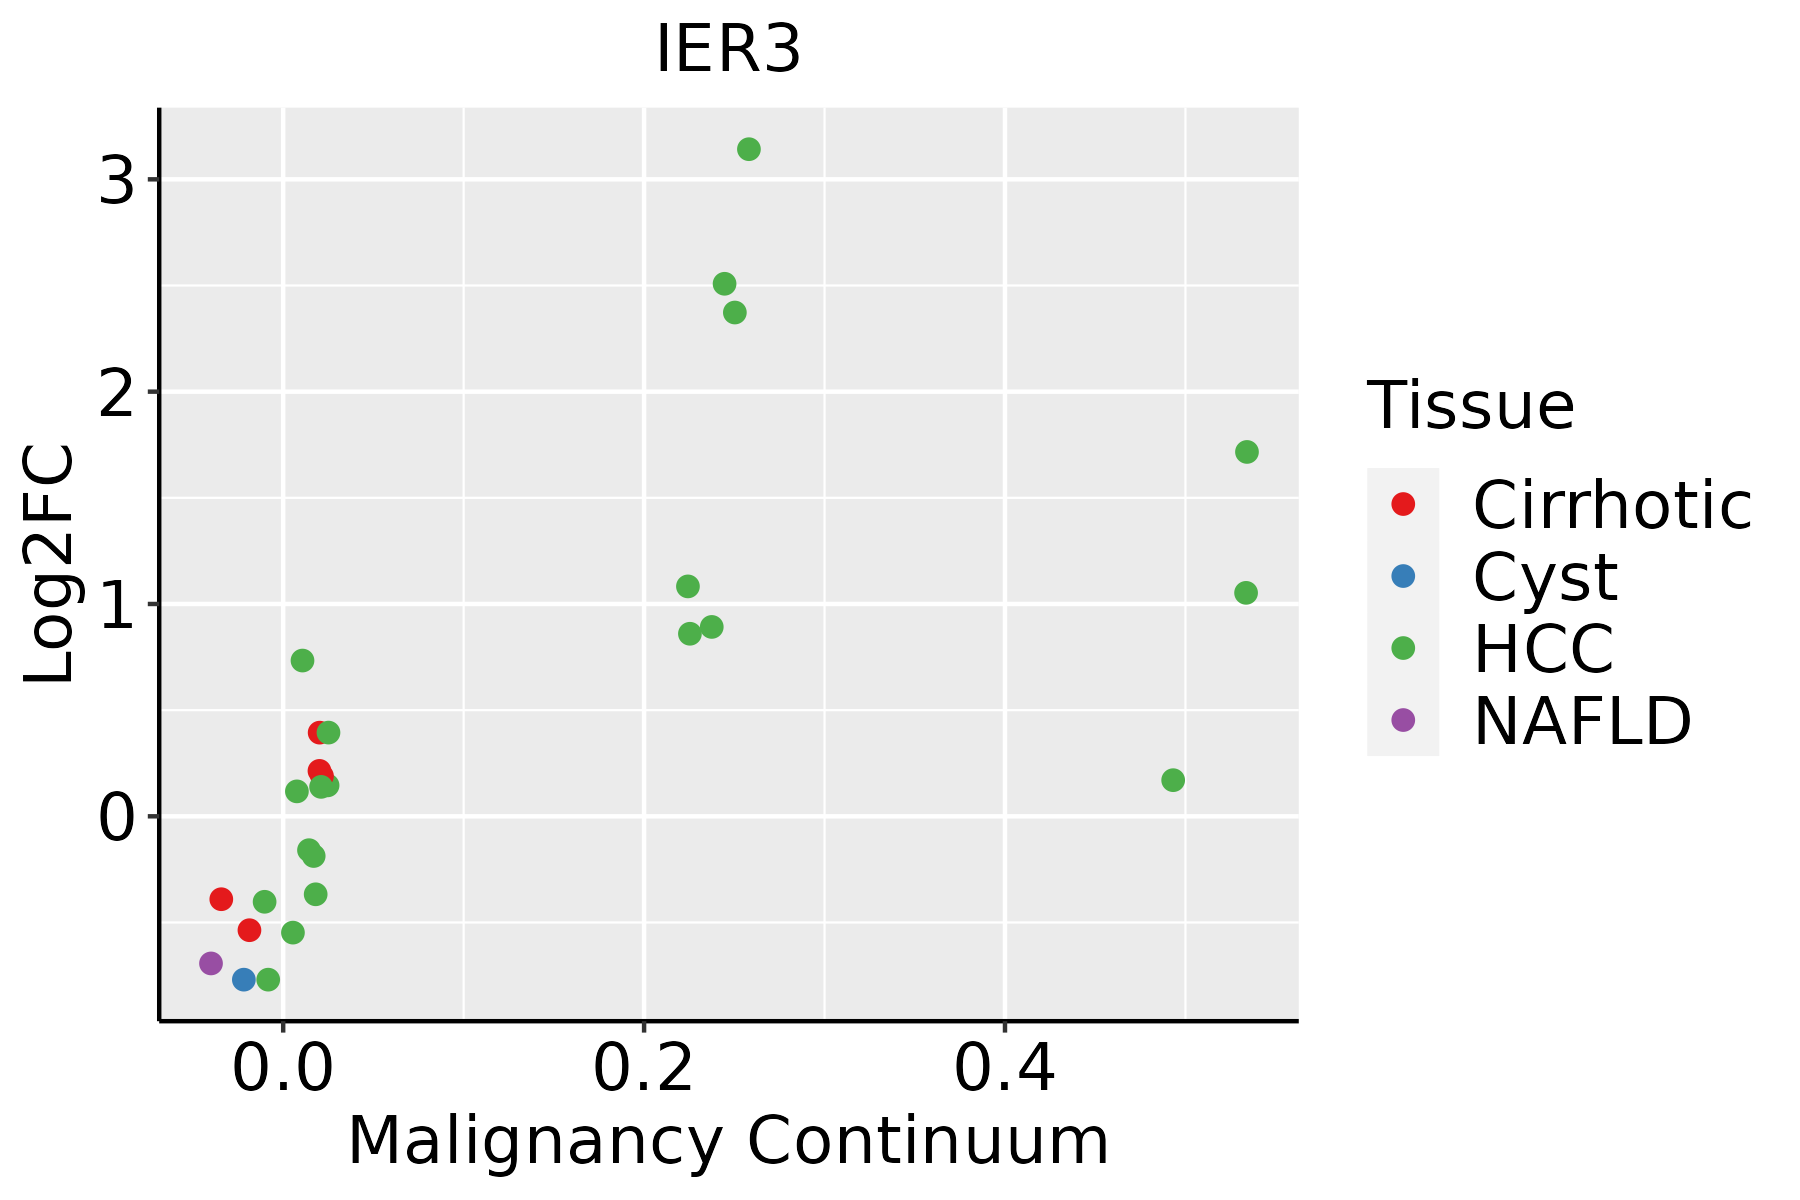 | HCC: Hepatocellular carcinoma |
| NAFLD: Non-alcoholic fatty liver disease |
| Lung | 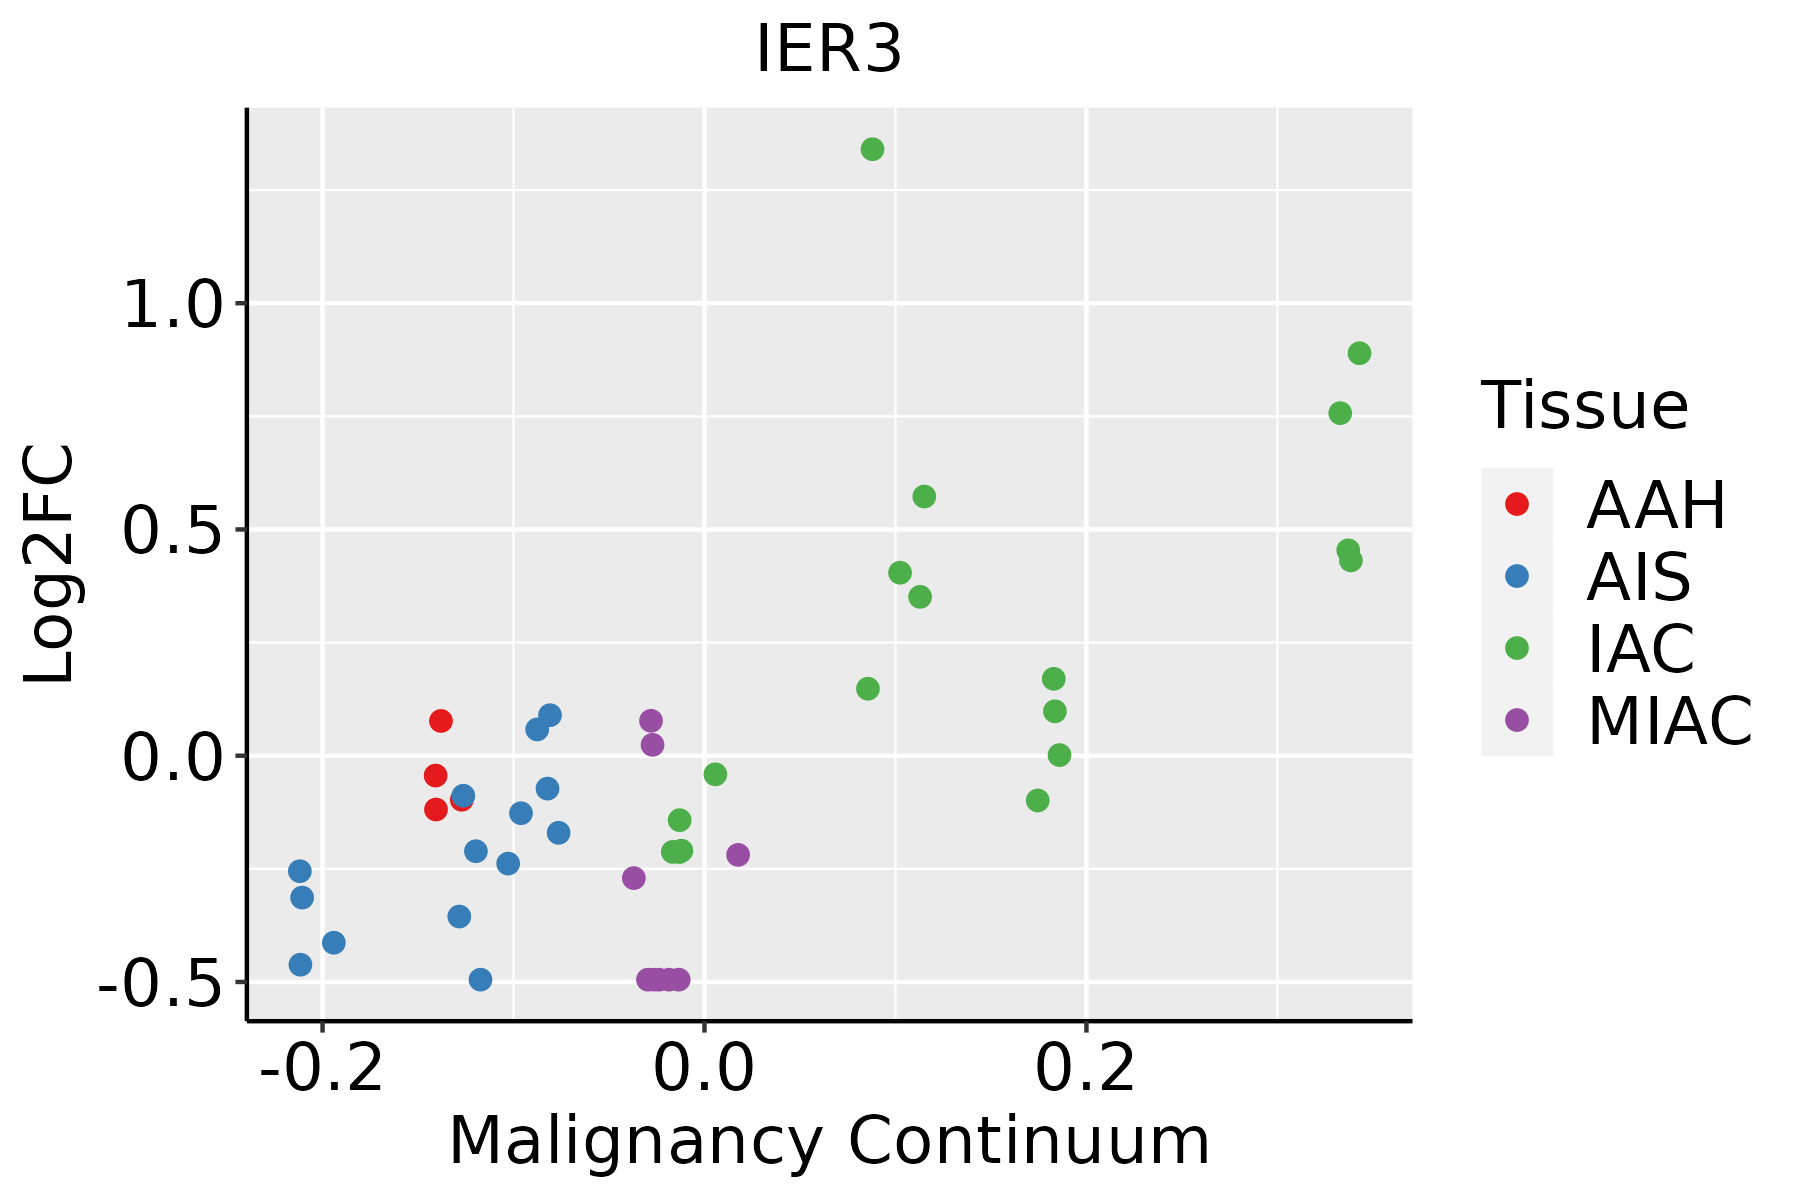 | AAH: Atypical adenomatous hyperplasia |
| AIS: Adenocarcinoma in situ |
| IAC: Invasive lung adenocarcinoma |
| MIA: Minimally invasive adenocarcinoma |
| Oral Cavity | 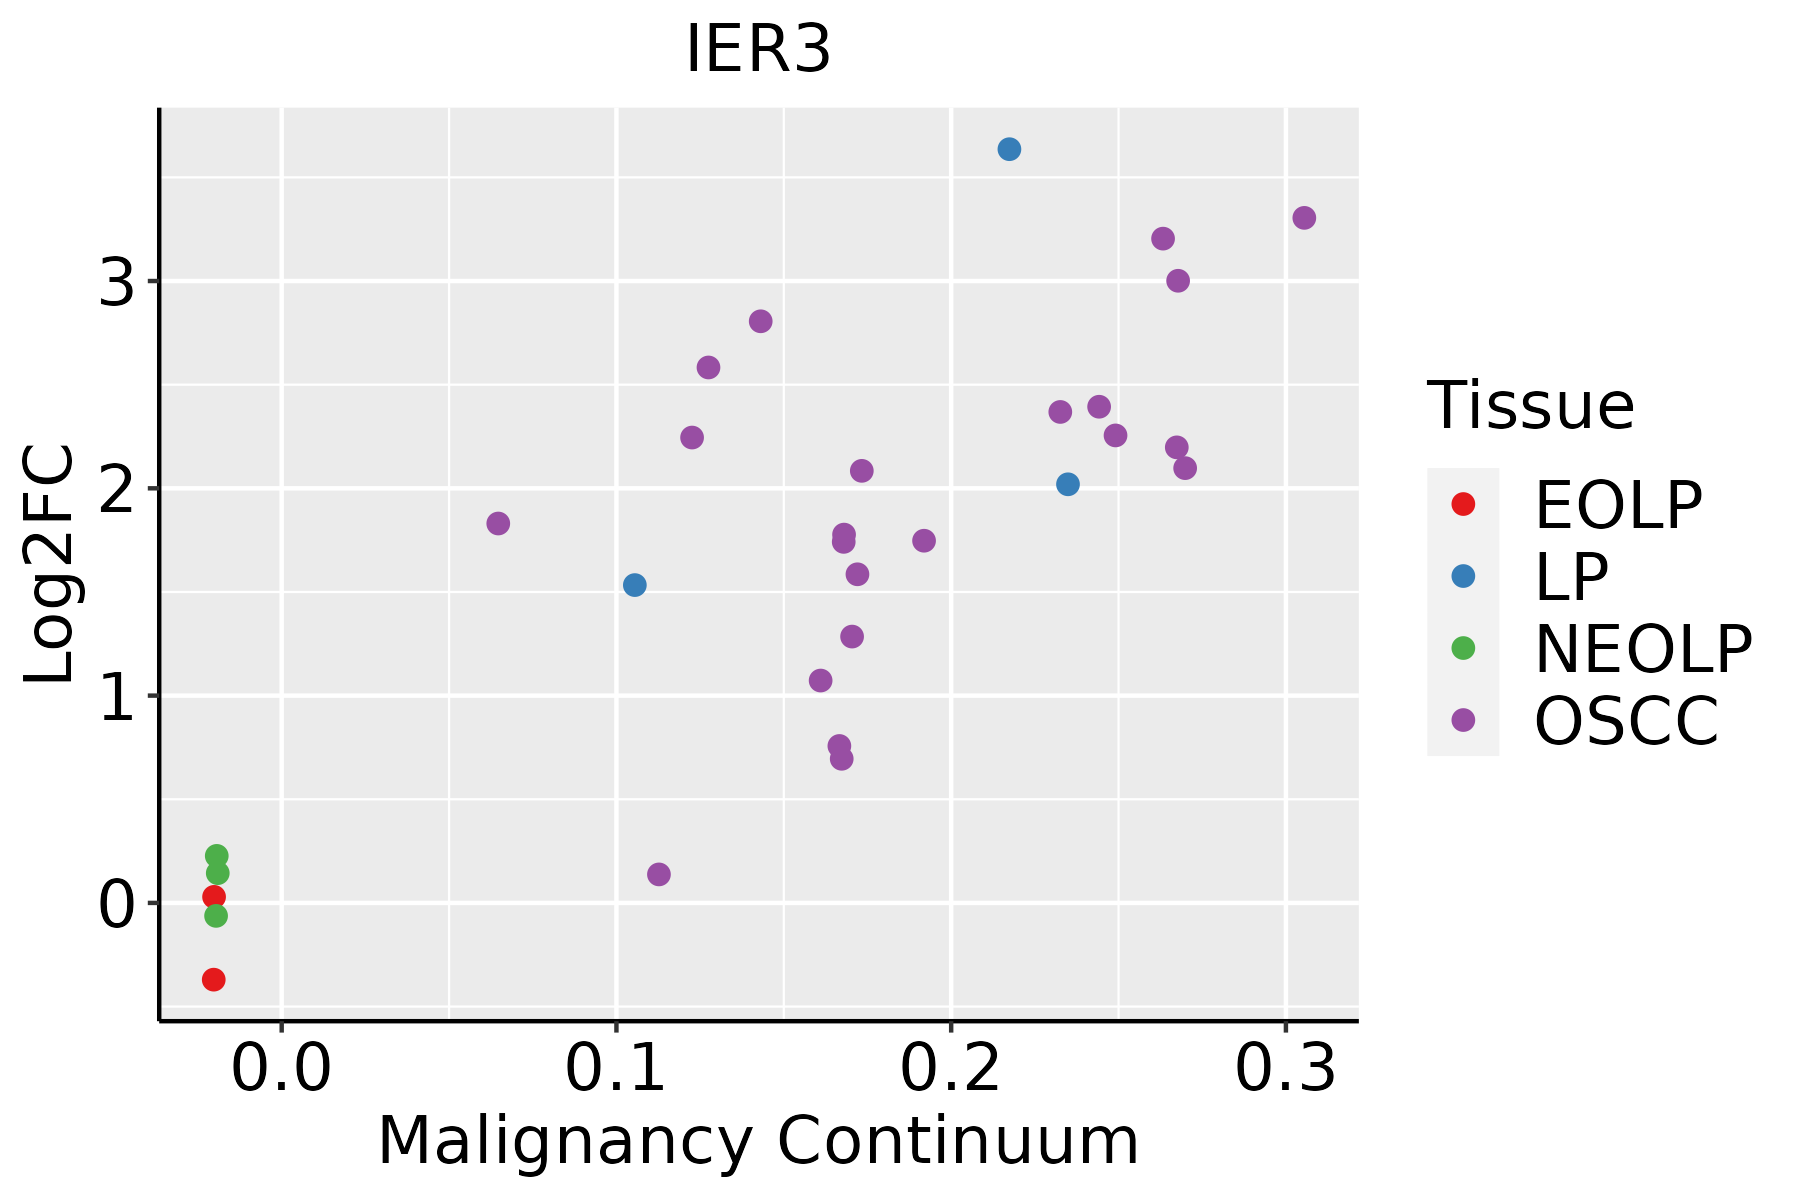 | EOLP: Erosive Oral lichen planus |
| LP: leukoplakia |
| NEOLP: Non-erosive oral lichen planus |
| OSCC: Oral squamous cell carcinoma |
| Prostate | 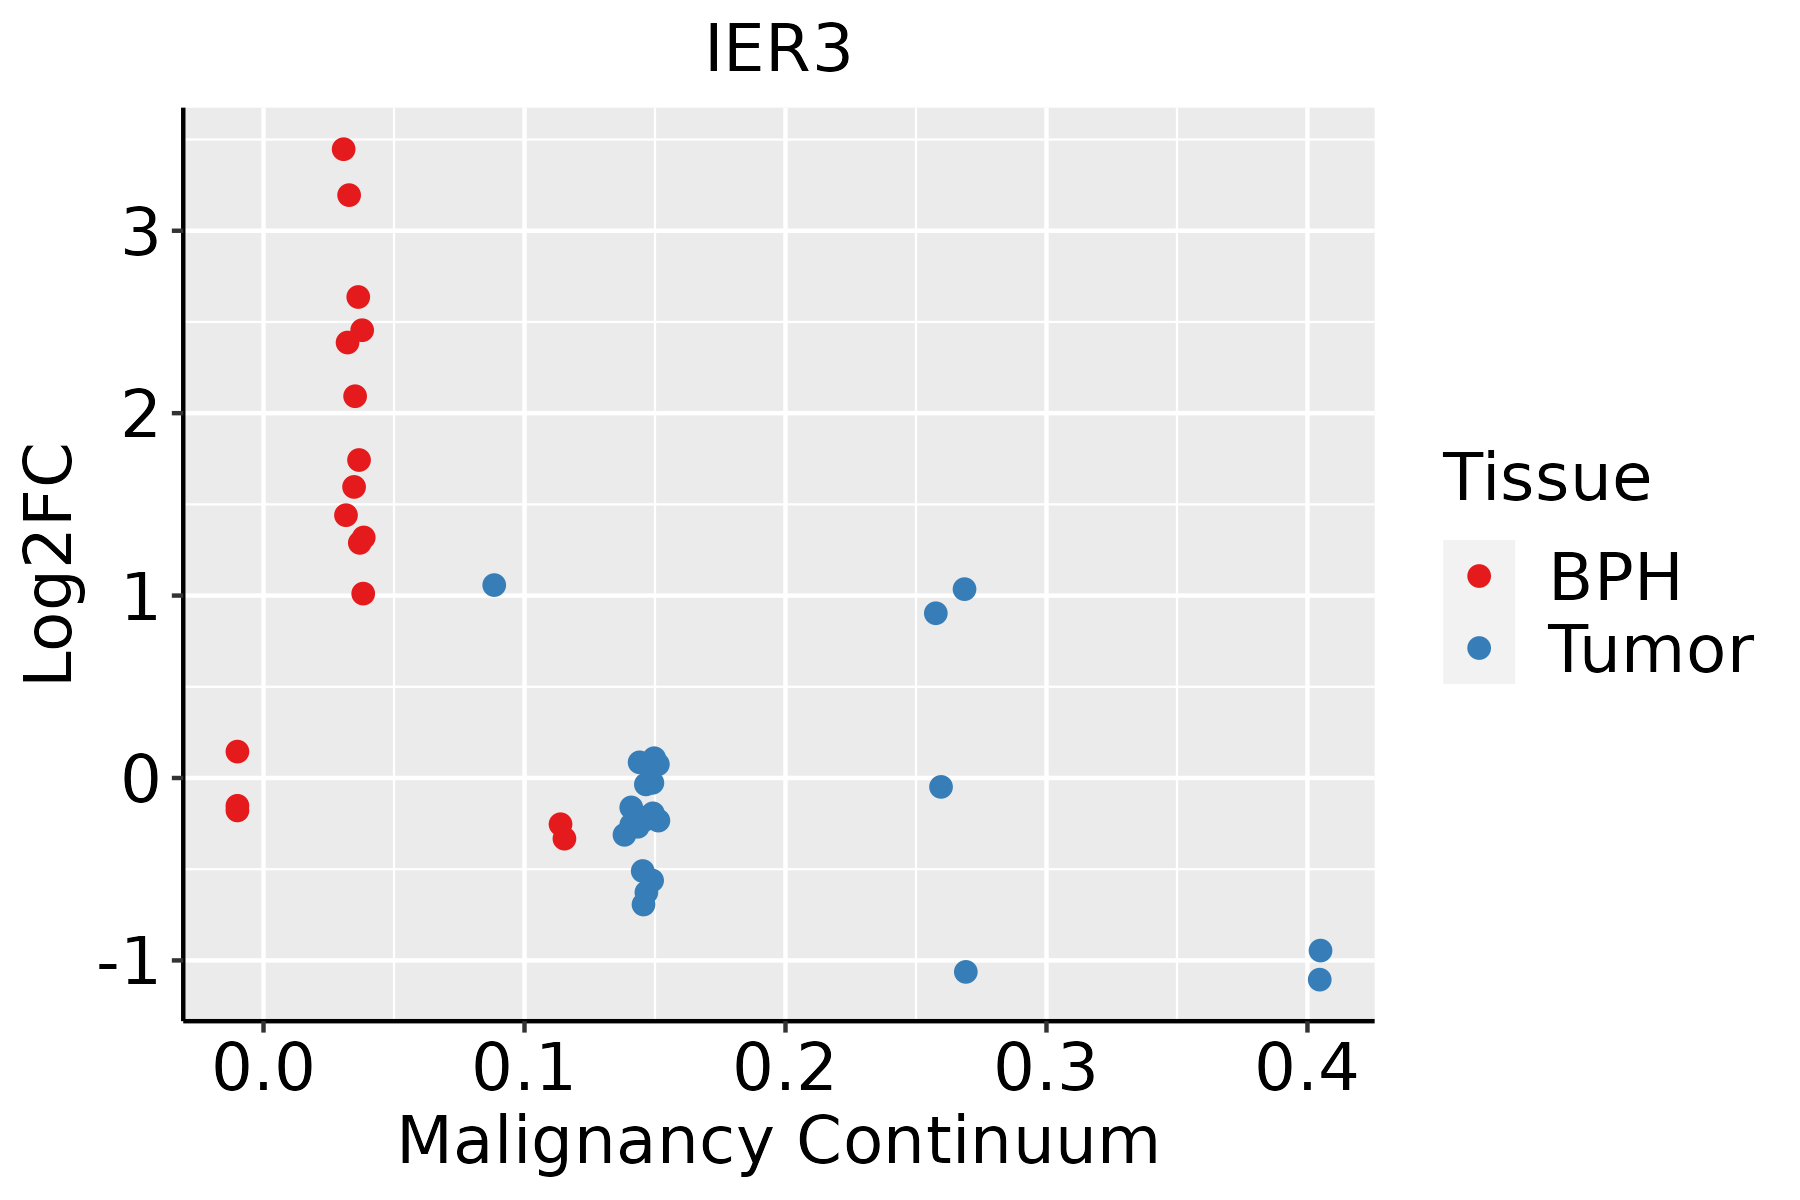 | BPH: Benign Prostatic Hyperplasia |
| Skin |  | AK: Actinic keratosis |
| cSCC: Cutaneous squamous cell carcinoma |
| SCCIS:squamous cell carcinoma in situ |
| Thyroid |  | ATC: Anaplastic thyroid cancer |
| HT: Hashimoto's thyroiditis |
| PTC: Papillary thyroid cancer |
| GO ID | Tissue | Disease Stage | Description | Gene Ratio | Bg Ratio | pvalue | p.adjust | Count |
| GO:20010208 | Breast | Precancer | regulation of response to DNA damage stimulus | 24/1080 | 219/18723 | 1.93e-03 | 1.87e-02 | 24 |
| GO:200102013 | Breast | IDC | regulation of response to DNA damage stimulus | 30/1434 | 219/18723 | 1.36e-03 | 1.40e-02 | 30 |
| GO:200102023 | Breast | DCIS | regulation of response to DNA damage stimulus | 30/1390 | 219/18723 | 8.32e-04 | 9.47e-03 | 30 |
| GO:20010209 | Cervix | CC | regulation of response to DNA damage stimulus | 46/2311 | 219/18723 | 1.92e-04 | 2.23e-03 | 46 |
| GO:190495115 | Endometrium | AEH | positive regulation of establishment of protein localization | 74/2100 | 319/18723 | 7.05e-10 | 6.51e-08 | 74 |
| GO:005122215 | Endometrium | AEH | positive regulation of protein transport | 66/2100 | 303/18723 | 7.79e-08 | 3.99e-06 | 66 |
| GO:00481939 | Endometrium | AEH | Golgi vesicle transport | 60/2100 | 296/18723 | 3.65e-06 | 9.79e-05 | 60 |
| GO:00068886 | Endometrium | AEH | endoplasmic reticulum to Golgi vesicle-mediated transport | 29/2100 | 130/18723 | 2.11e-04 | 2.59e-03 | 29 |
| GO:00507087 | Endometrium | AEH | regulation of protein secretion | 49/2100 | 268/18723 | 3.83e-04 | 4.12e-03 | 49 |
| GO:00507149 | Endometrium | AEH | positive regulation of protein secretion | 28/2100 | 137/18723 | 1.17e-03 | 1.01e-02 | 28 |
| GO:200102010 | Endometrium | AEH | regulation of response to DNA damage stimulus | 40/2100 | 219/18723 | 1.28e-03 | 1.09e-02 | 40 |
| GO:0035265 | Endometrium | AEH | organ growth | 33/2100 | 178/18723 | 2.53e-03 | 1.87e-02 | 33 |
| GO:00716927 | Endometrium | AEH | protein localization to extracellular region | 58/2100 | 368/18723 | 4.72e-03 | 3.00e-02 | 58 |
| GO:00093068 | Endometrium | AEH | protein secretion | 56/2100 | 359/18723 | 6.71e-03 | 3.94e-02 | 56 |
| GO:00355928 | Endometrium | AEH | establishment of protein localization to extracellular region | 56/2100 | 360/18723 | 7.10e-03 | 4.09e-02 | 56 |
| GO:190495116 | Endometrium | EEC | positive regulation of establishment of protein localization | 74/2168 | 319/18723 | 2.90e-09 | 2.10e-07 | 74 |
| GO:005122216 | Endometrium | EEC | positive regulation of protein transport | 66/2168 | 303/18723 | 2.55e-07 | 1.09e-05 | 66 |
| GO:004819313 | Endometrium | EEC | Golgi vesicle transport | 60/2168 | 296/18723 | 9.91e-06 | 2.17e-04 | 60 |
| GO:000688812 | Endometrium | EEC | endoplasmic reticulum to Golgi vesicle-mediated transport | 29/2168 | 130/18723 | 3.63e-04 | 3.95e-03 | 29 |
| GO:005070813 | Endometrium | EEC | regulation of protein secretion | 50/2168 | 268/18723 | 4.33e-04 | 4.51e-03 | 50 |


