
|
|||||
|
 | |
| |
| |
| |
| |
| |
|
Gene: ID3 |
Gene summary for ID3 |
| Gene information | Species | Human | Gene symbol | ID3 | Gene ID | 3399 |
| Gene name | inhibitor of DNA binding 3, HLH protein | |
| Gene Alias | HEIR-1 | |
| Cytomap | 1p36.12 | |
| Gene Type | protein-coding | GO ID | GO:0000122 | UniProtAcc | Q02535 |
Top |
Malignant transformation analysis |
| Identification of the aberrant gene expression in precancerous and cancerous lesions by comparing the gene expression of stem-like cells in diseased tissues with normal stem cells |
| Entrez ID | Symbol | Replicates | Species | Organ | Tissue | Adj P-value | Log2FC | Malignancy |
| 3399 | ID3 | P9 | Human | Prostate | Tumor | 4.00e-10 | 8.66e-01 | -0.0285 |
| 3399 | ID3 | GSM5353243_PA_PR5261_T1_S23_L002 | Human | Prostate | Tumor | 5.00e-02 | -3.06e-01 | 0.1545 |
| 3399 | ID3 | P3_S6_AK | Human | Skin | AK | 1.82e-13 | -6.28e-01 | -0.3256 |
| 3399 | ID3 | P4_S8_cSCC | Human | Skin | cSCC | 2.47e-06 | -3.84e-01 | -0.3095 |
| 3399 | ID3 | P5_S10_cSCC | Human | Skin | cSCC | 7.99e-15 | -9.20e-02 | -0.299 |
| 3399 | ID3 | cSCC_p1 | Human | Skin | cSCC | 5.01e-06 | -4.48e-01 | -0.1916 |
| 3399 | ID3 | cSCC_p11 | Human | Skin | cSCC | 4.53e-12 | -4.72e-01 | -0.2102 |
| 3399 | ID3 | cSCC_p3 | Human | Skin | cSCC | 4.66e-10 | -5.98e-01 | -0.2085 |
| 3399 | ID3 | cSCC_p4 | Human | Skin | cSCC | 2.97e-17 | -5.97e-01 | -0.2022 |
| 3399 | ID3 | cSCC_p6 | Human | Skin | cSCC | 4.54e-11 | -5.98e-01 | -0.1989 |
| 3399 | ID3 | cSCC_p7 | Human | Skin | cSCC | 5.46e-11 | -6.46e-01 | -0.2332 |
| 3399 | ID3 | cSCC_p8 | Human | Skin | cSCC | 4.77e-08 | -3.21e-01 | -0.1971 |
| 3399 | ID3 | cSCC_p9 | Human | Skin | cSCC | 3.56e-09 | -2.91e-01 | -0.1991 |
| 3399 | ID3 | Pat01-B | Human | Stomach | GC | 4.46e-10 | 2.08e-01 | 0.5754 |
| 3399 | ID3 | Pat02-B | Human | Stomach | GC | 7.07e-17 | 2.53e-01 | 0.0368 |
| 3399 | ID3 | Pat03-B | Human | Stomach | GC | 1.63e-19 | 4.14e-01 | 0.3693 |
| 3399 | ID3 | Pat04-B | Human | Stomach | GC | 3.34e-44 | 9.65e-01 | -0.1483 |
| 3399 | ID3 | Pat05-B | Human | Stomach | GC | 1.18e-18 | 6.46e-01 | -0.0353 |
| 3399 | ID3 | Pat06-B | Human | Stomach | GC | 3.56e-33 | 5.39e-01 | -0.1961 |
| 3399 | ID3 | Pat11-B | Human | Stomach | GC | 3.06e-10 | 2.99e-01 | -0.182 |
| Page: 1 2 3 4 5 6 7 8 9 10 11 |
| Tissue | Expression Dynamics | Abbreviation |
| Cervix | 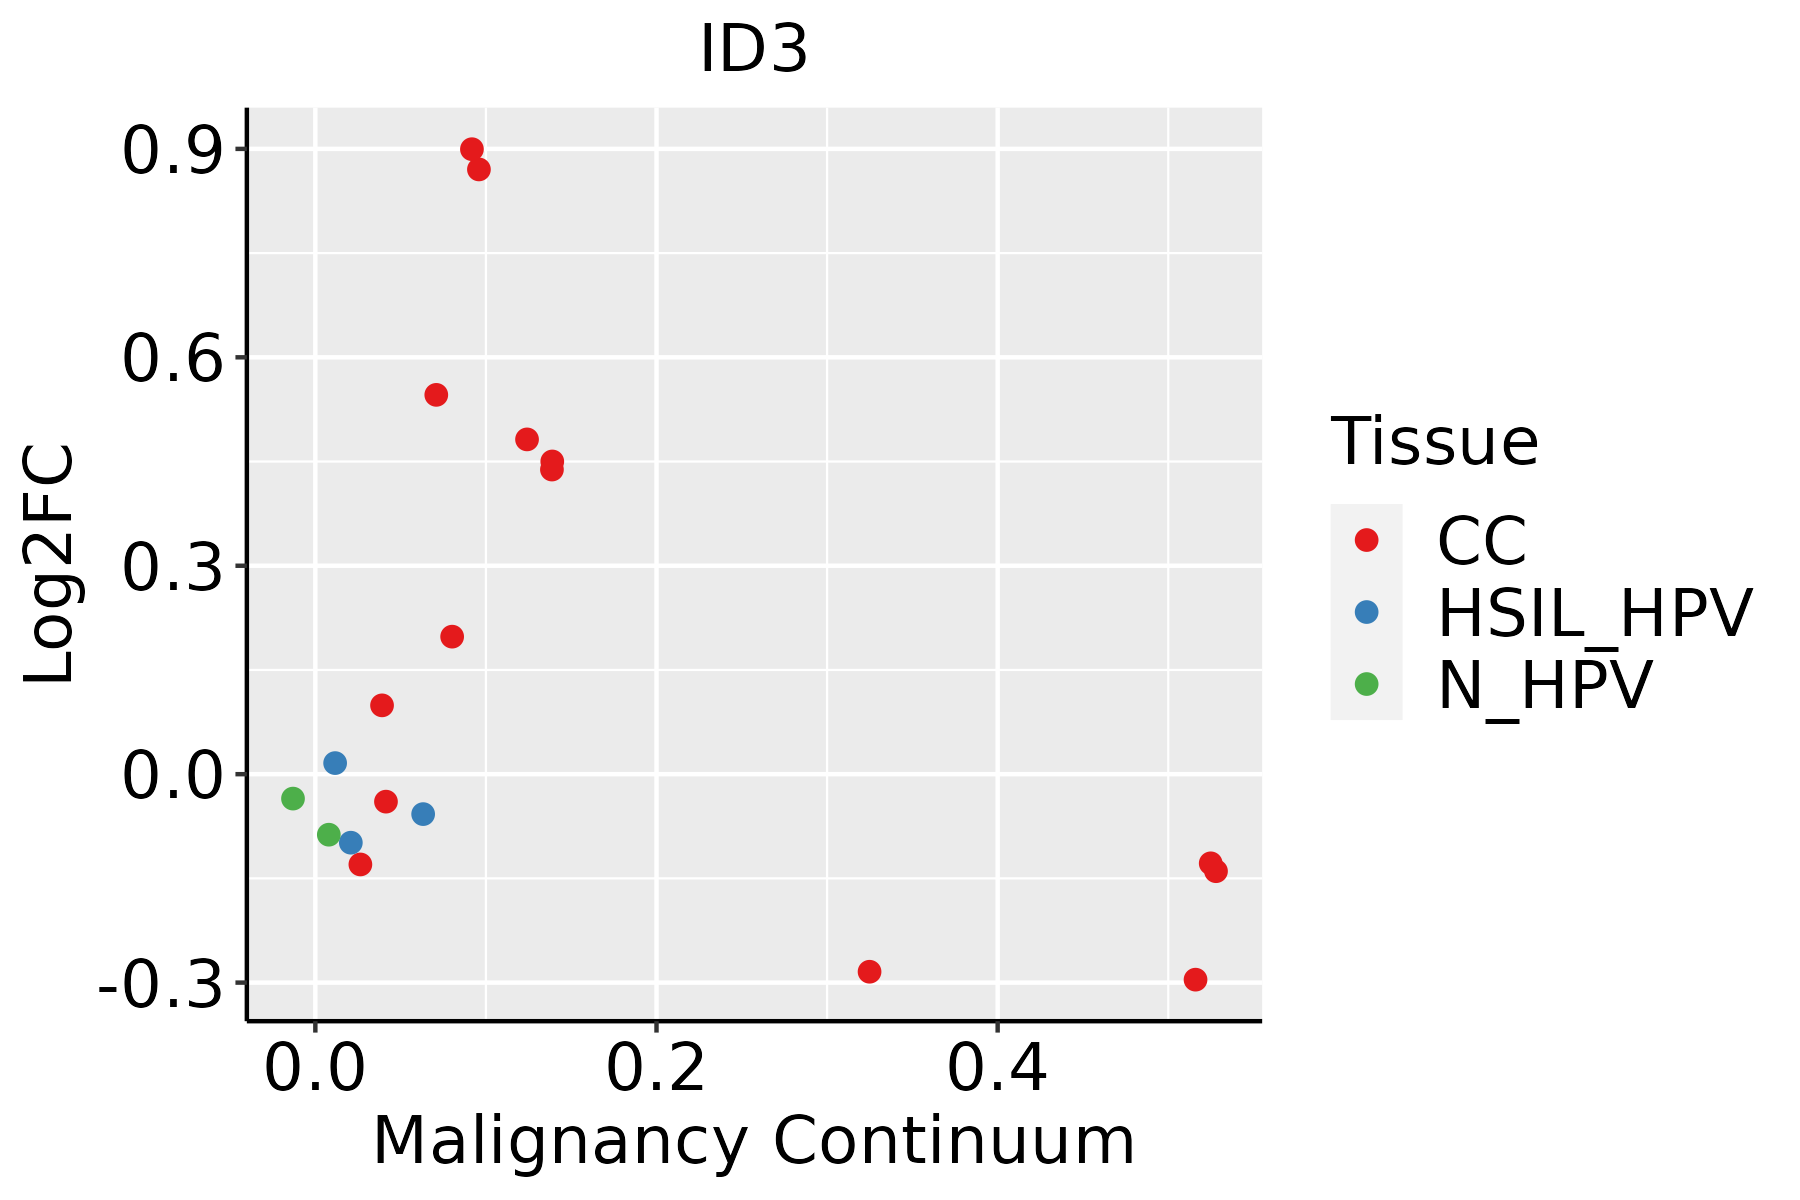 | CC: Cervix cancer |
| HSIL_HPV: HPV-infected high-grade squamous intraepithelial lesions | ||
| N_HPV: HPV-infected normal cervix | ||
| Colorectum (GSE201348) |  | FAP: Familial adenomatous polyposis |
| CRC: Colorectal cancer | ||
| Colorectum (HTA11) |  | AD: Adenomas |
| SER: Sessile serrated lesions | ||
| MSI-H: Microsatellite-high colorectal cancer | ||
| MSS: Microsatellite stable colorectal cancer | ||
| Endometrium | 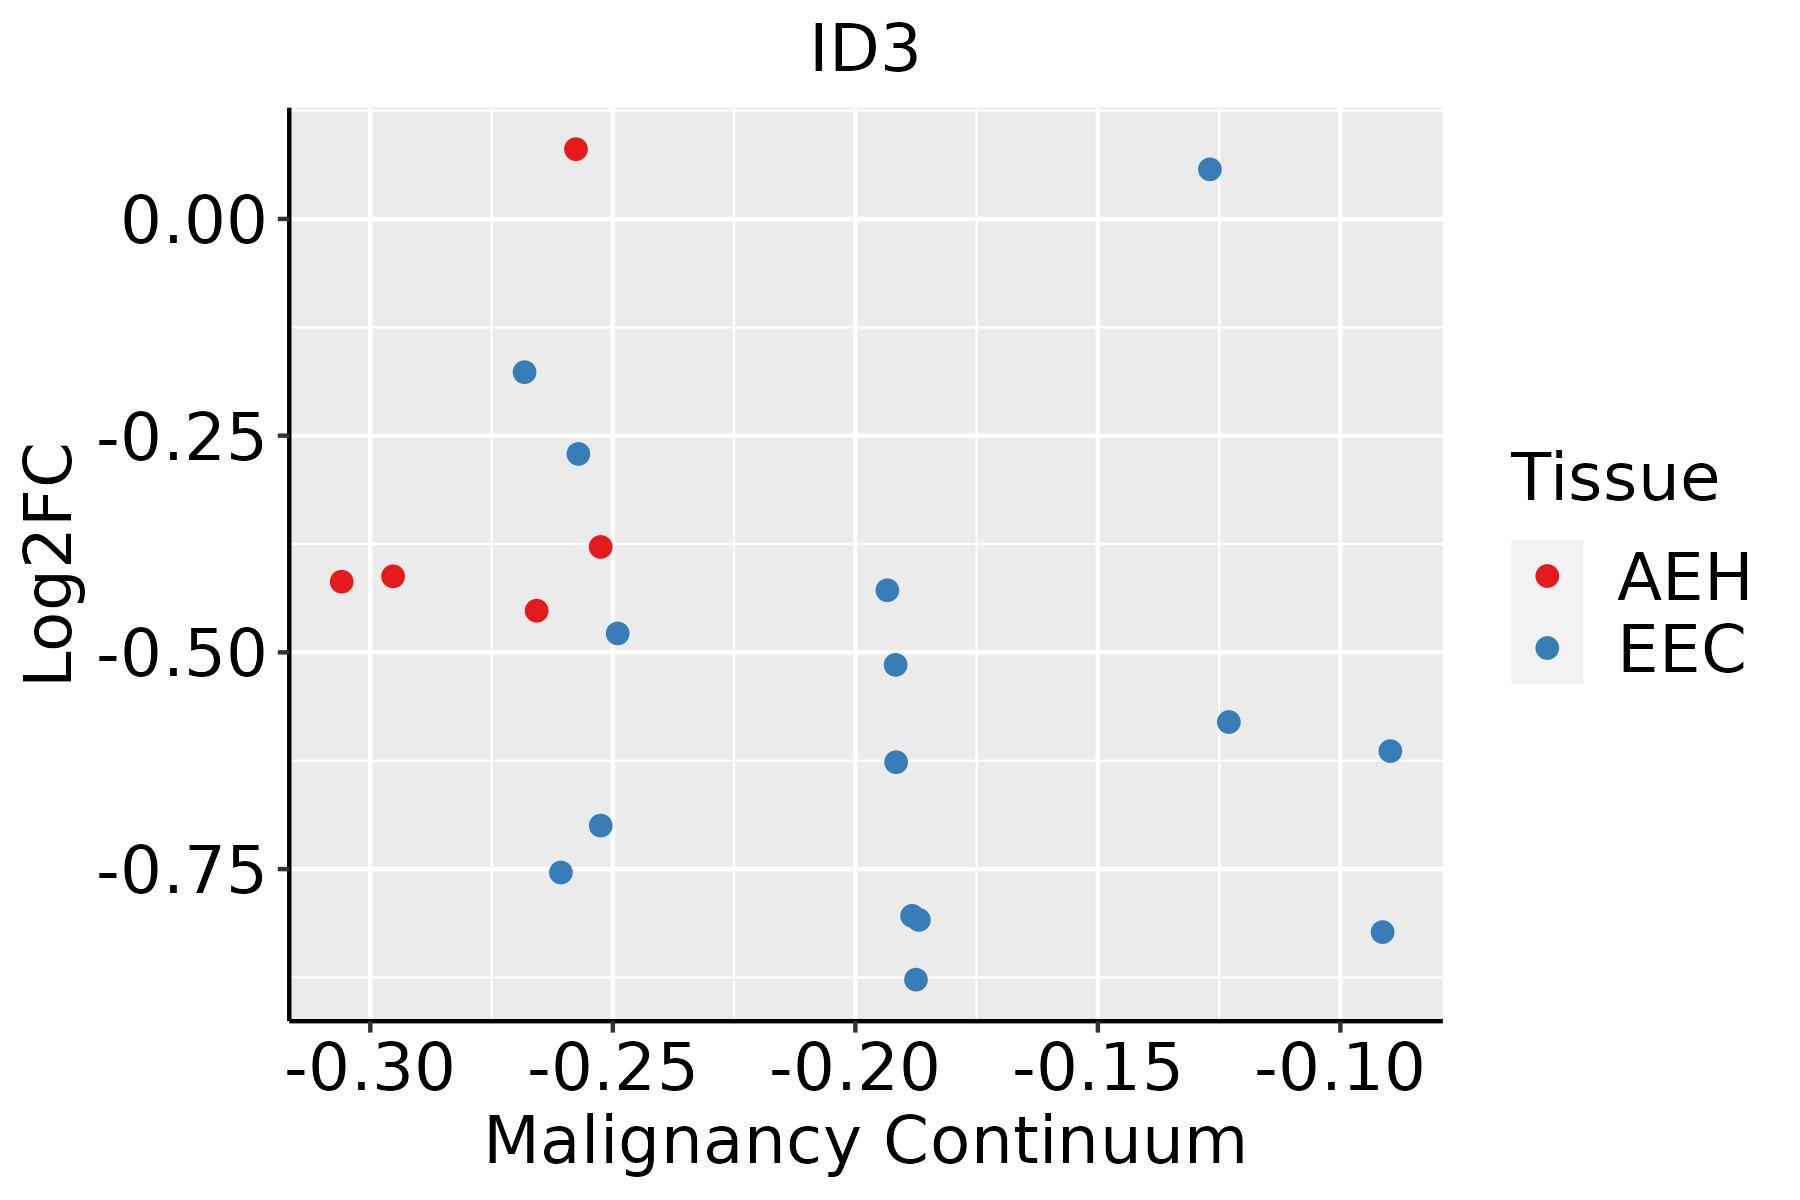 | AEH: Atypical endometrial hyperplasia |
| EEC: Endometrioid Cancer | ||
| Esophagus | 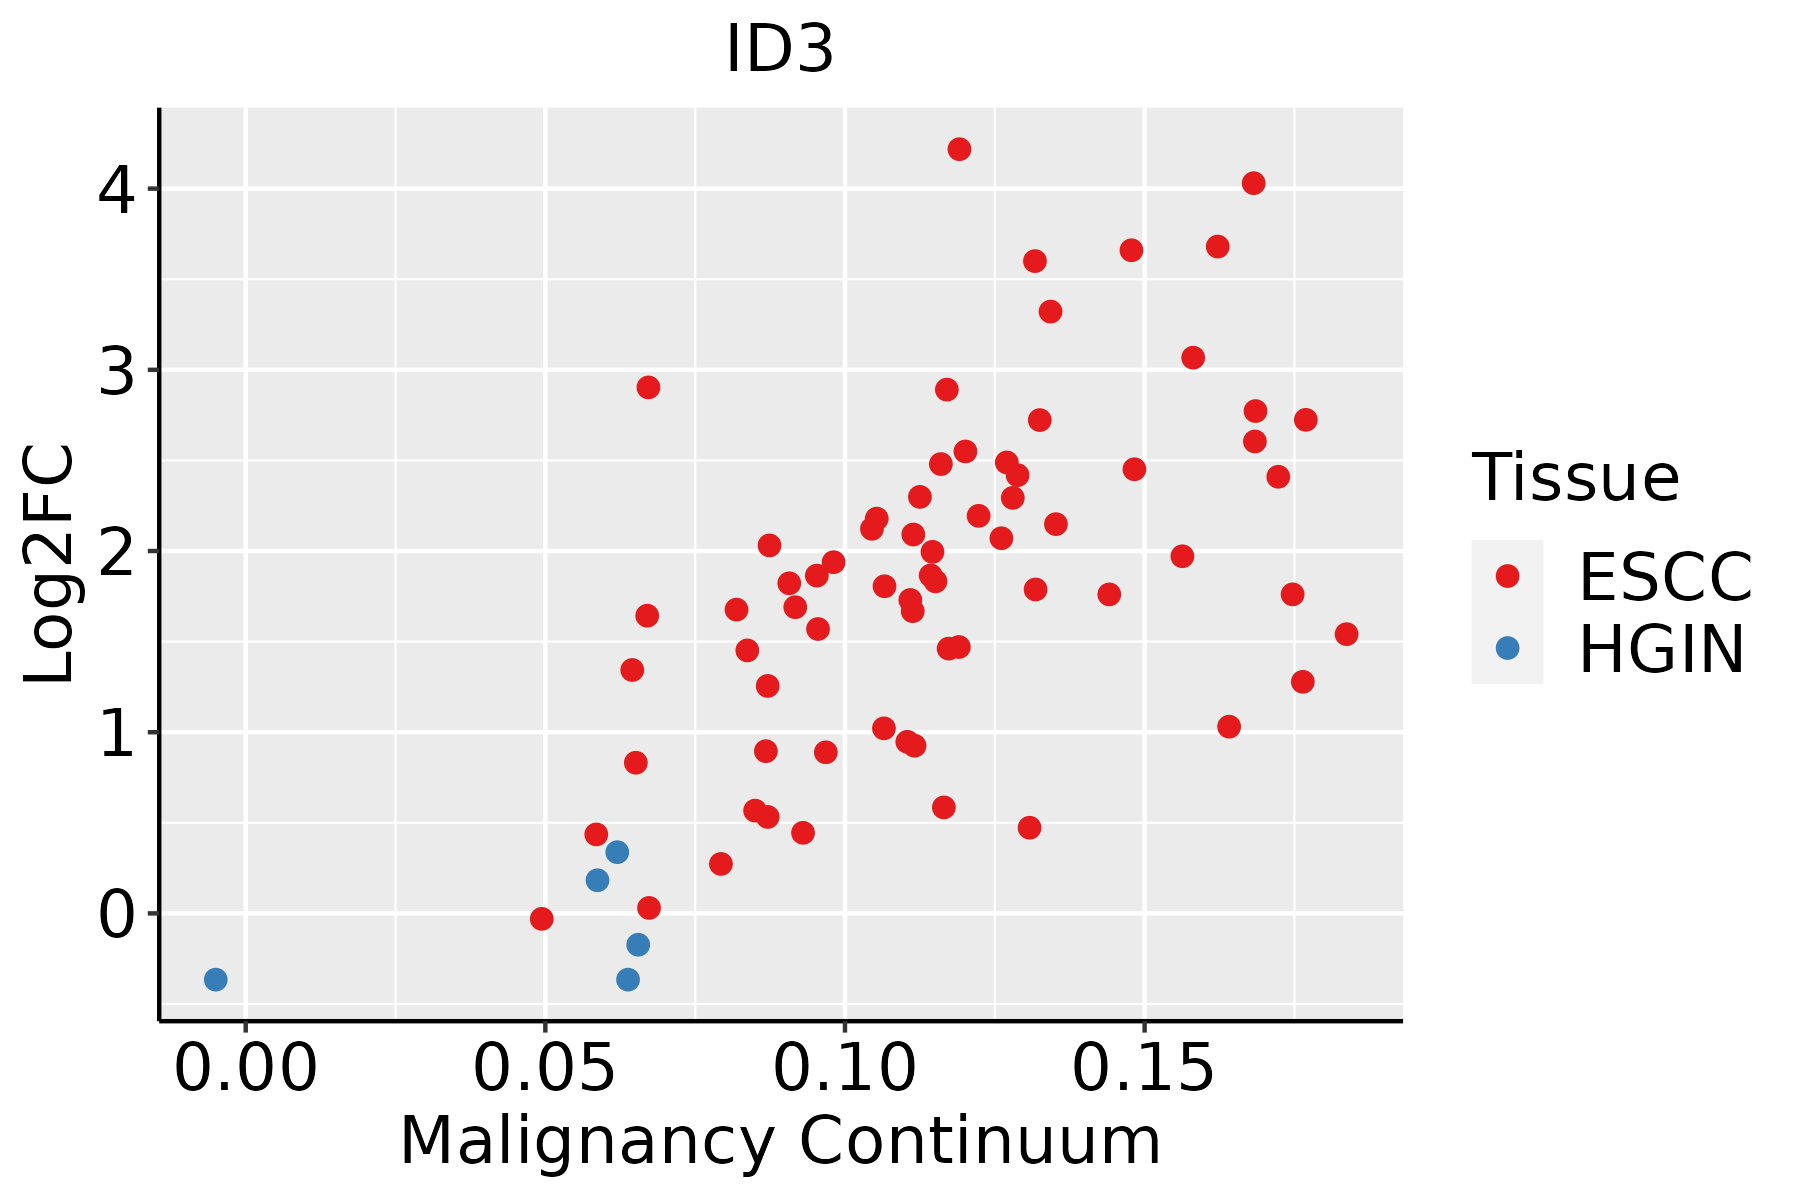 | ESCC: Esophageal squamous cell carcinoma |
| HGIN: High-grade intraepithelial neoplasias | ||
| LGIN: Low-grade intraepithelial neoplasias | ||
| GC |  | CAG: Chronic atrophic gastritis |
| CAG with IM: Chronic atrophic gastritis with intestinal metaplasia | ||
| CSG: Chronic superficial gastritis | ||
| GC: Gastric cancer | ||
| SIM: Severe intestinal metaplasia | ||
| WIM: Wild intestinal metaplasia | ||
| Liver | 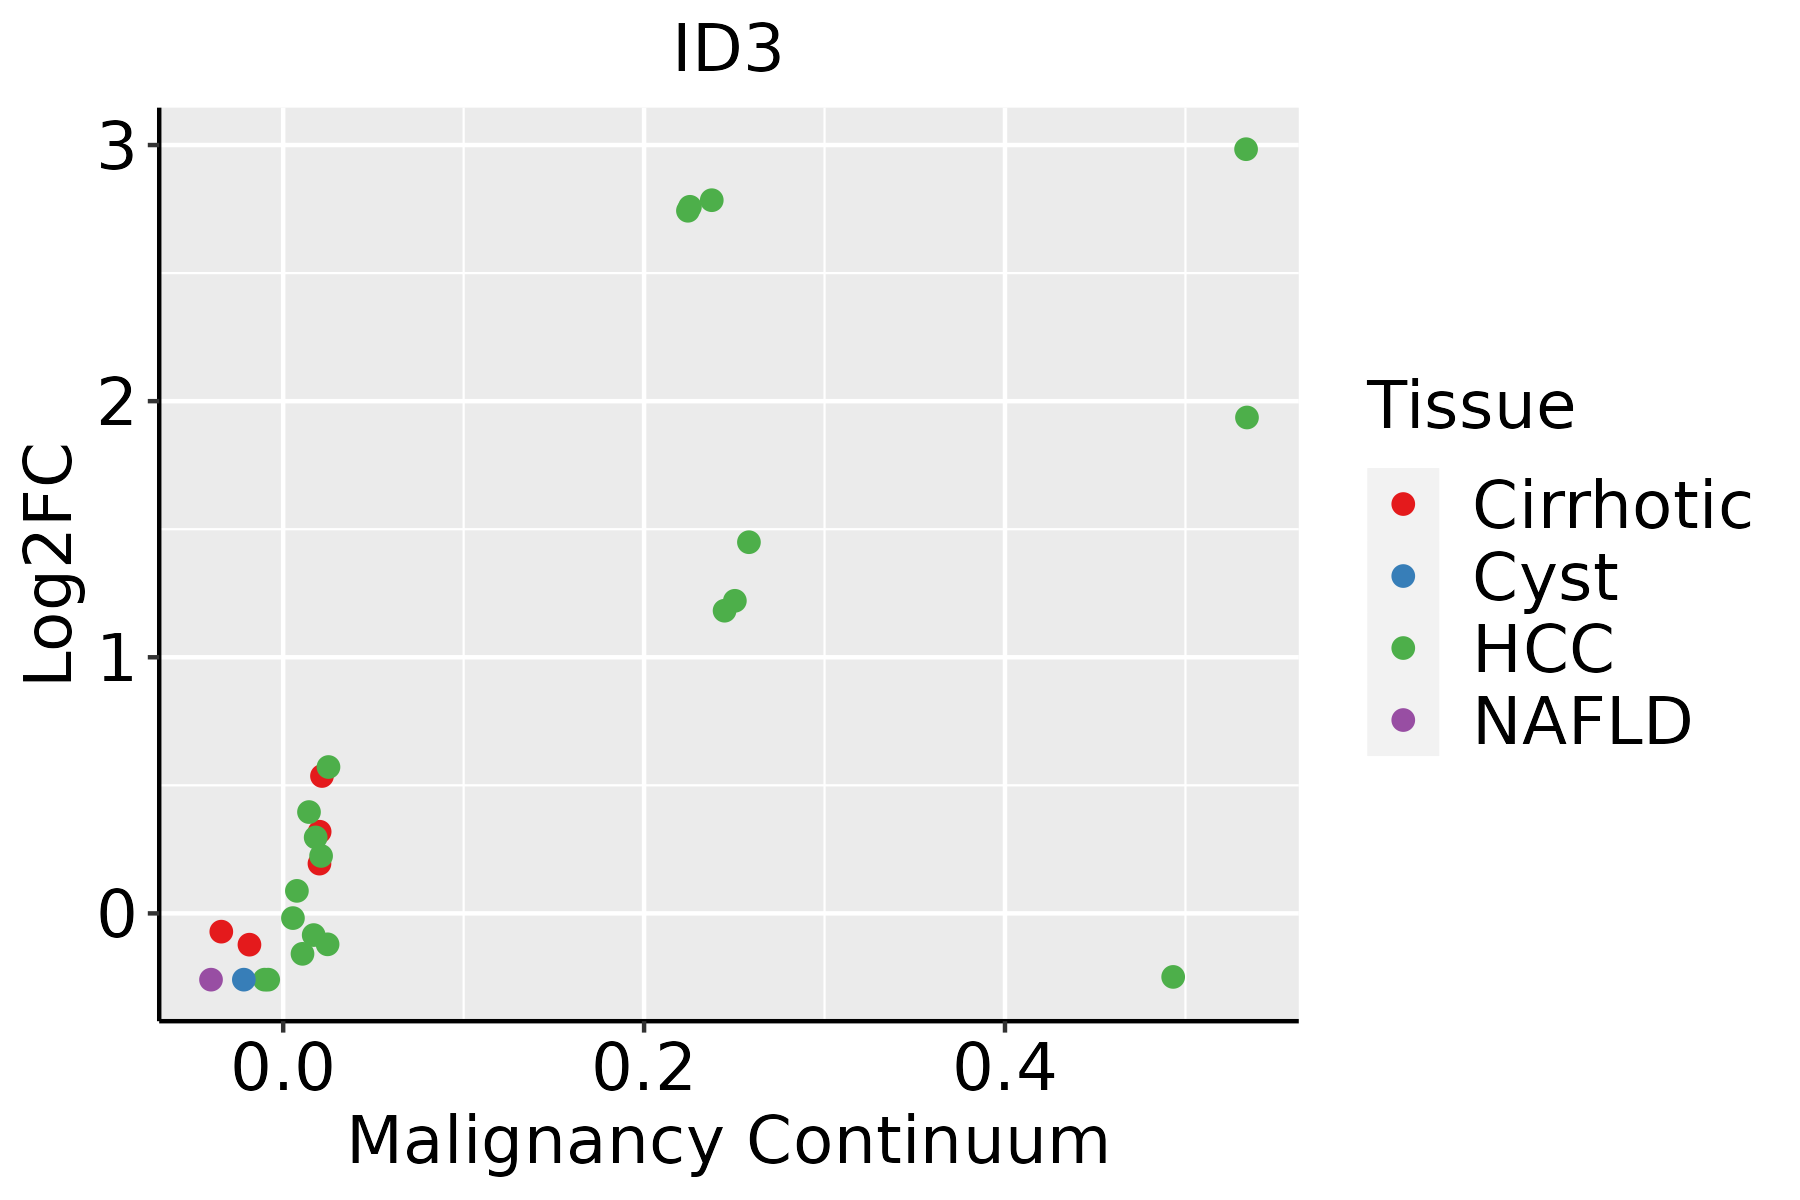 | HCC: Hepatocellular carcinoma |
| NAFLD: Non-alcoholic fatty liver disease | ||
| Oral Cavity | 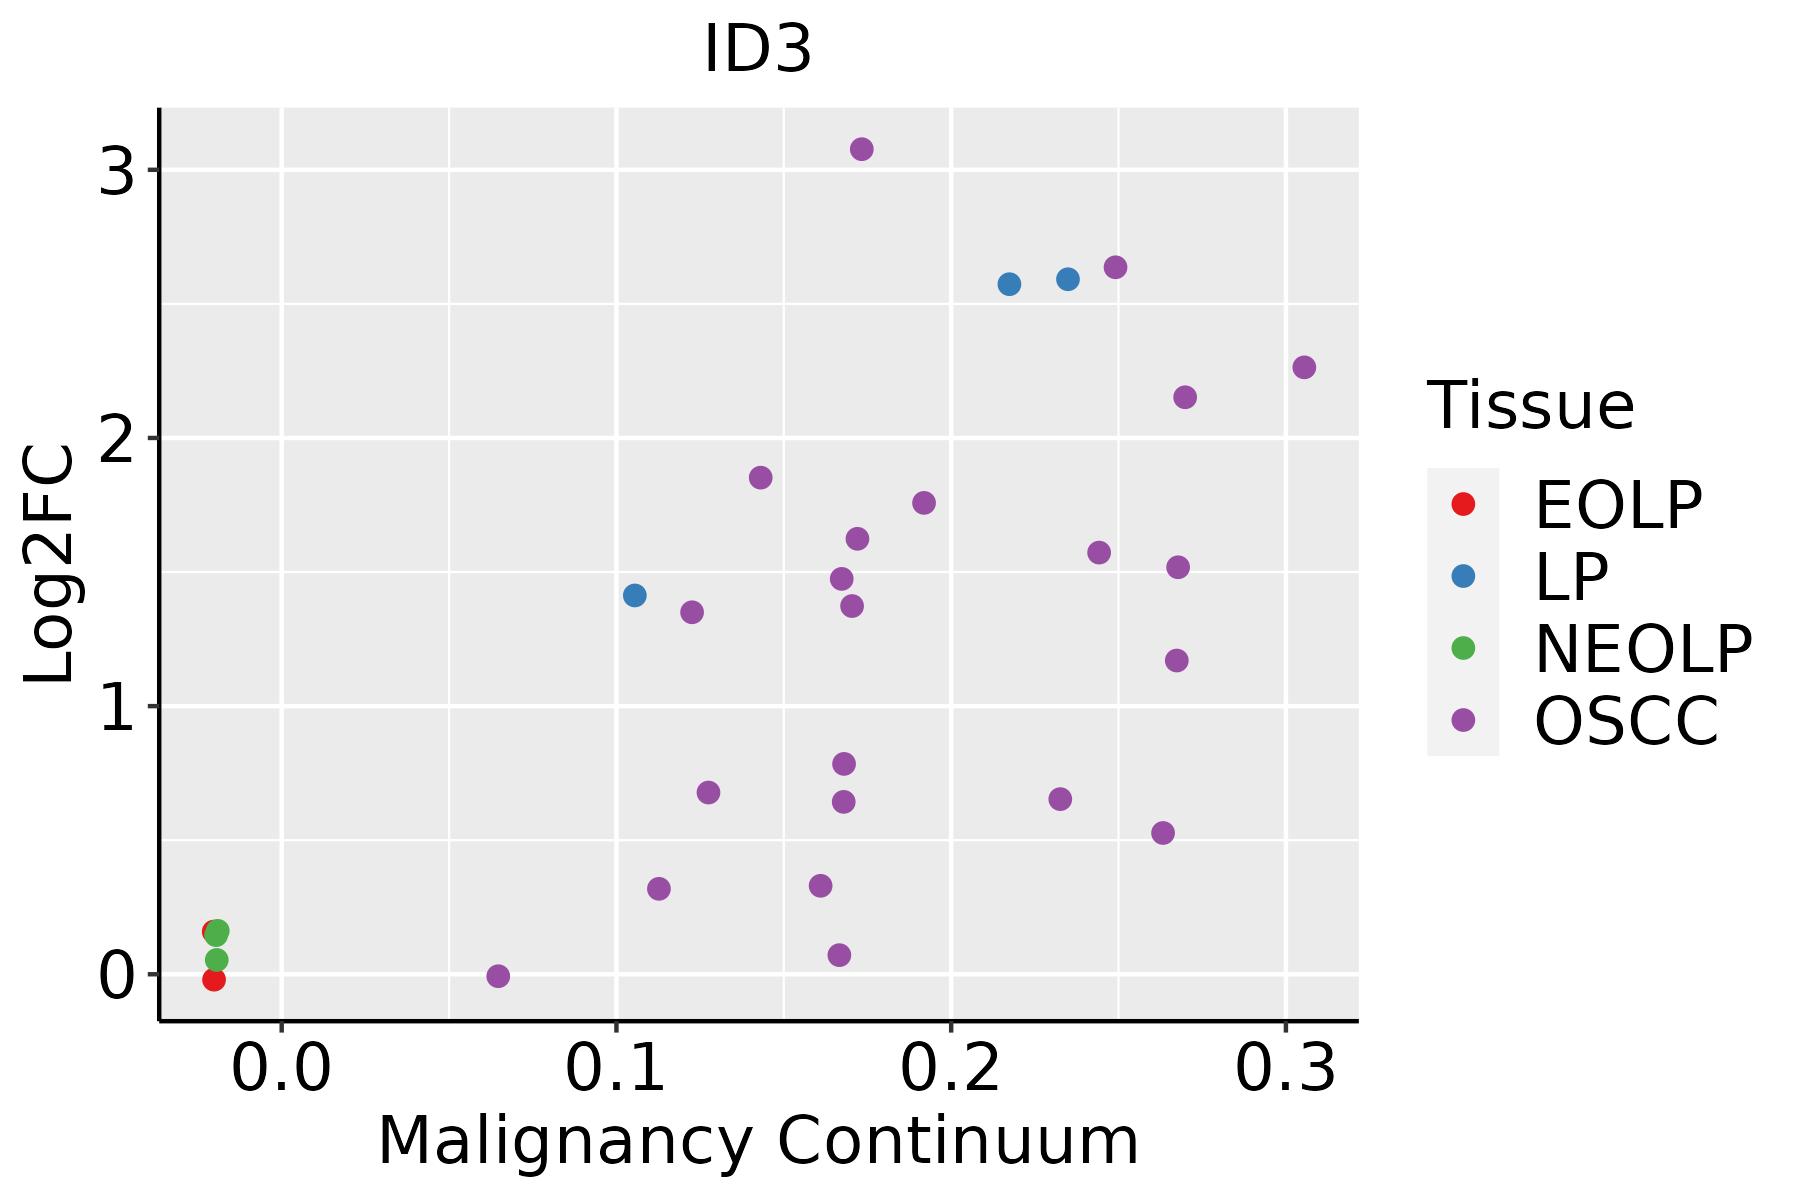 | EOLP: Erosive Oral lichen planus |
| LP: leukoplakia | ||
| NEOLP: Non-erosive oral lichen planus | ||
| OSCC: Oral squamous cell carcinoma | ||
| Prostate | 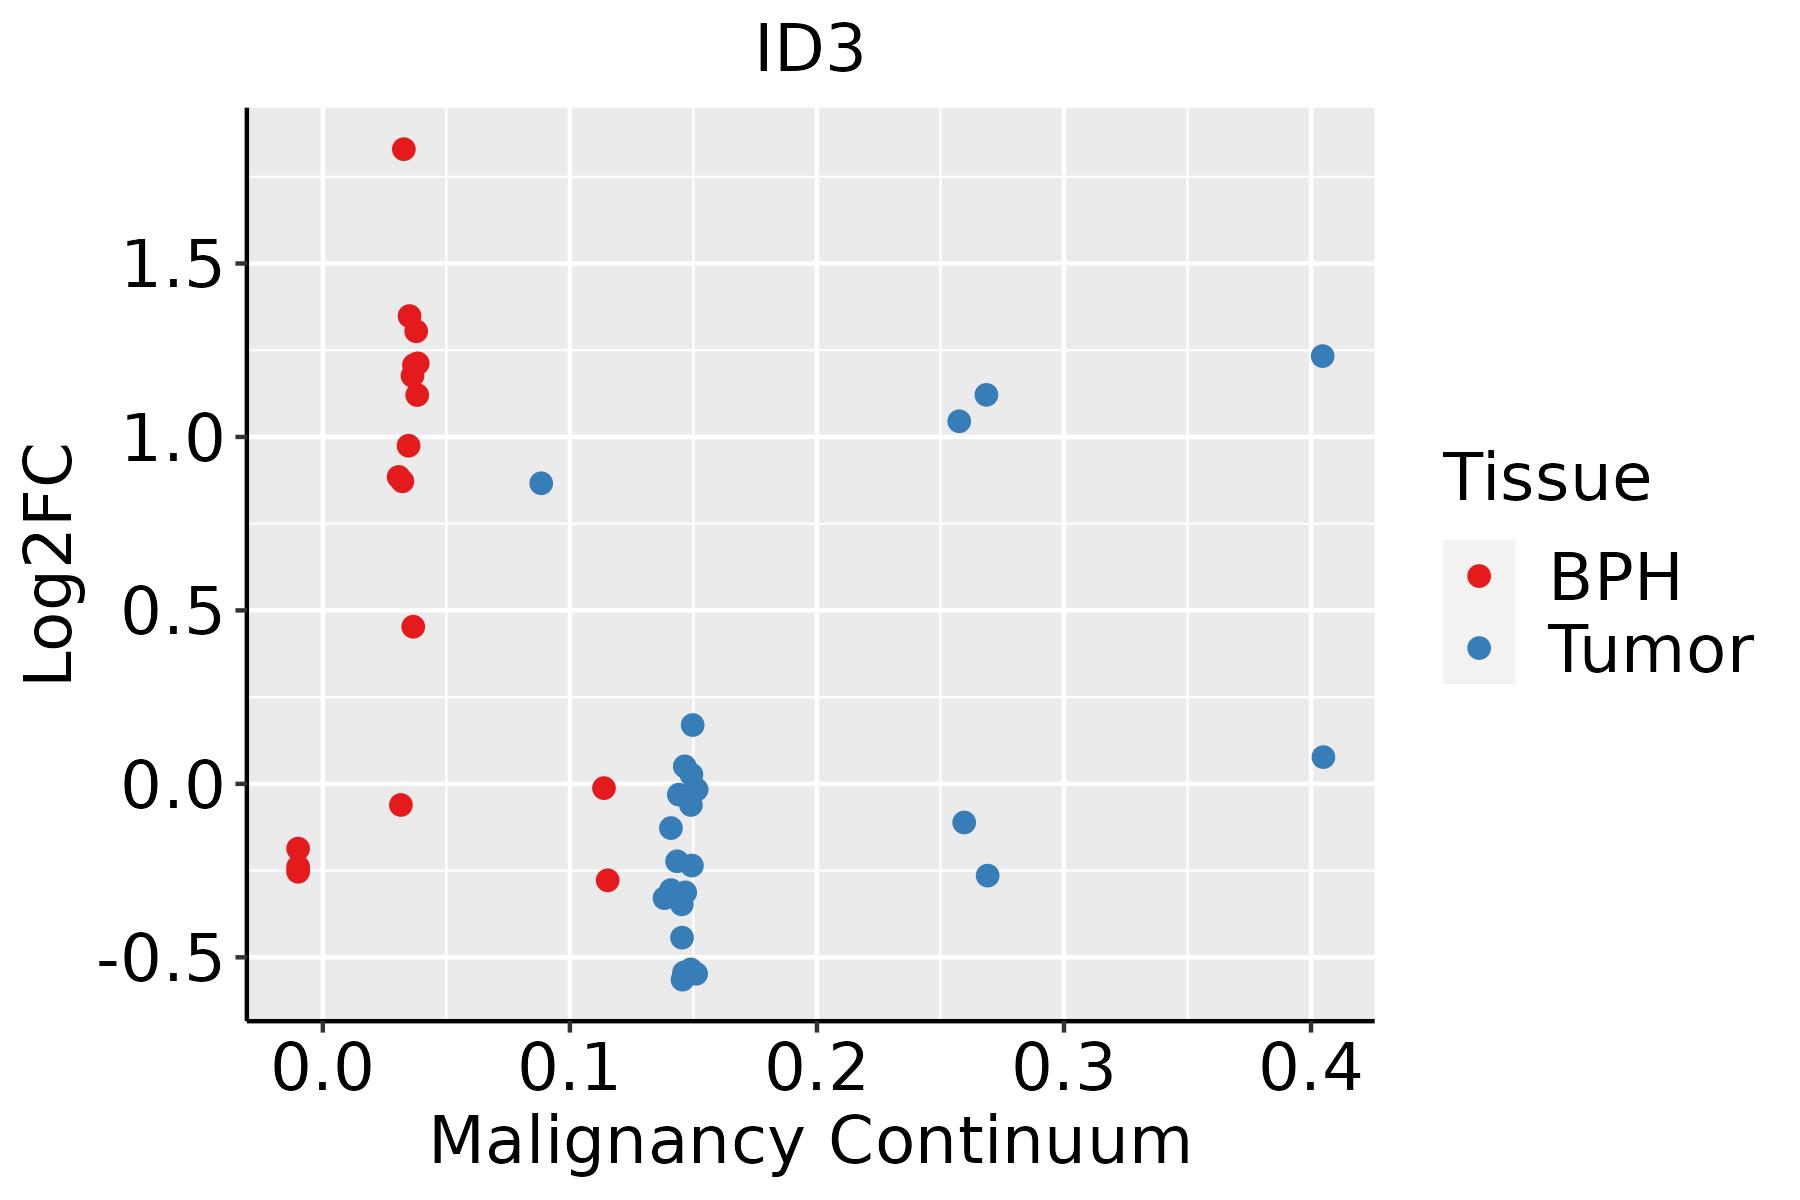 | BPH: Benign Prostatic Hyperplasia |
| Skin | 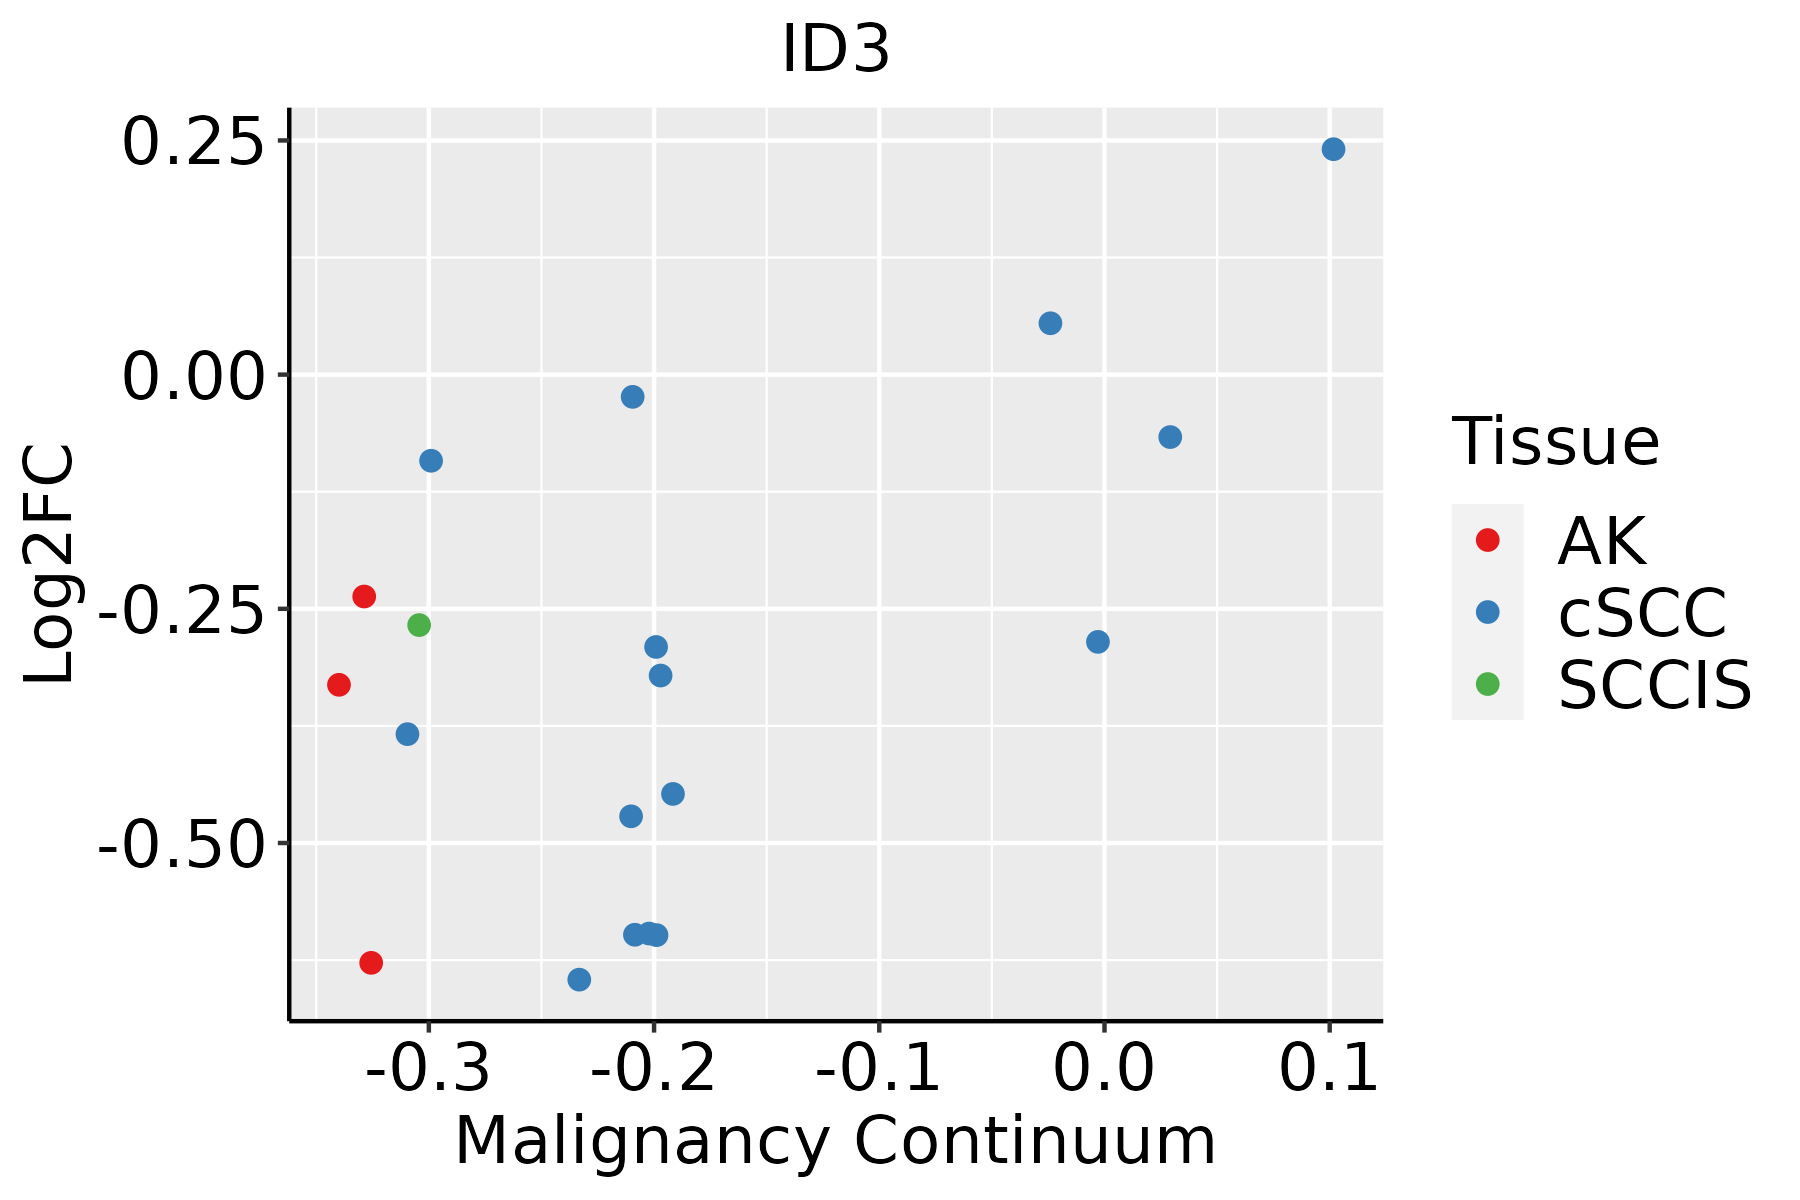 | AK: Actinic keratosis |
| cSCC: Cutaneous squamous cell carcinoma | ||
| SCCIS:squamous cell carcinoma in situ | ||
| Thyroid | 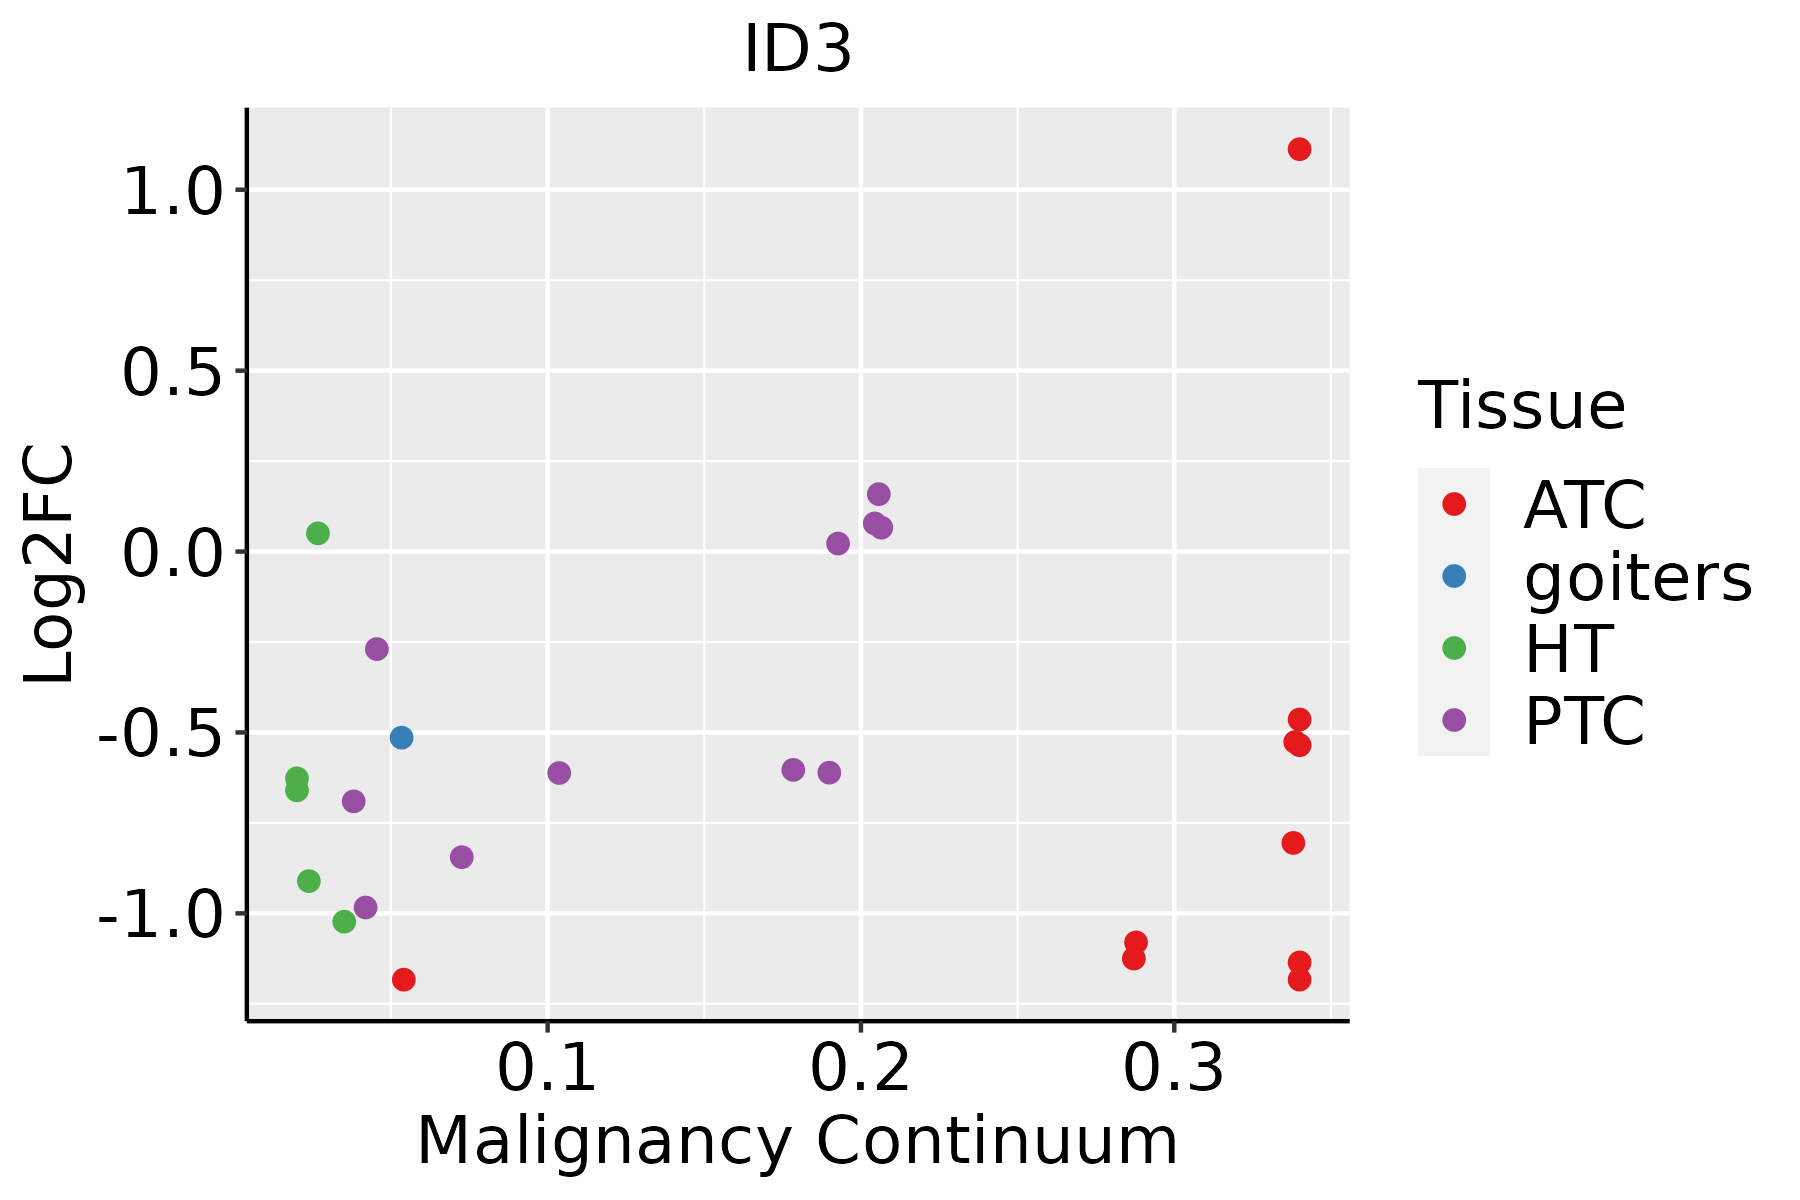 | ATC: Anaplastic thyroid cancer |
| HT: Hashimoto's thyroiditis | ||
| PTC: Papillary thyroid cancer |
| ∗log2FC in expression of this searched gene in stem-like cells from each diseased tissue sample relative to stem-like cells in normal samples in each tissue plotted against the malignancy continuum. Samples are colored based on if they are from different disease stage. |
Top |
Malignant transformation related pathway analysis |
| Find out the enriched GO biological processes and KEGG pathways involved in transition from healthy to precancer to cancer |
| Tissue | Disease Stage | Enriched GO biological Processes |
| Colorectum | AD |  |
| Colorectum | SER |  |
| Colorectum | MSS |  |
| Colorectum | MSI-H |  |
| Colorectum | FAP |  |
| ∗Top 15 enriched GO BP terms are showed in the bar plot of each disease state in each tissue. Each row represents a significant GO biological process which is colored according to the -log10(p.adjust). |
| Page: 1 2 3 4 5 6 7 8 9 |
| GO ID | Tissue | Disease Stage | Description | Gene Ratio | Bg Ratio | pvalue | p.adjust | Count |
| GO:00485118 | Cervix | CC | rhythmic process | 65/2311 | 298/18723 | 2.79e-06 | 8.04e-05 | 65 |
| GO:00510904 | Cervix | CC | regulation of DNA-binding transcription factor activity | 87/2311 | 440/18723 | 4.85e-06 | 1.22e-04 | 87 |
| GO:00076238 | Cervix | CC | circadian rhythm | 46/2311 | 210/18723 | 6.76e-05 | 9.60e-04 | 46 |
| GO:00016497 | Cervix | CC | osteoblast differentiation | 47/2311 | 229/18723 | 2.88e-04 | 3.11e-03 | 47 |
| GO:0045445 | Cervix | CC | myoblast differentiation | 21/2311 | 84/18723 | 1.08e-03 | 8.94e-03 | 21 |
| GO:00329226 | Cervix | CC | circadian regulation of gene expression | 18/2311 | 68/18723 | 1.18e-03 | 9.56e-03 | 18 |
| GO:0045667 | Cervix | CC | regulation of osteoblast differentiation | 29/2311 | 132/18723 | 1.32e-03 | 1.05e-02 | 29 |
| GO:00015037 | Cervix | CC | ossification | 71/2311 | 408/18723 | 1.67e-03 | 1.28e-02 | 71 |
| GO:00062602 | Cervix | CC | DNA replication | 48/2311 | 260/18723 | 2.70e-03 | 1.85e-02 | 48 |
| GO:00075173 | Cervix | CC | muscle organ development | 58/2311 | 327/18723 | 2.73e-03 | 1.85e-02 | 58 |
| GO:0007623 | Colorectum | AD | circadian rhythm | 72/3918 | 210/18723 | 4.50e-06 | 1.21e-04 | 72 |
| GO:0048511 | Colorectum | AD | rhythmic process | 94/3918 | 298/18723 | 1.00e-05 | 2.34e-04 | 94 |
| GO:0001649 | Colorectum | AD | osteoblast differentiation | 70/3918 | 229/18723 | 3.59e-04 | 4.18e-03 | 70 |
| GO:0010876 | Colorectum | AD | lipid localization | 120/3918 | 448/18723 | 1.59e-03 | 1.33e-02 | 120 |
| GO:0006869 | Colorectum | AD | lipid transport | 108/3918 | 398/18723 | 1.67e-03 | 1.39e-02 | 108 |
| GO:0048568 | Colorectum | AD | embryonic organ development | 112/3918 | 427/18723 | 4.60e-03 | 3.14e-02 | 112 |
| GO:0015748 | Colorectum | AD | organophosphate ester transport | 42/3918 | 140/18723 | 7.04e-03 | 4.31e-02 | 42 |
| GO:0001503 | Colorectum | AD | ossification | 106/3918 | 408/18723 | 7.68e-03 | 4.64e-02 | 106 |
| GO:00076231 | Colorectum | SER | circadian rhythm | 54/2897 | 210/18723 | 7.98e-05 | 1.77e-03 | 54 |
| GO:00016491 | Colorectum | SER | osteoblast differentiation | 56/2897 | 229/18723 | 2.49e-04 | 4.21e-03 | 56 |
| Page: 1 2 3 4 5 6 7 8 9 10 11 12 |
| Pathway ID | Tissue | Disease Stage | Description | Gene Ratio | Bg Ratio | pvalue | p.adjust | qvalue | Count |
| hsa04350 | Colorectum | SER | TGF-beta signaling pathway | 31/1580 | 108/8465 | 7.00e-03 | 3.77e-02 | 2.74e-02 | 31 |
| hsa043501 | Colorectum | SER | TGF-beta signaling pathway | 31/1580 | 108/8465 | 7.00e-03 | 3.77e-02 | 2.74e-02 | 31 |
| hsa043504 | Endometrium | AEH | TGF-beta signaling pathway | 26/1197 | 108/8465 | 3.82e-03 | 2.18e-02 | 1.59e-02 | 26 |
| hsa0435011 | Endometrium | AEH | TGF-beta signaling pathway | 26/1197 | 108/8465 | 3.82e-03 | 2.18e-02 | 1.59e-02 | 26 |
| hsa043502 | Endometrium | EEC | TGF-beta signaling pathway | 26/1237 | 108/8465 | 5.95e-03 | 3.12e-02 | 2.33e-02 | 26 |
| hsa043503 | Endometrium | EEC | TGF-beta signaling pathway | 26/1237 | 108/8465 | 5.95e-03 | 3.12e-02 | 2.33e-02 | 26 |
| hsa043507 | Esophagus | ESCC | TGF-beta signaling pathway | 69/4205 | 108/8465 | 1.92e-03 | 5.54e-03 | 2.84e-03 | 69 |
| hsa0435014 | Esophagus | ESCC | TGF-beta signaling pathway | 69/4205 | 108/8465 | 1.92e-03 | 5.54e-03 | 2.84e-03 | 69 |
| hsa043506 | Oral cavity | OSCC | TGF-beta signaling pathway | 60/3704 | 108/8465 | 8.66e-03 | 1.97e-02 | 1.00e-02 | 60 |
| hsa0435013 | Oral cavity | OSCC | TGF-beta signaling pathway | 60/3704 | 108/8465 | 8.66e-03 | 1.97e-02 | 1.00e-02 | 60 |
| hsa0435021 | Prostate | Tumor | TGF-beta signaling pathway | 39/1791 | 108/8465 | 2.33e-04 | 1.35e-03 | 8.39e-04 | 39 |
| hsa0435031 | Prostate | Tumor | TGF-beta signaling pathway | 39/1791 | 108/8465 | 2.33e-04 | 1.35e-03 | 8.39e-04 | 39 |
| Page: 1 |
Top |
Cell-cell communication analysis |
| Identification of potential cell-cell interactions between two cell types and their ligand-receptor pairs for different disease states |
| Ligand | Receptor | LRpair | Pathway | Tissue | Disease Stage |
| Page: 1 |
Top |
Single-cell gene regulatory network inference analysis |
| Find out the significant the regulons (TFs) and the target genes of each regulon across cell types for different disease states |
| TF | Cell Type | Tissue | Disease Stage | Target Gene | RSS | Regulon Activity |
| ∗The dot plots of a searched regulon are shown for all cell subpopulations in each disease state of each tissue based on the regulon specific score inferred using pySCENIC and by calculating the average expression. |
| Page: 1 |
Top |
Somatic mutation of malignant transformation related genes |
| Annotation of somatic variants for genes involved in malignant transformation |
| Hugo Symbol | Variant Class | Variant Classification | dbSNP RS | HGVSc | HGVSp | HGVSp Short | SWISSPROT | BIOTYPE | SIFT | PolyPhen | Tumor Sample Barcode | Tissue | Histology | Sex | Age | Stage | Therapy Types | Drugs | Outcome |
| ID3 | SNV | Missense_Mutation | novel | c.290N>C | p.Leu97Pro | p.L97P | Q02535 | protein_coding | deleterious(0.03) | benign(0.003) | TCGA-AA-3811-01 | Colorectum | colon adenocarcinoma | Female | >=65 | III/IV | Unknown | Unknown | PD |
| ID3 | SNV | Missense_Mutation | rs201368186 | c.73N>A | p.Ala25Thr | p.A25T | Q02535 | protein_coding | deleterious(0.05) | possibly_damaging(0.51) | TCGA-AP-A1DK-01 | Endometrium | uterine corpus endometrioid carcinoma | Female | <65 | I/II | Unknown | Unknown | SD |
| ID3 | SNV | Missense_Mutation | novel | c.328N>G | p.Ile110Val | p.I110V | Q02535 | protein_coding | tolerated(0.77) | benign(0) | TCGA-EY-A215-01 | Endometrium | uterine corpus endometrioid carcinoma | Female | <65 | I/II | Unknown | Unknown | SD |
| ID3 | SNV | Missense_Mutation | rs777214087 | c.38C>T | p.Ala13Val | p.A13V | Q02535 | protein_coding | tolerated(0.29) | possibly_damaging(0.57) | TCGA-FI-A2D5-01 | Endometrium | uterine corpus endometrioid carcinoma | Female | <65 | III/IV | Chemotherapy | carboplatinum | PD |
| ID3 | SNV | Missense_Mutation | novel | c.97N>T | p.Ala33Ser | p.A33S | Q02535 | protein_coding | tolerated(0.56) | benign(0.05) | TCGA-55-8621-01 | Lung | lung adenocarcinoma | Female | >=65 | I/II | Unknown | Unknown | SD |
| ID3 | SNV | Missense_Mutation | c.316C>T | p.Pro106Ser | p.P106S | Q02535 | protein_coding | tolerated(1) | benign(0) | TCGA-55-A4DF-01 | Lung | lung adenocarcinoma | Male | >=65 | I/II | Unknown | Unknown | PD | |
| ID3 | SNV | Missense_Mutation | novel | c.211N>A | p.Gln71Lys | p.Q71K | Q02535 | protein_coding | deleterious(0) | probably_damaging(0.999) | TCGA-37-3792-01 | Lung | lung squamous cell carcinoma | Male | >=65 | I/II | Unknown | Unknown | SD |
| ID3 | SNV | Missense_Mutation | novel | c.338A>T | p.Asp113Val | p.D113V | Q02535 | protein_coding | deleterious(0) | benign(0.155) | TCGA-98-A53A-01 | Lung | lung squamous cell carcinoma | Male | >=65 | I/II | Unknown | Unknown | SD |
| ID3 | SNV | Missense_Mutation | c.284C>A | p.Pro95His | p.P95H | Q02535 | protein_coding | tolerated(0.34) | benign(0.068) | TCGA-HJ-7597-01 | Stomach | stomach adenocarcinoma | Female | >=65 | I/II | Chemotherapy | fluorouracil | CR |
| Page: 1 |
Top |
Related drugs of malignant transformation related genes |
| Identification of chemicals and drugs interact with genes involved in malignant transfromation |
| (DGIdb 4.0) |
| Entrez ID | Symbol | Category | Interaction Types | Drug Claim Name | Drug Name | PMIDs |
| Page: 1 |

Copyright 2023-Present -The University of Texas Health Science Center at Houston |