| Entrez ID | Symbol | Replicates | Species | Organ | Tissue | Adj P-value | Log2FC | Malignancy |
| 50809 | HP1BP3 | SYSMH5 | Human | Oral cavity | OSCC | 2.55e-06 | 3.88e-01 | 0.0647 |
| 50809 | HP1BP3 | SYSMH6 | Human | Oral cavity | OSCC | 3.66e-10 | 5.27e-01 | 0.1275 |
| 50809 | HP1BP3 | GSM5252132_BPH389PrGF | Human | Prostate | BPH | 3.56e-06 | 7.26e-01 | -0.2247 |
| 50809 | HP1BP3 | GSM5252136_BPH556PrGA1_Fcol | Human | Prostate | BPH | 1.05e-02 | 4.13e-01 | -0.23 |
| 50809 | HP1BP3 | GSM5252137_BPH556PrGA2_Fcol | Human | Prostate | BPH | 1.73e-05 | 5.53e-01 | -0.23 |
| 50809 | HP1BP3 | 047563_1562-all-cells | Human | Prostate | BPH | 3.85e-17 | -9.53e-03 | 0.0791 |
| 50809 | HP1BP3 | 048752_1579-all-cells | Human | Prostate | BPH | 4.94e-02 | 2.25e-01 | 0.1008 |
| 50809 | HP1BP3 | Dong_P1 | Human | Prostate | Tumor | 2.01e-20 | 1.26e-01 | 0.035 |
| 50809 | HP1BP3 | Dong_P3 | Human | Prostate | Tumor | 2.96e-12 | 9.17e-02 | 0.0278 |
| 50809 | HP1BP3 | Dong_P4 | Human | Prostate | Tumor | 2.71e-05 | 1.78e-01 | 0.0292 |
| 50809 | HP1BP3 | Dong_P5 | Human | Prostate | Tumor | 1.90e-20 | -1.68e-01 | 0.053 |
| 50809 | HP1BP3 | P10 | Human | Prostate | Tumor | 1.77e-05 | 6.62e-01 | -0.0902 |
| 50809 | HP1BP3 | GSM5353216_PA_PB1A_Pool_1_3_S50_L002 | Human | Prostate | Tumor | 5.73e-06 | 5.17e-01 | 0.159 |
| 50809 | HP1BP3 | GSM5353217_PA_PB1A_Pool_2_S107_L004 | Human | Prostate | Tumor | 3.64e-04 | 5.11e-01 | 0.156 |
| 50809 | HP1BP3 | GSM5353221_PA_PB2A_Pool_1_3_S25_L001 | Human | Prostate | Tumor | 8.32e-11 | 5.40e-01 | 0.1633 |
| 50809 | HP1BP3 | GSM5353222_PA_PB2B_Pool_1_3_S52_L002 | Human | Prostate | Tumor | 3.16e-12 | 5.09e-01 | 0.1608 |
| 50809 | HP1BP3 | GSM5353223_PA_PB2B_Pool_2_S26_L001 | Human | Prostate | Tumor | 9.93e-04 | 4.22e-01 | 0.1604 |
| 50809 | HP1BP3 | GSM5353224_PA_PR5186_Pool_1_2_3_S27_L001 | Human | Prostate | Tumor | 1.99e-06 | 5.81e-01 | 0.1621 |
| 50809 | HP1BP3 | GSM5353225_PA_PR5196-1_Pool_1_2_3_S53_L002 | Human | Prostate | Tumor | 9.46e-04 | 5.09e-01 | 0.1619 |
| 50809 | HP1BP3 | GSM5353227_PA_PR5199-193K_Pool_1_2_3_S55_L002 | Human | Prostate | Tumor | 1.36e-06 | 2.89e-01 | 0.1602 |
| Tissue | Expression Dynamics | Abbreviation |
| Breast |  | IDC: Invasive ductal carcinoma |
| DCIS: Ductal carcinoma in situ |
| Precancer(BRCA1-mut): Precancerous lesion from BRCA1 mutation carriers |
| Colorectum (GSE201348) |  | FAP: Familial adenomatous polyposis |
| CRC: Colorectal cancer |
| Colorectum (HTA11) | 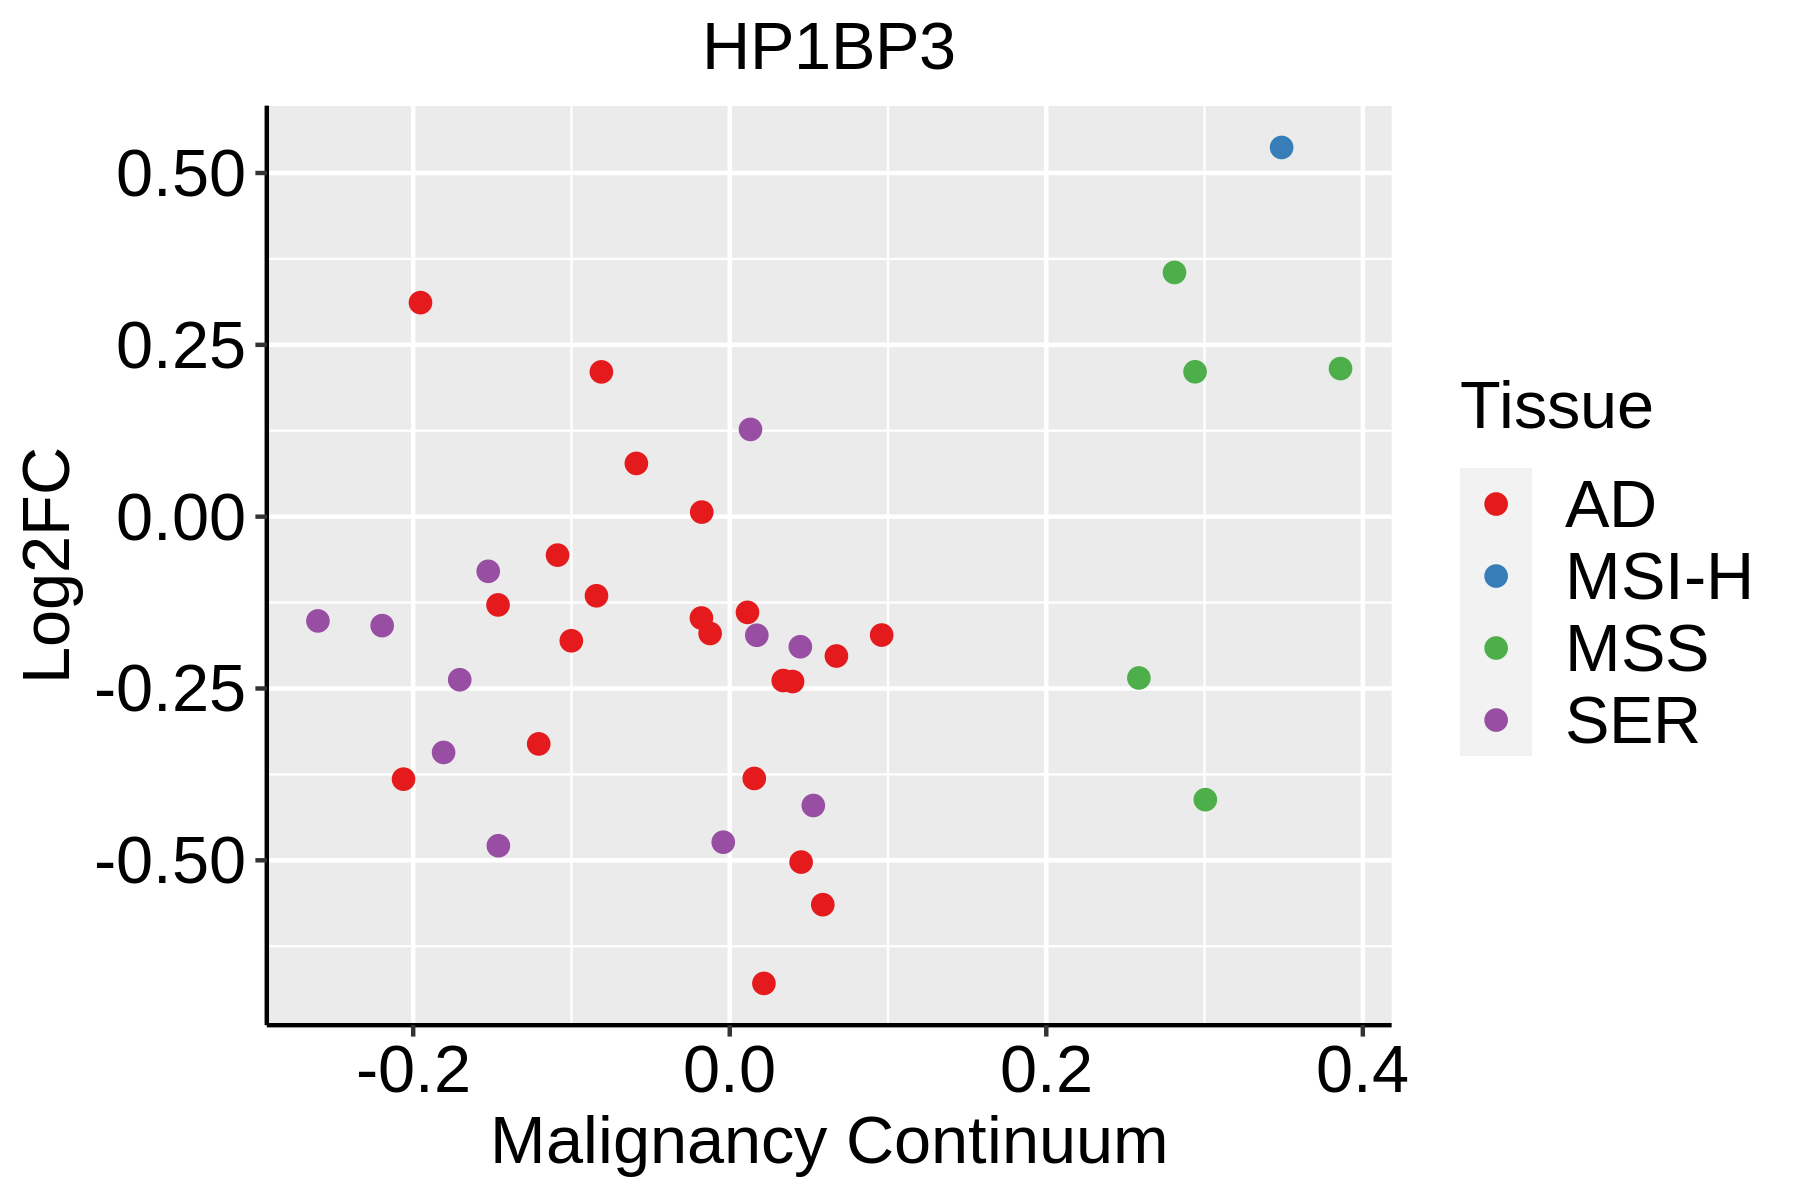 | AD: Adenomas |
| SER: Sessile serrated lesions |
| MSI-H: Microsatellite-high colorectal cancer |
| MSS: Microsatellite stable colorectal cancer |
| Esophagus | 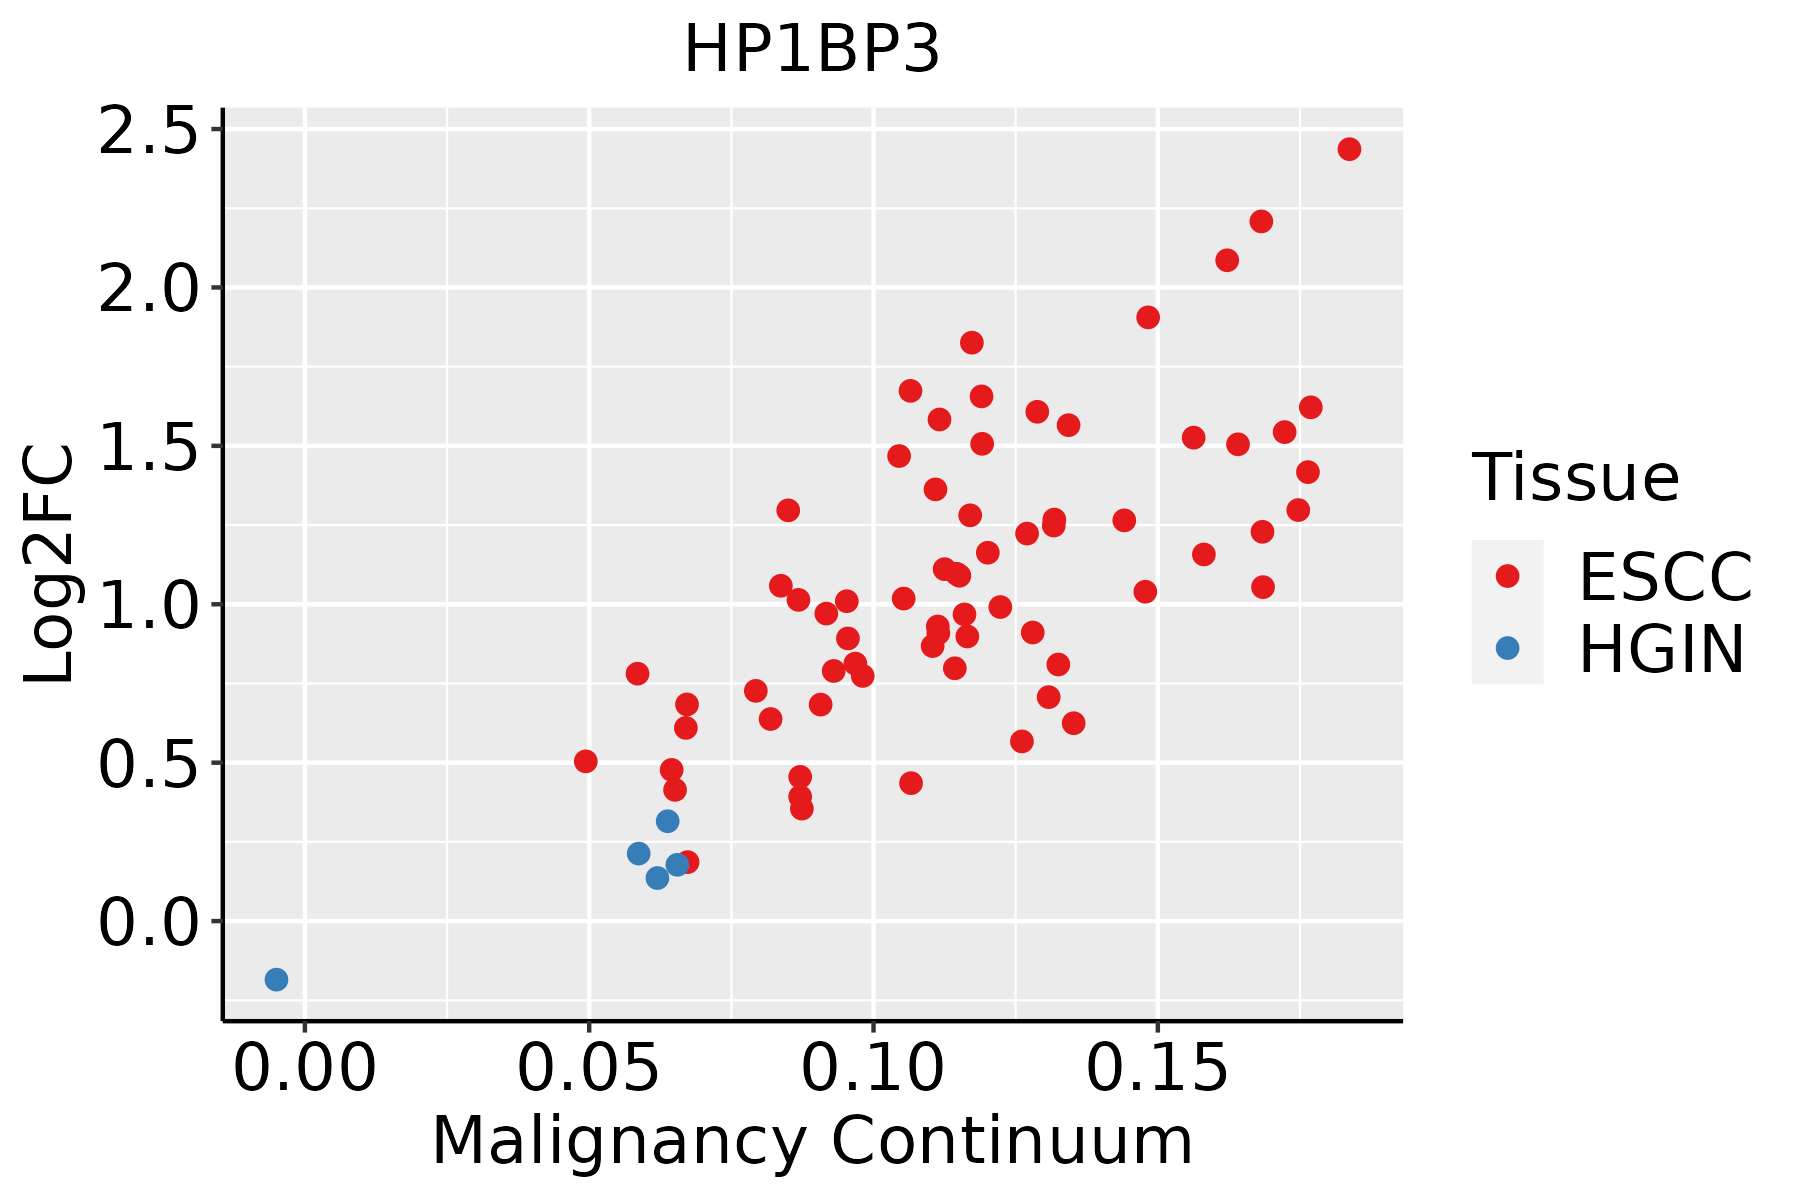 | ESCC: Esophageal squamous cell carcinoma |
| HGIN: High-grade intraepithelial neoplasias |
| LGIN: Low-grade intraepithelial neoplasias |
| Liver | 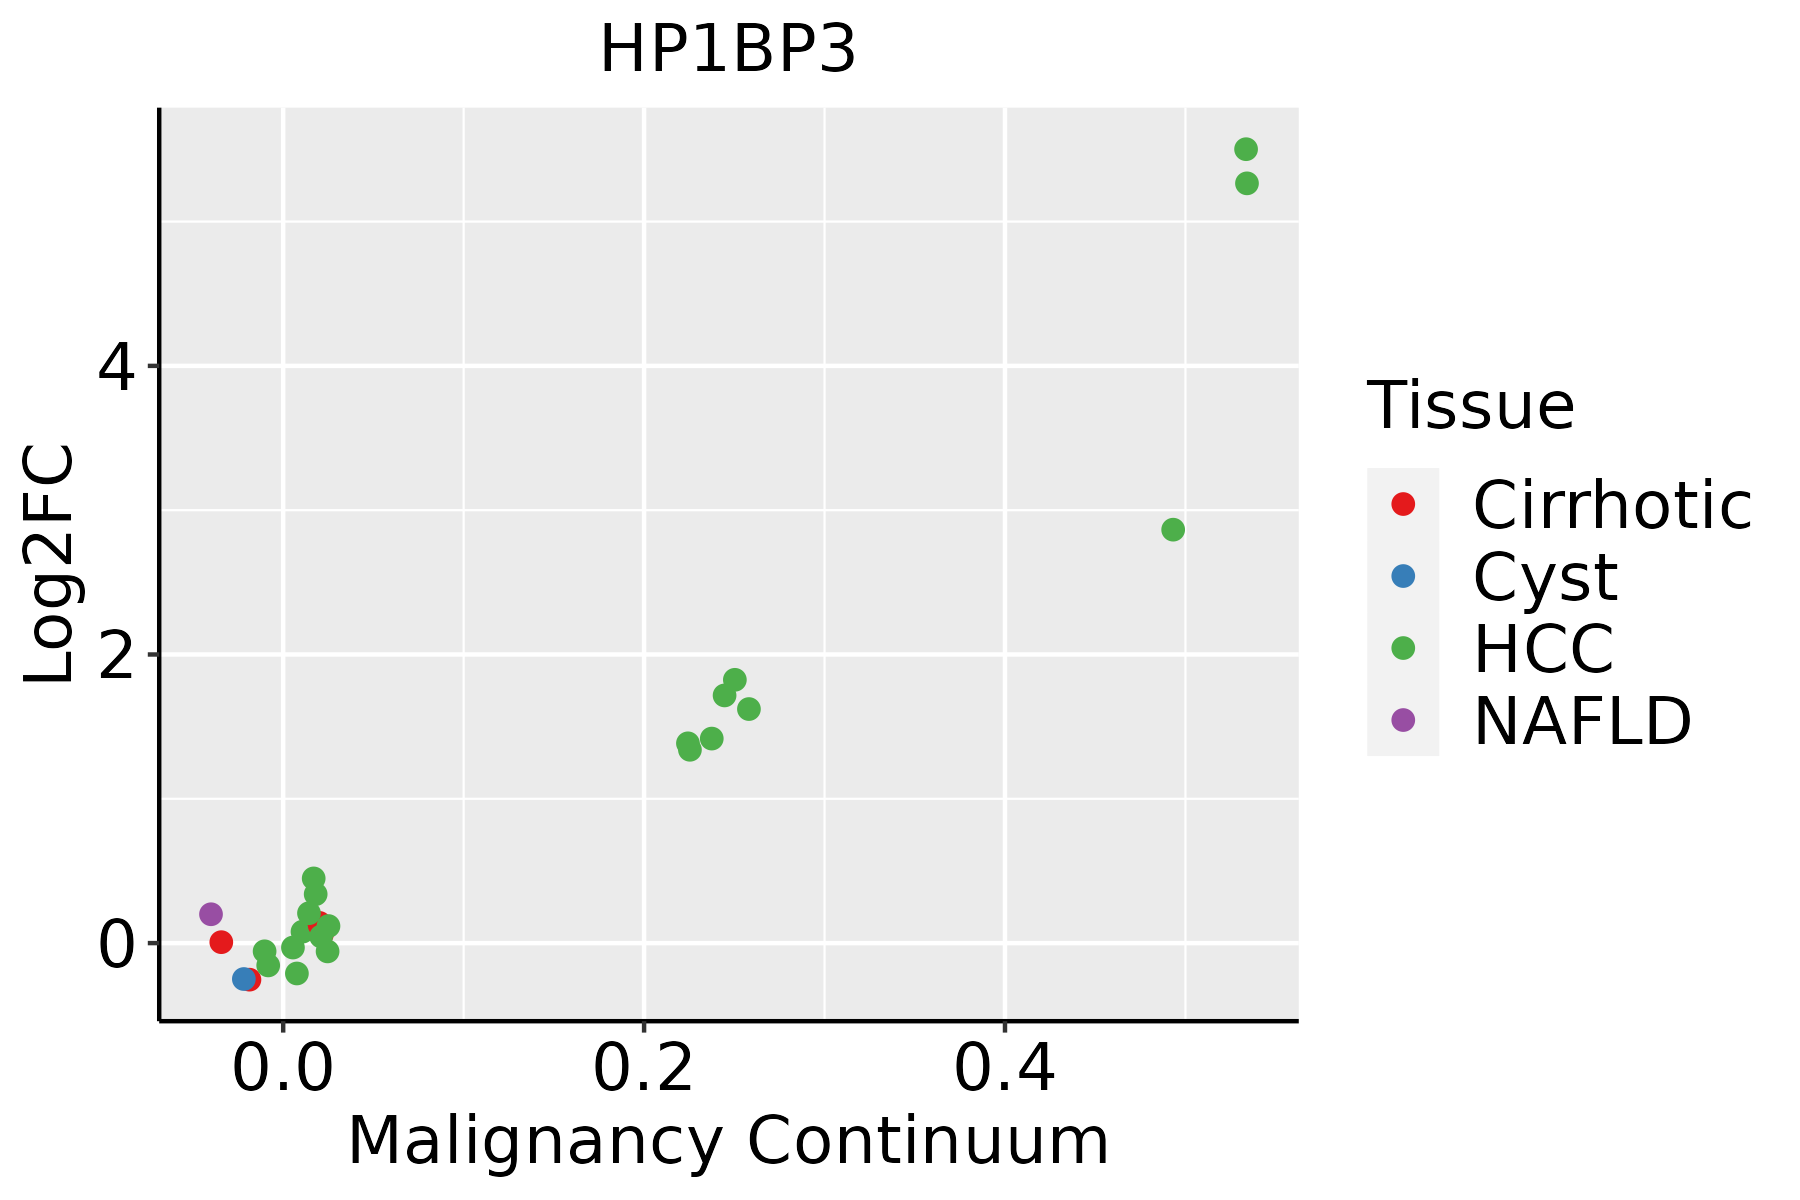 | HCC: Hepatocellular carcinoma |
| NAFLD: Non-alcoholic fatty liver disease |
| Oral Cavity | 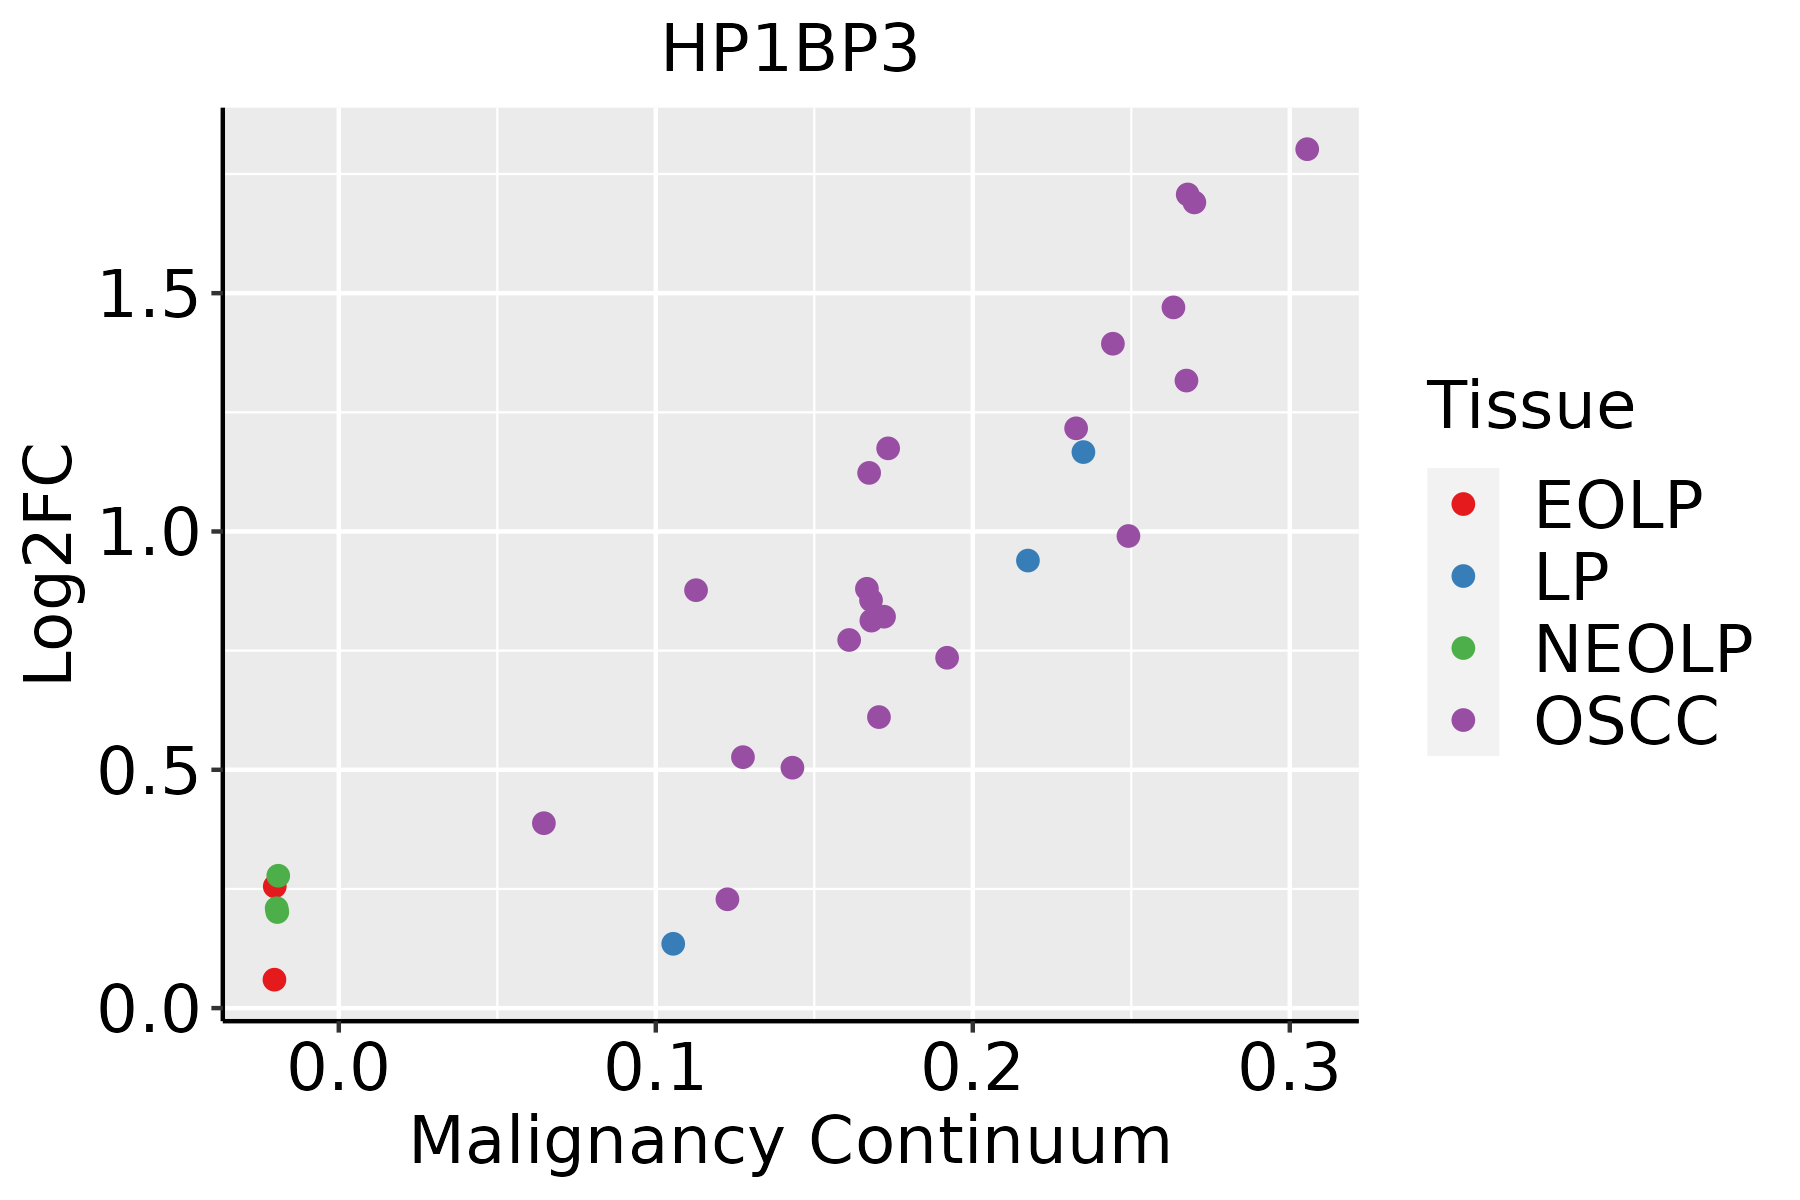 | EOLP: Erosive Oral lichen planus |
| LP: leukoplakia |
| NEOLP: Non-erosive oral lichen planus |
| OSCC: Oral squamous cell carcinoma |
| Prostate | 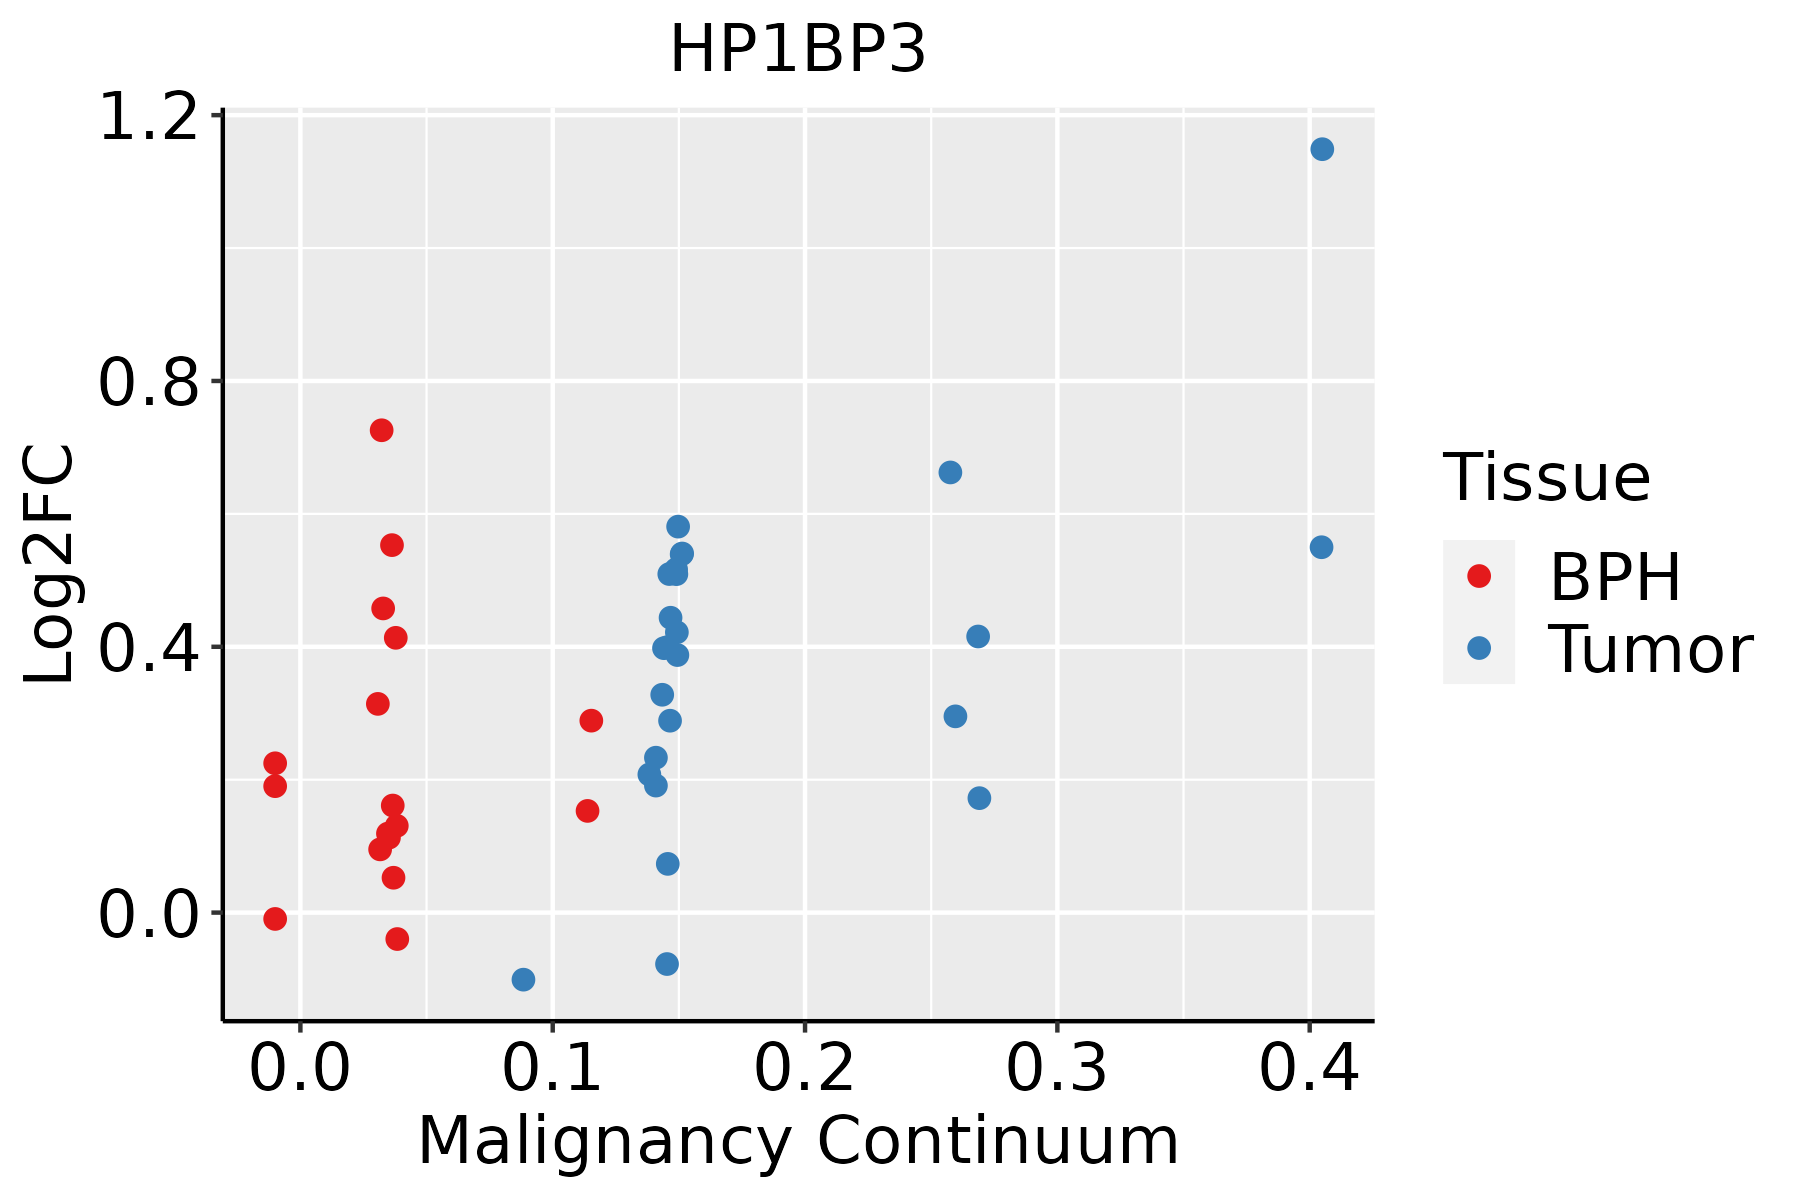 | BPH: Benign Prostatic Hyperplasia |
| Skin | 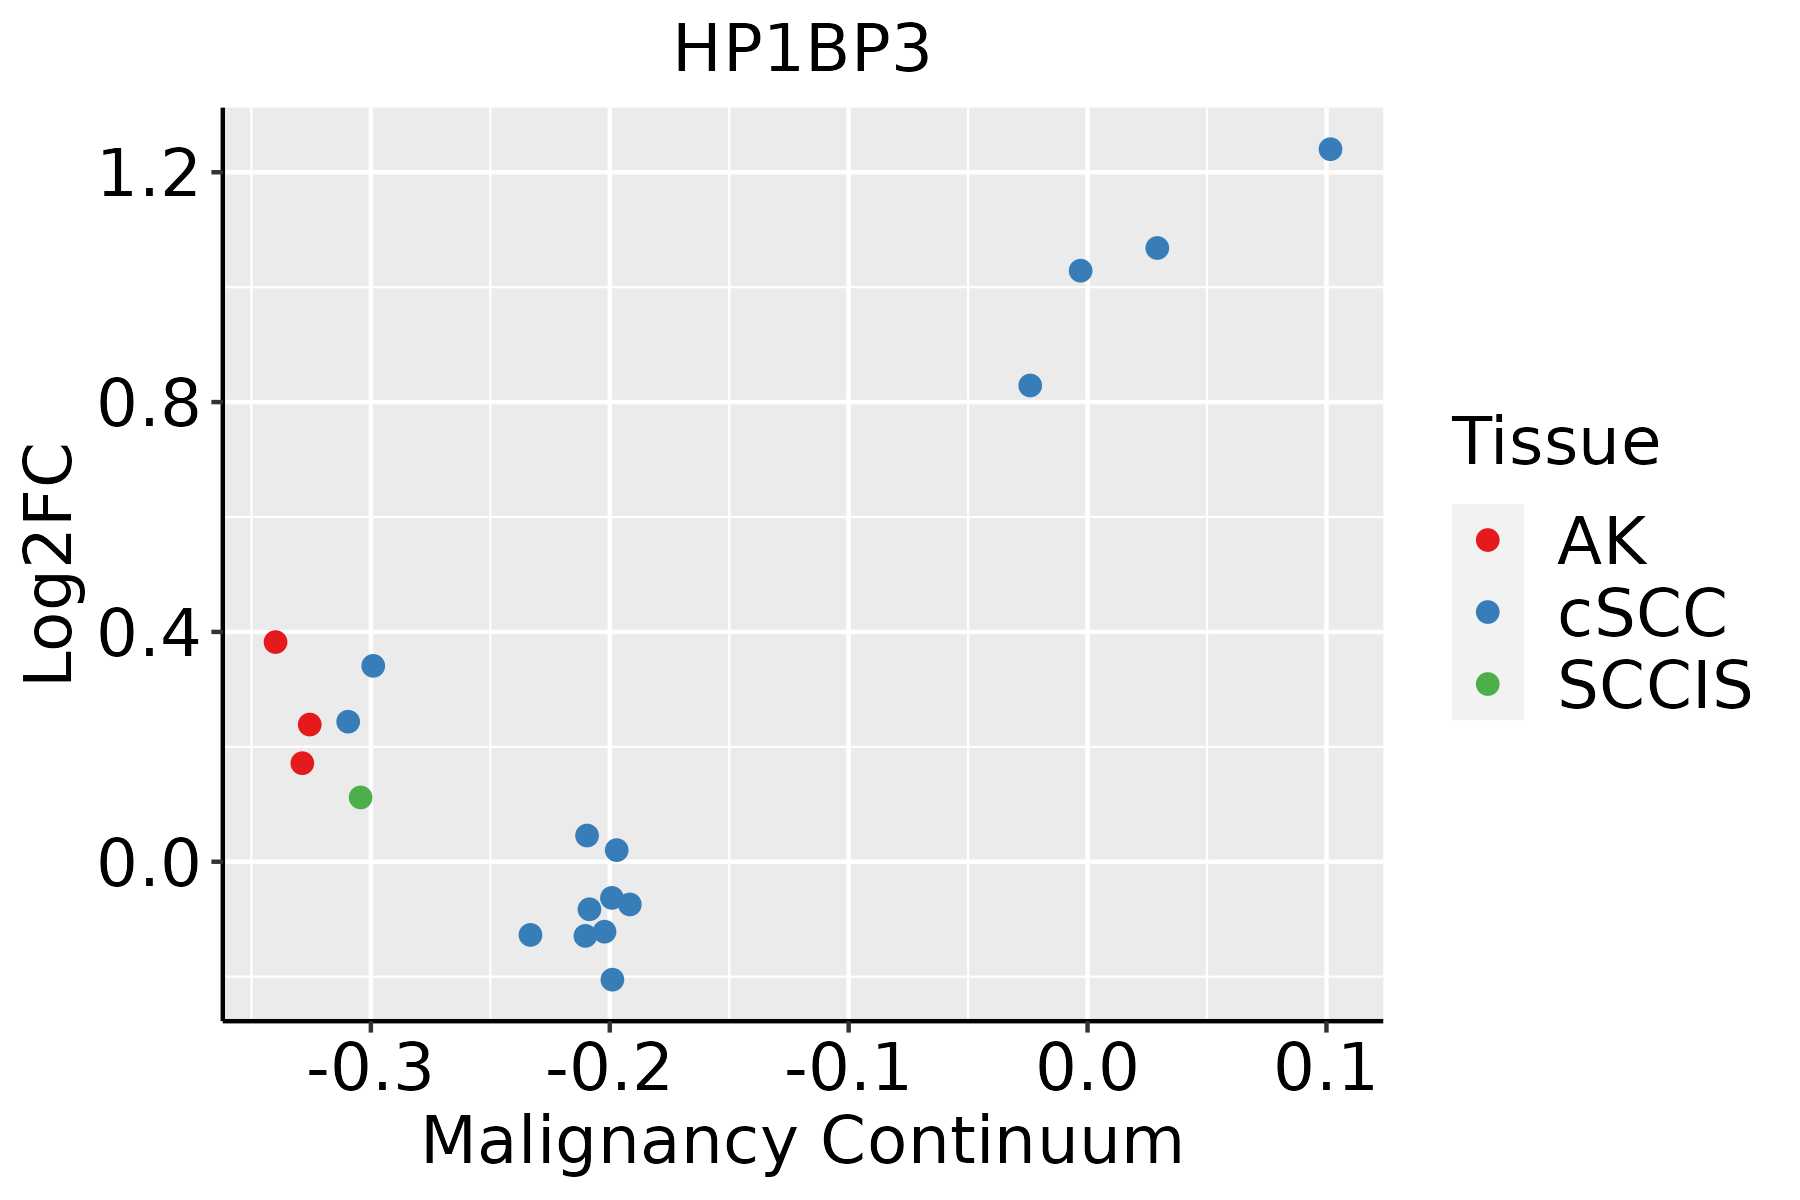 | AK: Actinic keratosis |
| cSCC: Cutaneous squamous cell carcinoma |
| SCCIS:squamous cell carcinoma in situ |
| Thyroid | 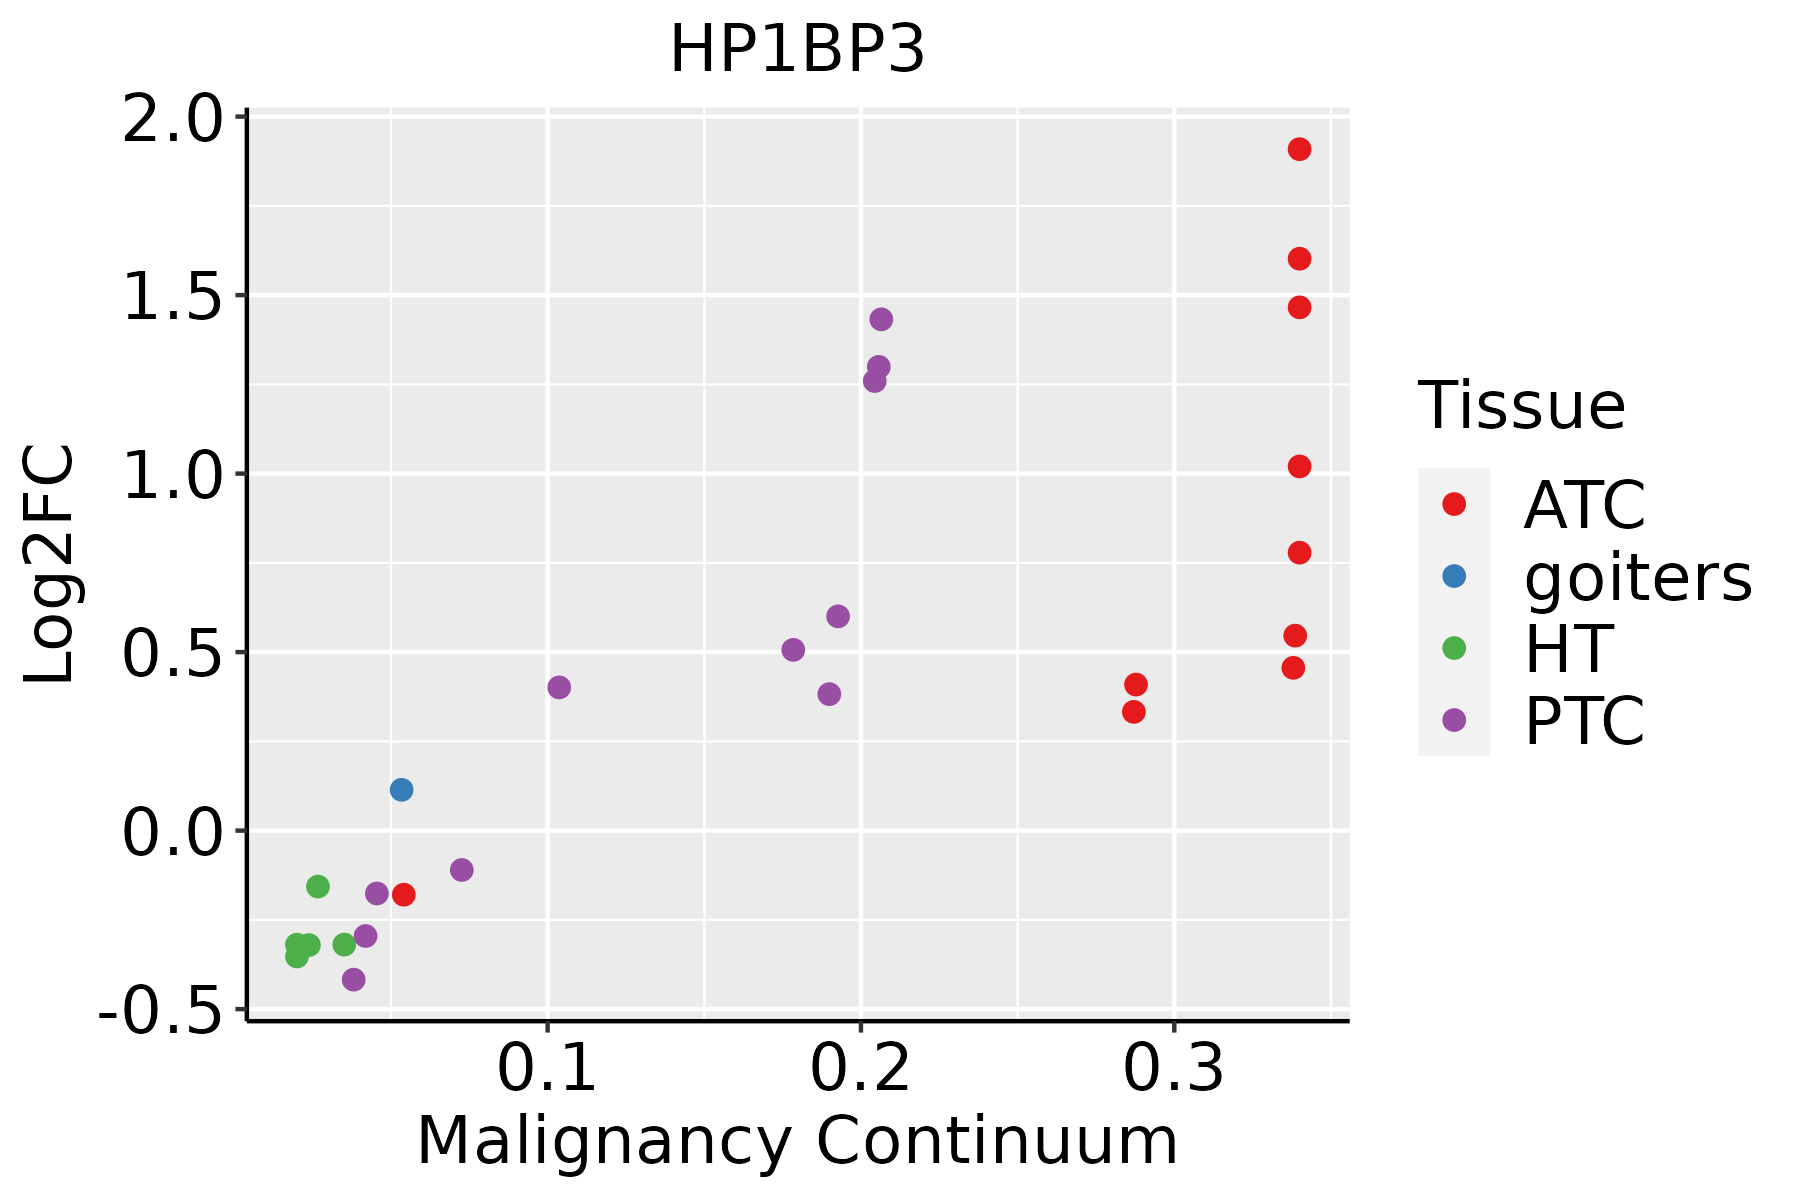 | ATC: Anaplastic thyroid cancer |
| HT: Hashimoto's thyroiditis |
| PTC: Papillary thyroid cancer |
| GO ID | Tissue | Disease Stage | Description | Gene Ratio | Bg Ratio | pvalue | p.adjust | Count |
| GO:00362939 | Breast | Precancer | response to decreased oxygen levels | 53/1080 | 322/18723 | 4.09e-12 | 6.84e-10 | 53 |
| GO:00016669 | Breast | Precancer | response to hypoxia | 51/1080 | 307/18723 | 7.33e-12 | 1.11e-09 | 51 |
| GO:00704829 | Breast | Precancer | response to oxygen levels | 55/1080 | 347/18723 | 7.47e-12 | 1.11e-09 | 55 |
| GO:00362948 | Breast | Precancer | cellular response to decreased oxygen levels | 31/1080 | 161/18723 | 2.61e-09 | 2.11e-07 | 31 |
| GO:00714538 | Breast | Precancer | cellular response to oxygen levels | 32/1080 | 177/18723 | 7.32e-09 | 5.52e-07 | 32 |
| GO:00714565 | Breast | Precancer | cellular response to hypoxia | 29/1080 | 151/18723 | 8.98e-09 | 6.50e-07 | 29 |
| GO:007048214 | Breast | IDC | response to oxygen levels | 64/1434 | 347/18723 | 3.45e-11 | 5.57e-09 | 64 |
| GO:003629314 | Breast | IDC | response to decreased oxygen levels | 60/1434 | 322/18723 | 9.26e-11 | 1.25e-08 | 60 |
| GO:000166614 | Breast | IDC | response to hypoxia | 58/1434 | 307/18723 | 1.09e-10 | 1.38e-08 | 58 |
| GO:003629413 | Breast | IDC | cellular response to decreased oxygen levels | 34/1434 | 161/18723 | 4.73e-08 | 3.02e-06 | 34 |
| GO:007145613 | Breast | IDC | cellular response to hypoxia | 32/1434 | 151/18723 | 1.07e-07 | 6.26e-06 | 32 |
| GO:007145313 | Breast | IDC | cellular response to oxygen levels | 35/1434 | 177/18723 | 1.68e-07 | 9.10e-06 | 35 |
| GO:00325358 | Breast | IDC | regulation of cellular component size | 45/1434 | 383/18723 | 2.72e-03 | 2.41e-02 | 45 |
| GO:003629323 | Breast | DCIS | response to decreased oxygen levels | 60/1390 | 322/18723 | 2.64e-11 | 4.56e-09 | 60 |
| GO:007048223 | Breast | DCIS | response to oxygen levels | 63/1390 | 347/18723 | 2.66e-11 | 4.56e-09 | 63 |
| GO:000166623 | Breast | DCIS | response to hypoxia | 58/1390 | 307/18723 | 3.19e-11 | 5.16e-09 | 58 |
| GO:003629422 | Breast | DCIS | cellular response to decreased oxygen levels | 34/1390 | 161/18723 | 2.21e-08 | 1.49e-06 | 34 |
| GO:007145622 | Breast | DCIS | cellular response to hypoxia | 32/1390 | 151/18723 | 5.21e-08 | 3.17e-06 | 32 |
| GO:007145322 | Breast | DCIS | cellular response to oxygen levels | 35/1390 | 177/18723 | 7.89e-08 | 4.47e-06 | 35 |
| GO:003253514 | Breast | DCIS | regulation of cellular component size | 44/1390 | 383/18723 | 2.58e-03 | 2.30e-02 | 44 |
| Hugo Symbol | Variant Class | Variant Classification | dbSNP RS | HGVSc | HGVSp | HGVSp Short | SWISSPROT | BIOTYPE | SIFT | PolyPhen | Tumor Sample Barcode | Tissue | Histology | Sex | Age | Stage | Therapy Types | Drugs | Outcome |
| HP1BP3 | SNV | Missense_Mutation | | c.959A>G | p.Lys320Arg | p.K320R | Q5SSJ5 | protein_coding | deleterious(0) | possibly_damaging(0.908) | TCGA-AR-A24L-01 | Breast | breast invasive carcinoma | Female | <65 | I/II | Hormone Therapy | tamoxiphen | PD |
| HP1BP3 | SNV | Missense_Mutation | | c.653N>T | p.Gln218Leu | p.Q218L | Q5SSJ5 | protein_coding | deleterious(0) | probably_damaging(0.968) | TCGA-BH-A18K-01 | Breast | breast invasive carcinoma | Female | <65 | I/II | Unknown | Unknown | PD |
| HP1BP3 | SNV | Missense_Mutation | | c.1279N>C | p.Glu427Gln | p.E427Q | Q5SSJ5 | protein_coding | tolerated(0.59) | benign(0.001) | TCGA-EW-A1J5-01 | Breast | breast invasive carcinoma | Female | <65 | I/II | Chemotherapy | adriamycin | SD |
| HP1BP3 | SNV | Missense_Mutation | novel | c.626G>A | p.Arg209Lys | p.R209K | Q5SSJ5 | protein_coding | tolerated(0.5) | probably_damaging(0.963) | TCGA-PE-A5DE-01 | Breast | breast invasive carcinoma | Female | <65 | I/II | Chemotherapy | taxotere | CR |
| HP1BP3 | SNV | Missense_Mutation | novel | c.1388C>T | p.Ala463Val | p.A463V | Q5SSJ5 | protein_coding | tolerated_low_confidence(0.18) | benign(0) | TCGA-2W-A8YY-01 | Cervix | cervical & endocervical cancer | Female | <65 | I/II | Chemotherapy | cisplatin | CR |
| HP1BP3 | SNV | Missense_Mutation | rs771916157 | c.1352C>T | p.Pro451Leu | p.P451L | Q5SSJ5 | protein_coding | deleterious_low_confidence(0) | probably_damaging(0.995) | TCGA-2W-A8YY-01 | Cervix | cervical & endocervical cancer | Female | <65 | I/II | Chemotherapy | cisplatin | CR |
| HP1BP3 | SNV | Missense_Mutation | | c.928N>C | p.Glu310Gln | p.E310Q | Q5SSJ5 | protein_coding | deleterious(0.02) | benign(0.419) | TCGA-IR-A3LA-01 | Cervix | cervical & endocervical cancer | Female | <65 | I/II | Chemotherapy | cisplatin | CR |
| HP1BP3 | insertion | Frame_Shift_Ins | novel | c.1536_1537insATTG | p.Ser513IlefsTer9 | p.S513Ifs*9 | Q5SSJ5 | protein_coding | | | TCGA-DS-A1OC-01 | Cervix | cervical & endocervical cancer | Female | <65 | I/II | Chemotherapy | gemcitabine | SD |
| HP1BP3 | deletion | Frame_Shift_Del | | c.394delA | p.Thr132GlnfsTer13 | p.T132Qfs*13 | Q5SSJ5 | protein_coding | | | TCGA-MA-AA42-01 | Cervix | cervical & endocervical cancer | Female | >=65 | I/II | Unknown | Unknown | SD |
| HP1BP3 | SNV | Missense_Mutation | | c.1511N>T | p.Thr504Met | p.T504M | Q5SSJ5 | protein_coding | deleterious_low_confidence(0) | benign(0.416) | TCGA-AA-A01R-01 | Colorectum | colon adenocarcinoma | Male | <65 | III/IV | Chemotherapy | 5-fluorouracil | PD |


