| Entrez ID | Symbol | Replicates | Species | Organ | Tissue | Adj P-value | Log2FC | Malignancy |
| 8894 | EIF2S2 | GSM5353222_PA_PB2B_Pool_1_3_S52_L002 | Human | Prostate | Tumor | 8.88e-20 | -8.51e-01 | 0.1608 |
| 8894 | EIF2S2 | GSM5353223_PA_PB2B_Pool_2_S26_L001 | Human | Prostate | Tumor | 1.82e-09 | -7.91e-01 | 0.1604 |
| 8894 | EIF2S2 | GSM5353224_PA_PR5186_Pool_1_2_3_S27_L001 | Human | Prostate | Tumor | 4.68e-08 | -7.22e-01 | 0.1621 |
| 8894 | EIF2S2 | GSM5353225_PA_PR5196-1_Pool_1_2_3_S53_L002 | Human | Prostate | Tumor | 1.67e-05 | -8.27e-01 | 0.1619 |
| 8894 | EIF2S2 | GSM5353227_PA_PR5199-193K_Pool_1_2_3_S55_L002 | Human | Prostate | Tumor | 1.23e-13 | -8.17e-01 | 0.1602 |
| 8894 | EIF2S2 | GSM5353232_PA_PR5249_T1_S3_L001 | Human | Prostate | Tumor | 3.92e-03 | -8.98e-01 | 0.1439 |
| 8894 | EIF2S2 | GSM5353236_PA_PR5251_T1_S7_L001 | Human | Prostate | Tumor | 2.15e-06 | -8.39e-01 | 0.1608 |
| 8894 | EIF2S2 | GSM5353240_PA_PR5254_T1_S15_L001 | Human | Prostate | Tumor | 6.69e-22 | -8.12e-01 | 0.1575 |
| 8894 | EIF2S2 | GSM5353243_PA_PR5261_T1_S23_L002 | Human | Prostate | Tumor | 9.58e-34 | -9.41e-01 | 0.1545 |
| 8894 | EIF2S2 | GSM5353244_PA_PR5261_T2_S24_L002 | Human | Prostate | Tumor | 6.51e-24 | -9.15e-01 | 0.1569 |
| 8894 | EIF2S2 | GSM5353247_PA_PR5269_3_S27_L002 | Human | Prostate | Tumor | 8.07e-03 | -9.71e-01 | 0.1532 |
| 8894 | EIF2S2 | P4_S8_cSCC | Human | Skin | cSCC | 3.15e-13 | 3.56e-01 | -0.3095 |
| 8894 | EIF2S2 | P5_S10_cSCC | Human | Skin | cSCC | 1.20e-21 | 5.08e-01 | -0.299 |
| 8894 | EIF2S2 | P1_cSCC | Human | Skin | cSCC | 1.69e-56 | 2.05e+00 | 0.0292 |
| 8894 | EIF2S2 | P2_cSCC | Human | Skin | cSCC | 1.90e-67 | 1.68e+00 | -0.024 |
| 8894 | EIF2S2 | P4_cSCC | Human | Skin | cSCC | 8.12e-65 | 1.78e+00 | -0.00290000000000005 |
| 8894 | EIF2S2 | P10_cSCC | Human | Skin | cSCC | 2.57e-67 | 2.07e+00 | 0.1017 |
| 8894 | EIF2S2 | cSCC_p10 | Human | Skin | cSCC | 9.79e-11 | 4.79e-01 | -0.2095 |
| 8894 | EIF2S2 | cSCC_p8 | Human | Skin | cSCC | 3.16e-13 | 3.34e-01 | -0.1971 |
| 8894 | EIF2S2 | cSCC_p9 | Human | Skin | cSCC | 8.95e-11 | 2.18e-01 | -0.1991 |
| Tissue | Expression Dynamics | Abbreviation |
| Colorectum (GSE201348) |  | FAP: Familial adenomatous polyposis |
| CRC: Colorectal cancer |
| Colorectum (HTA11) |  | AD: Adenomas |
| SER: Sessile serrated lesions |
| MSI-H: Microsatellite-high colorectal cancer |
| MSS: Microsatellite stable colorectal cancer |
| Endometrium | 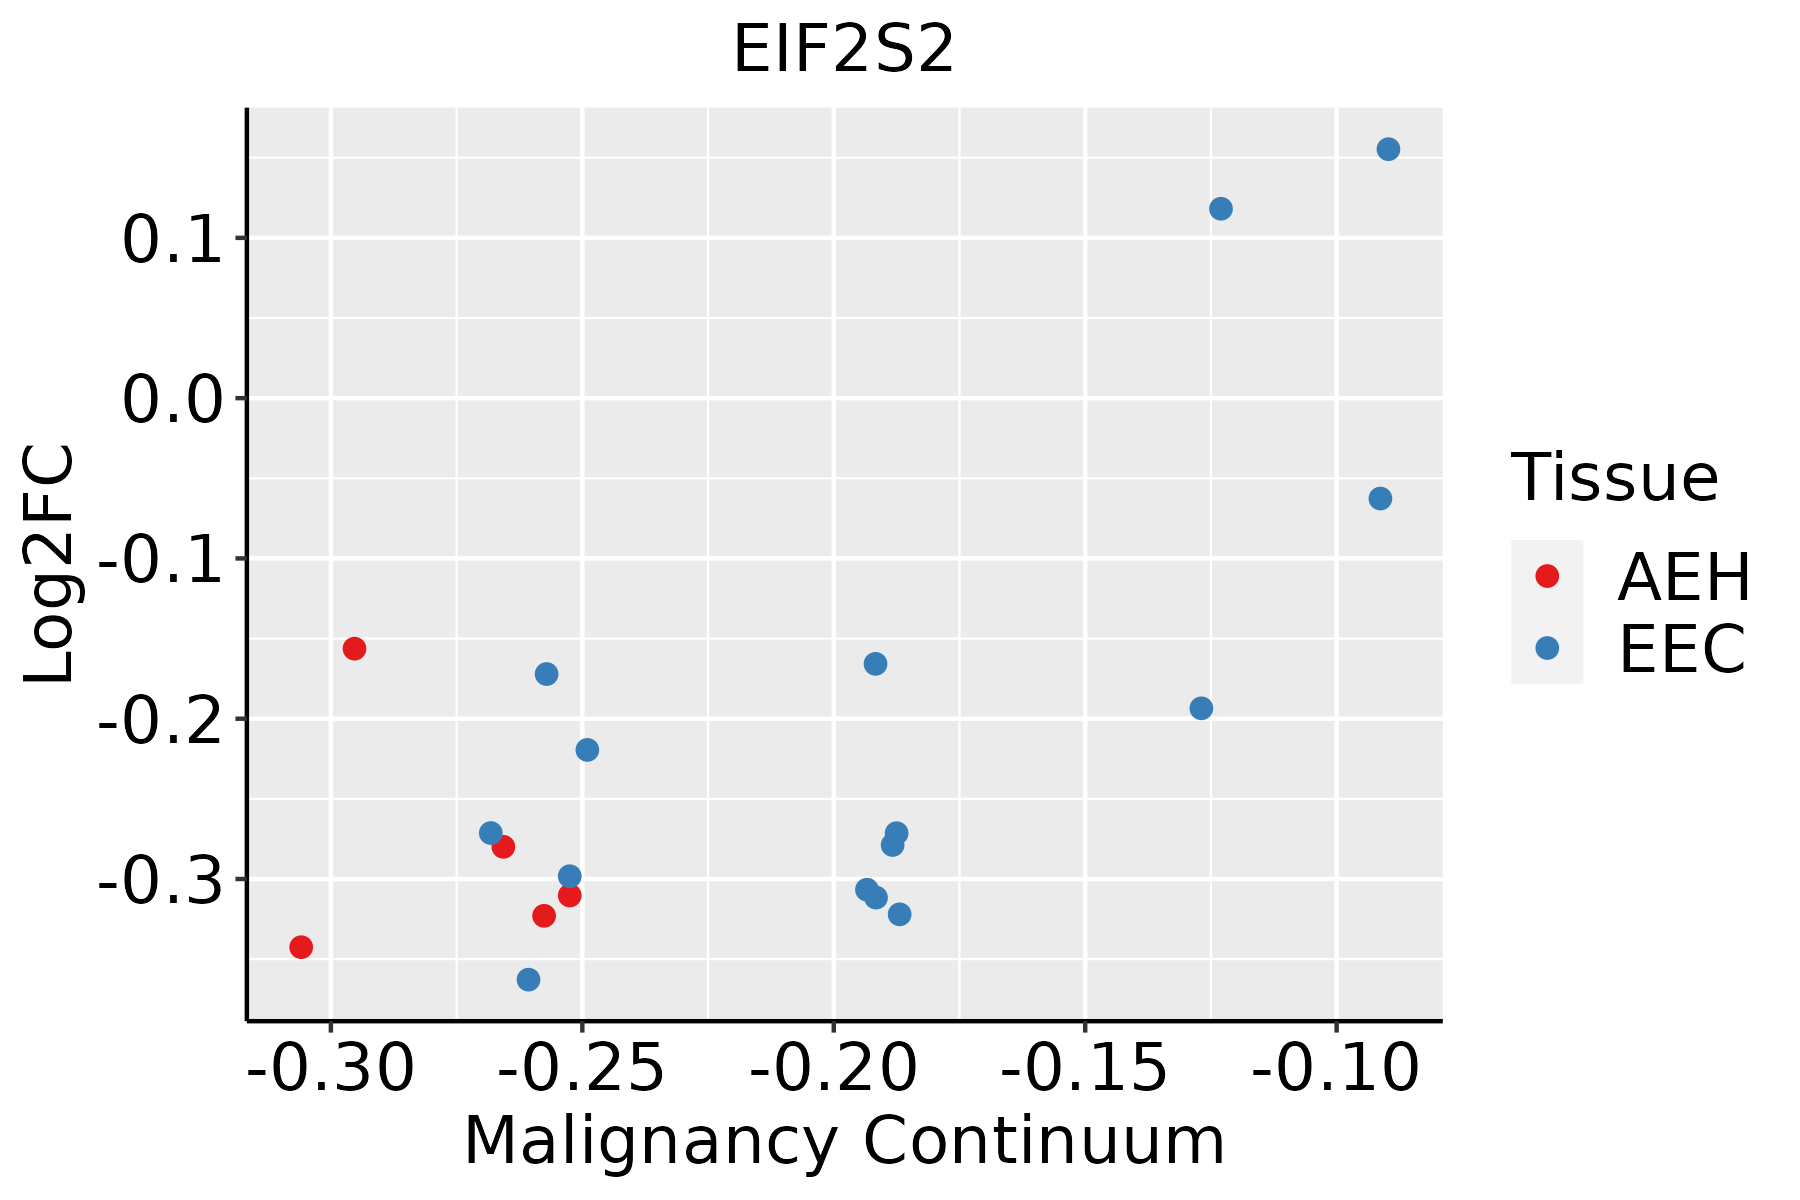 | AEH: Atypical endometrial hyperplasia |
| EEC: Endometrioid Cancer |
| Esophagus |  | ESCC: Esophageal squamous cell carcinoma |
| HGIN: High-grade intraepithelial neoplasias |
| LGIN: Low-grade intraepithelial neoplasias |
| Liver | 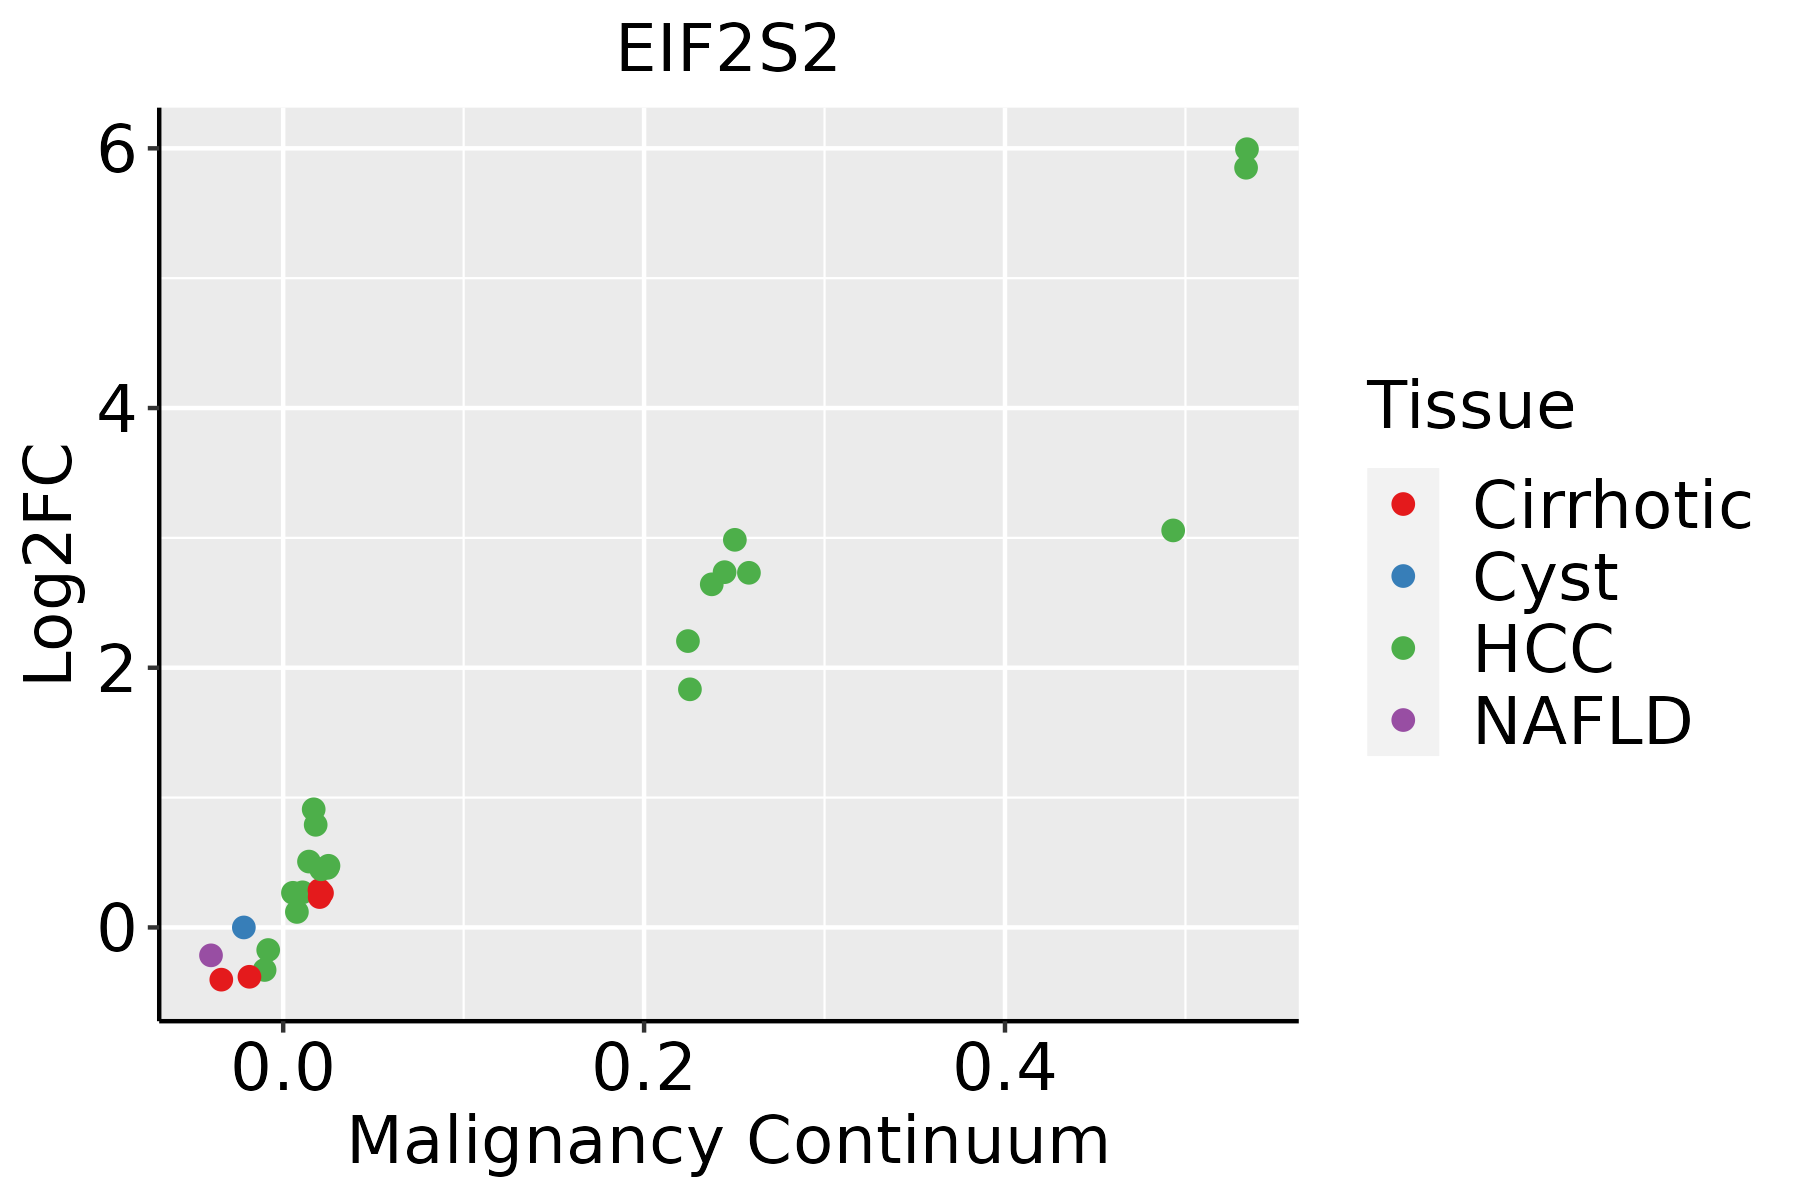 | HCC: Hepatocellular carcinoma |
| NAFLD: Non-alcoholic fatty liver disease |
| Oral Cavity | 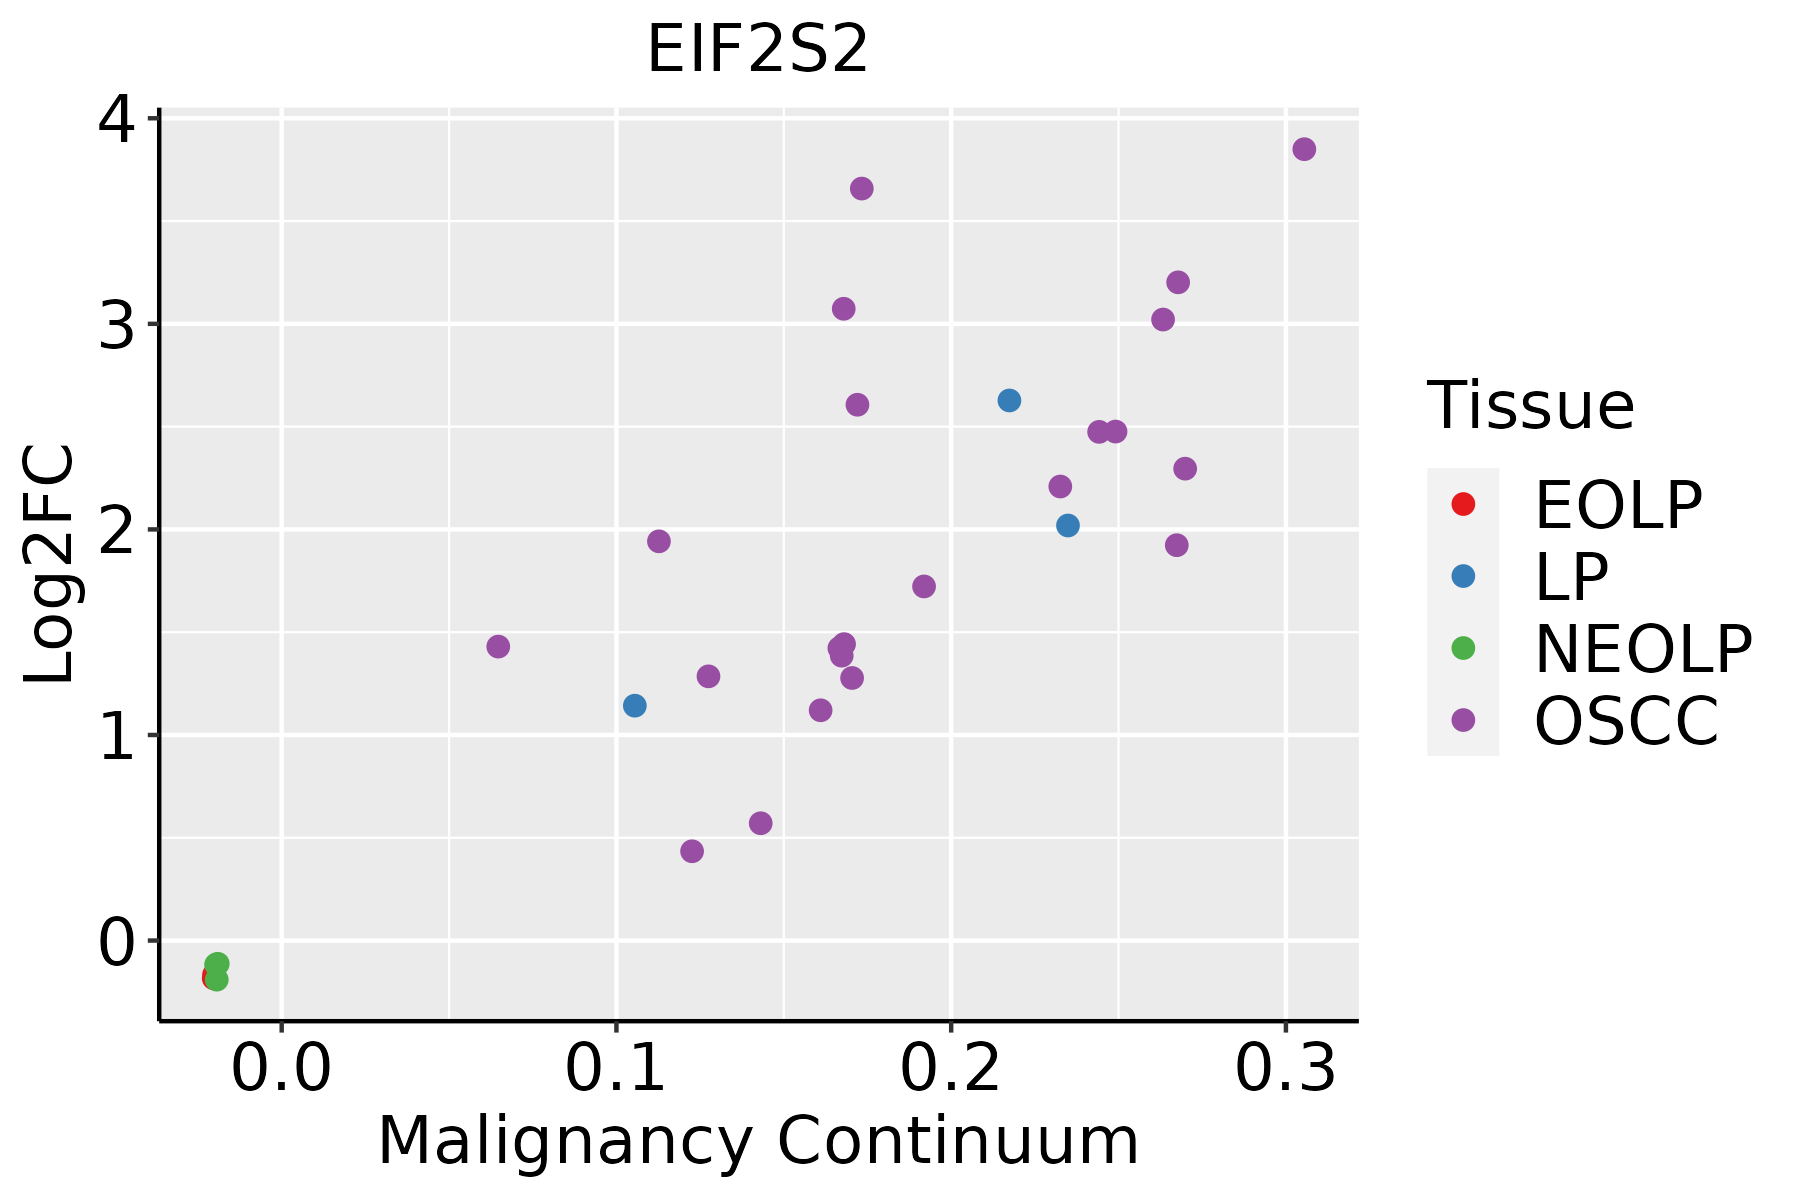 | EOLP: Erosive Oral lichen planus |
| LP: leukoplakia |
| NEOLP: Non-erosive oral lichen planus |
| OSCC: Oral squamous cell carcinoma |
| Prostate | 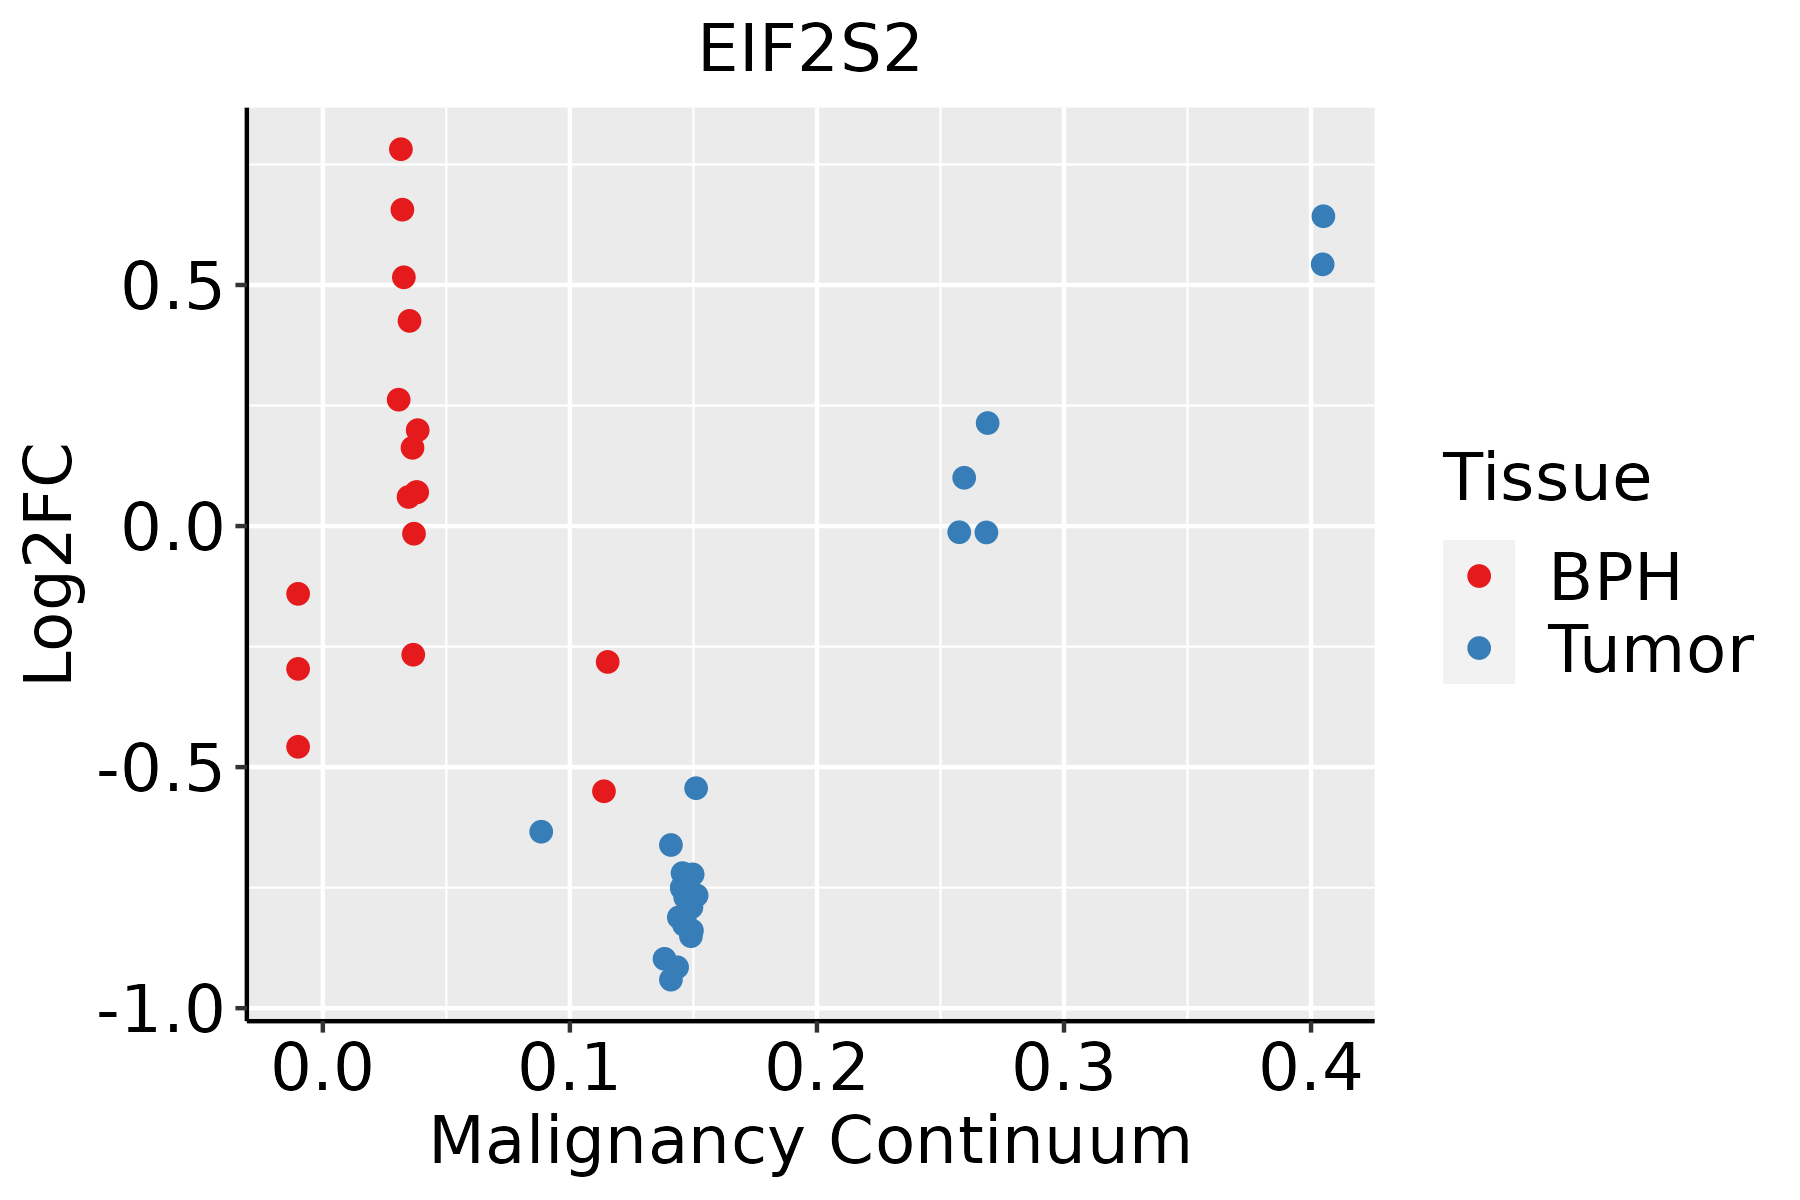 | BPH: Benign Prostatic Hyperplasia |
| Skin | 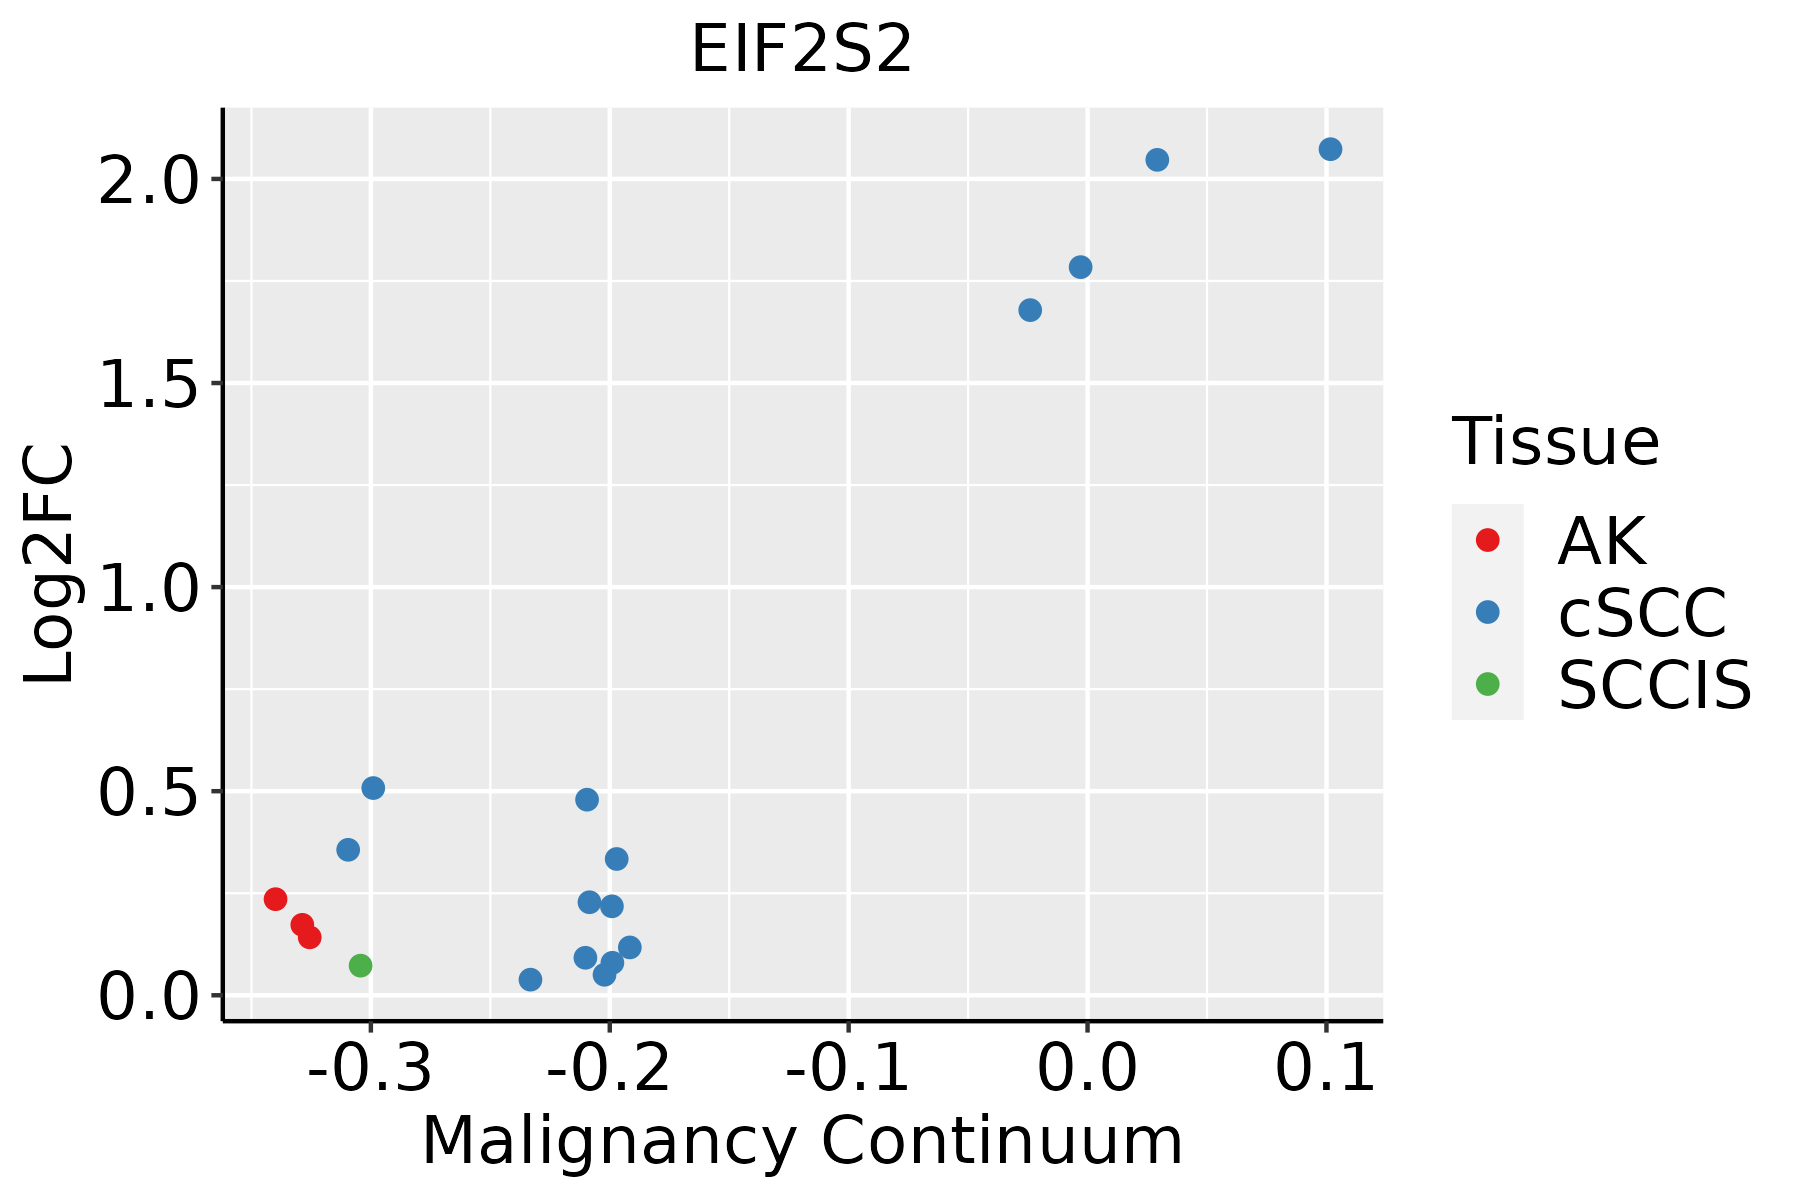 | AK: Actinic keratosis |
| cSCC: Cutaneous squamous cell carcinoma |
| SCCIS:squamous cell carcinoma in situ |
| Thyroid | 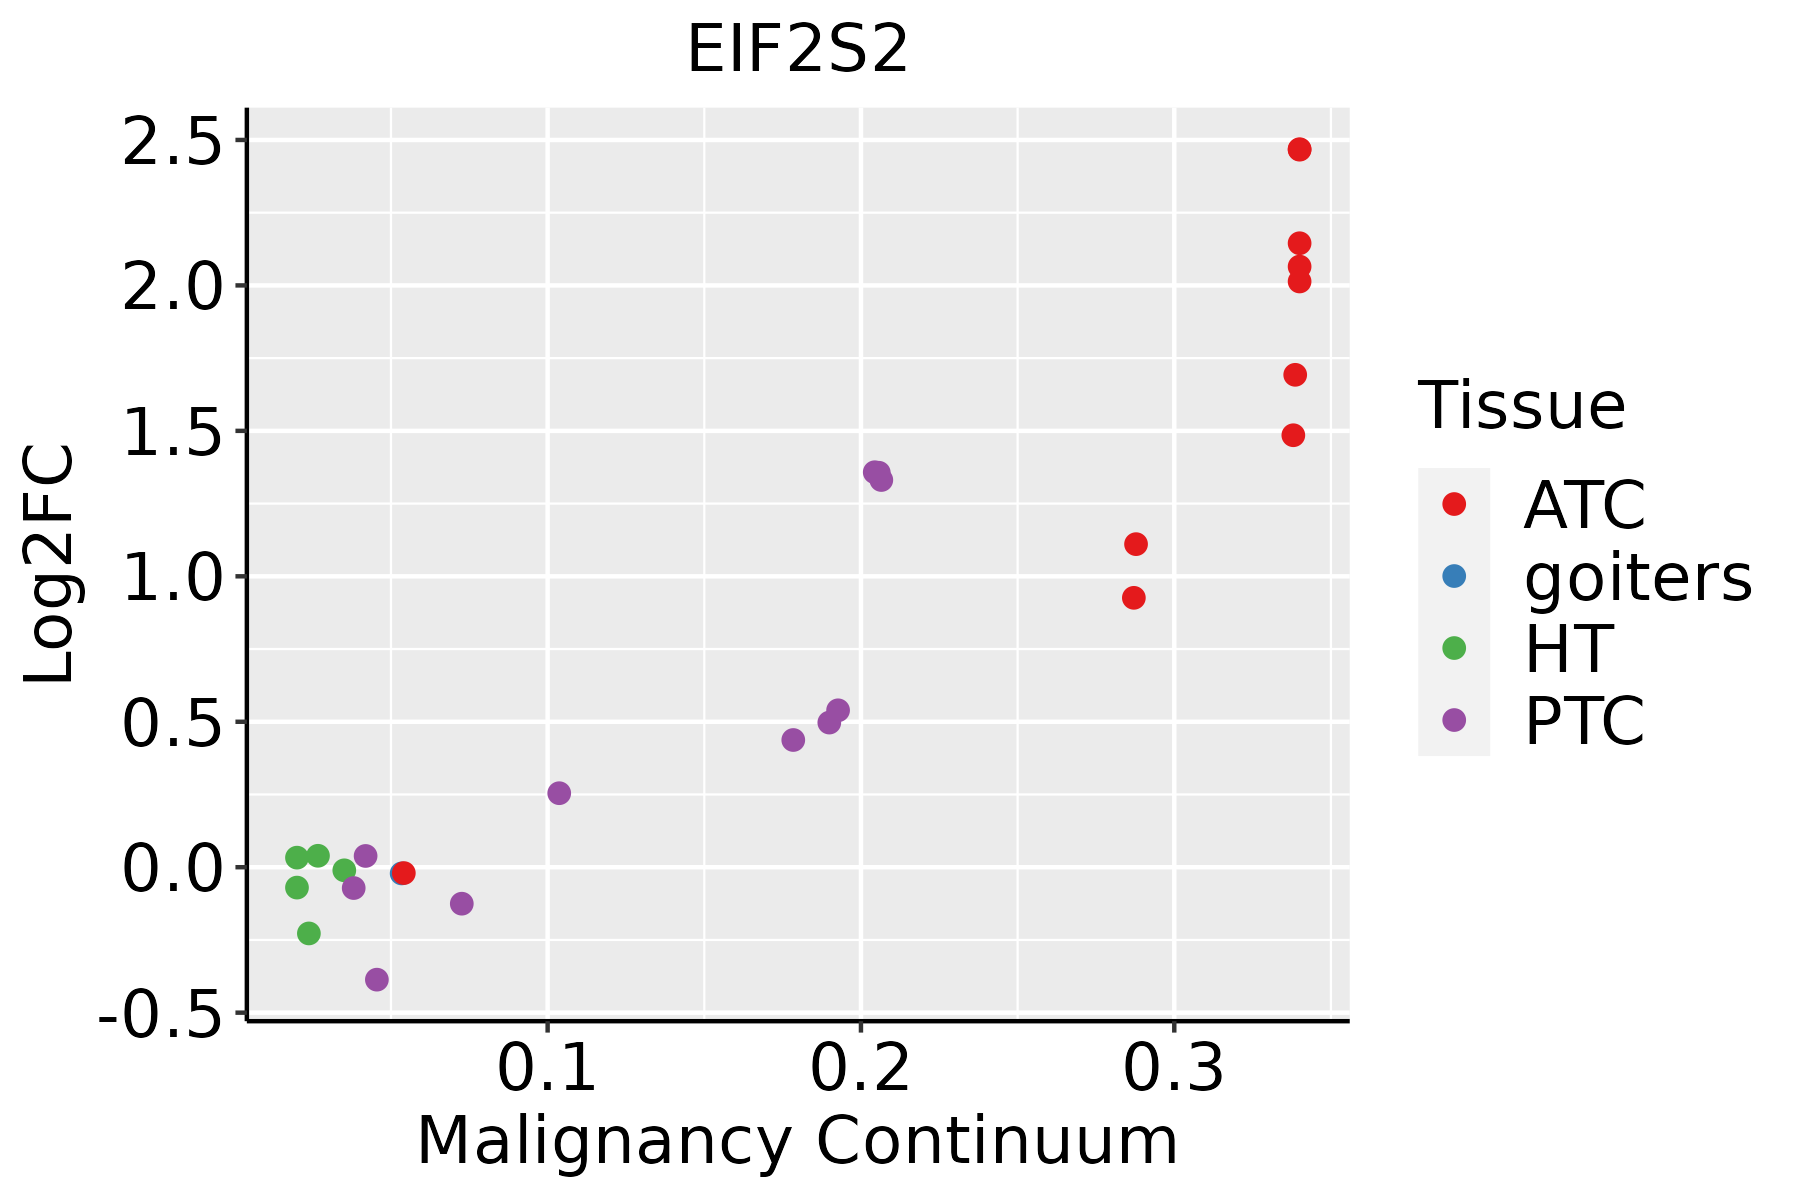 | ATC: Anaplastic thyroid cancer |
| HT: Hashimoto's thyroiditis |
| PTC: Papillary thyroid cancer |
| GO ID | Tissue | Disease Stage | Description | Gene Ratio | Bg Ratio | pvalue | p.adjust | Count |
| GO:0002181 | Colorectum | AD | cytoplasmic translation | 109/3918 | 148/18723 | 3.40e-43 | 2.13e-39 | 109 |
| GO:0022618 | Colorectum | AD | ribonucleoprotein complex assembly | 92/3918 | 220/18723 | 1.49e-12 | 2.60e-10 | 92 |
| GO:0071826 | Colorectum | AD | ribonucleoprotein complex subunit organization | 94/3918 | 227/18723 | 1.70e-12 | 2.87e-10 | 94 |
| GO:0022613 | Colorectum | AD | ribonucleoprotein complex biogenesis | 151/3918 | 463/18723 | 1.96e-09 | 1.39e-07 | 151 |
| GO:0002183 | Colorectum | AD | cytoplasmic translational initiation | 21/3918 | 34/18723 | 2.73e-07 | 1.09e-05 | 21 |
| GO:0001732 | Colorectum | AD | formation of cytoplasmic translation initiation complex | 13/3918 | 16/18723 | 4.27e-07 | 1.64e-05 | 13 |
| GO:0006413 | Colorectum | AD | translational initiation | 45/3918 | 118/18723 | 1.35e-05 | 2.92e-04 | 45 |
| GO:0001701 | Colorectum | AD | in utero embryonic development | 110/3918 | 367/18723 | 2.36e-05 | 4.62e-04 | 110 |
| GO:0061458 | Colorectum | AD | reproductive system development | 116/3918 | 427/18723 | 1.11e-03 | 1.01e-02 | 116 |
| GO:0048608 | Colorectum | AD | reproductive structure development | 114/3918 | 424/18723 | 1.78e-03 | 1.47e-02 | 114 |
| GO:0001731 | Colorectum | AD | formation of translation preinitiation complex | 7/3918 | 11/18723 | 2.59e-03 | 1.96e-02 | 7 |
| GO:00021812 | Colorectum | MSS | cytoplasmic translation | 108/3467 | 148/18723 | 1.78e-47 | 1.11e-43 | 108 |
| GO:00718262 | Colorectum | MSS | ribonucleoprotein complex subunit organization | 90/3467 | 227/18723 | 6.88e-14 | 1.78e-11 | 90 |
| GO:00226182 | Colorectum | MSS | ribonucleoprotein complex assembly | 88/3467 | 220/18723 | 7.12e-14 | 1.78e-11 | 88 |
| GO:00226132 | Colorectum | MSS | ribonucleoprotein complex biogenesis | 144/3467 | 463/18723 | 2.76e-11 | 3.67e-09 | 144 |
| GO:00021832 | Colorectum | MSS | cytoplasmic translational initiation | 21/3467 | 34/18723 | 2.99e-08 | 1.67e-06 | 21 |
| GO:00017322 | Colorectum | MSS | formation of cytoplasmic translation initiation complex | 13/3467 | 16/18723 | 9.42e-08 | 4.63e-06 | 13 |
| GO:00064132 | Colorectum | MSS | translational initiation | 43/3467 | 118/18723 | 3.19e-06 | 9.38e-05 | 43 |
| GO:00614582 | Colorectum | MSS | reproductive system development | 115/3467 | 427/18723 | 9.86e-06 | 2.39e-04 | 115 |
| GO:00486082 | Colorectum | MSS | reproductive structure development | 113/3467 | 424/18723 | 1.94e-05 | 4.18e-04 | 113 |
| Hugo Symbol | Variant Class | Variant Classification | dbSNP RS | HGVSc | HGVSp | HGVSp Short | SWISSPROT | BIOTYPE | SIFT | PolyPhen | Tumor Sample Barcode | Tissue | Histology | Sex | Age | Stage | Therapy Types | Drugs | Outcome |
| EIF2S2 | SNV | Missense_Mutation | | c.949N>T | p.Gly317Cys | p.G317C | P20042 | protein_coding | deleterious(0) | probably_damaging(0.999) | TCGA-A7-A4SE-01 | Breast | breast invasive carcinoma | Female | <65 | I/II | Chemotherapy | adriamycin | CR |
| EIF2S2 | SNV | Missense_Mutation | | c.471N>G | p.Ile157Met | p.I157M | P20042 | protein_coding | deleterious(0.03) | possibly_damaging(0.809) | TCGA-BH-A0HP-01 | Breast | breast invasive carcinoma | Female | >=65 | III/IV | Chemotherapy | doxorubicin | SD |
| EIF2S2 | SNV | Missense_Mutation | | c.974N>A | p.Arg325Gln | p.R325Q | P20042 | protein_coding | deleterious(0.02) | probably_damaging(0.921) | TCGA-E2-A14N-01 | Breast | breast invasive carcinoma | Female | <65 | I/II | Chemotherapy | cyclophosphamide | SD |
| EIF2S2 | SNV | Missense_Mutation | | c.782G>A | p.Arg261Lys | p.R261K | P20042 | protein_coding | deleterious(0.03) | probably_damaging(0.946) | TCGA-EW-A1J2-01 | Breast | breast invasive carcinoma | Female | <65 | I/II | Chemotherapy | taxotere | SD |
| EIF2S2 | insertion | Frame_Shift_Ins | novel | c.869_870insTCCCAATGTTGGATATTTCTACATGAATAAAGCAAGGATCAGTG | p.Leu291ProfsTer87 | p.L291Pfs*87 | P20042 | protein_coding | | | TCGA-A7-A0CJ-01 | Breast | breast invasive carcinoma | Female | <65 | I/II | Chemotherapy | cytoxan | SD |
| EIF2S2 | insertion | In_Frame_Ins | novel | c.887_888insCCAAGTCCTCCCCCAGCT | p.Arg296_Leu297insGlnValLeuProGlnLeu | p.R296_L297insQVLPQL | P20042 | protein_coding | | | TCGA-A8-A090-01 | Breast | breast invasive carcinoma | Female | >=65 | I/II | Unknown | Unknown | SD |
| EIF2S2 | SNV | Missense_Mutation | | c.727N>A | p.Glu243Lys | p.E243K | P20042 | protein_coding | deleterious(0) | probably_damaging(0.973) | TCGA-MU-A8JM-01 | Cervix | cervical & endocervical cancer | Female | <65 | I/II | Unknown | Unknown | SD |
| EIF2S2 | SNV | Missense_Mutation | | c.237N>T | p.Lys79Asn | p.K79N | P20042 | protein_coding | tolerated(0.11) | probably_damaging(0.95) | TCGA-AA-3977-01 | Colorectum | colon adenocarcinoma | Male | >=65 | I/II | Unknown | Unknown | SD |
| EIF2S2 | SNV | Missense_Mutation | | c.570N>T | p.Lys190Asn | p.K190N | P20042 | protein_coding | tolerated(0.22) | probably_damaging(0.991) | TCGA-CA-6717-01 | Colorectum | colon adenocarcinoma | Male | <65 | I/II | Chemotherapy | oxaliplatin | CR |
| EIF2S2 | SNV | Missense_Mutation | novel | c.220N>C | p.Asn74His | p.N74H | P20042 | protein_coding | deleterious(0.01) | benign(0.226) | TCGA-AJ-A3EL-01 | Endometrium | uterine corpus endometrioid carcinoma | Female | <65 | I/II | Unknown | Unknown | SD |


