| Tissue | Expression Dynamics | Abbreviation |
| Cervix |  | CC: Cervix cancer |
| HSIL_HPV: HPV-infected high-grade squamous intraepithelial lesions |
| N_HPV: HPV-infected normal cervix |
| Colorectum (GSE201348) |  | FAP: Familial adenomatous polyposis |
| CRC: Colorectal cancer |
| Colorectum (HTA11) |  | AD: Adenomas |
| SER: Sessile serrated lesions |
| MSI-H: Microsatellite-high colorectal cancer |
| MSS: Microsatellite stable colorectal cancer |
| Endometrium | 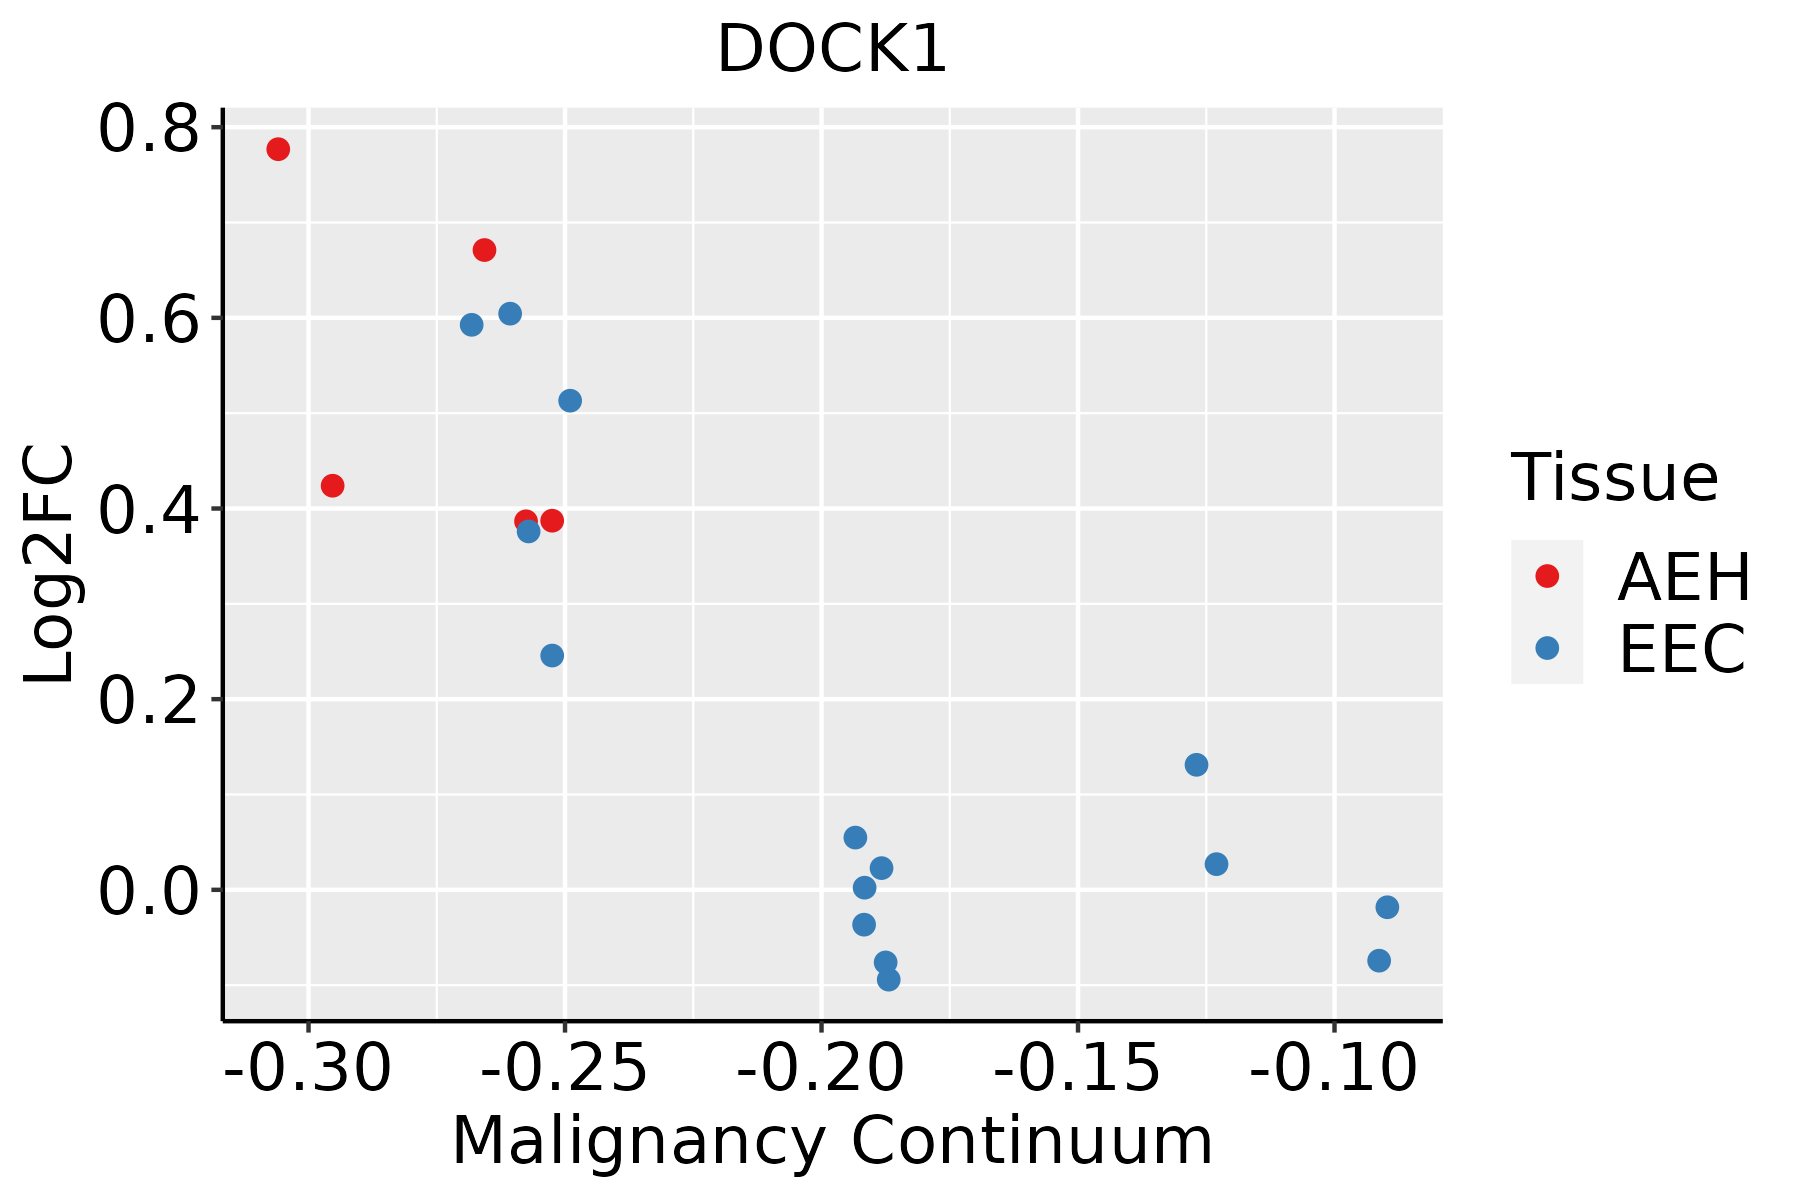 | AEH: Atypical endometrial hyperplasia |
| EEC: Endometrioid Cancer |
| Esophagus |  | ESCC: Esophageal squamous cell carcinoma |
| HGIN: High-grade intraepithelial neoplasias |
| LGIN: Low-grade intraepithelial neoplasias |
| Lung | 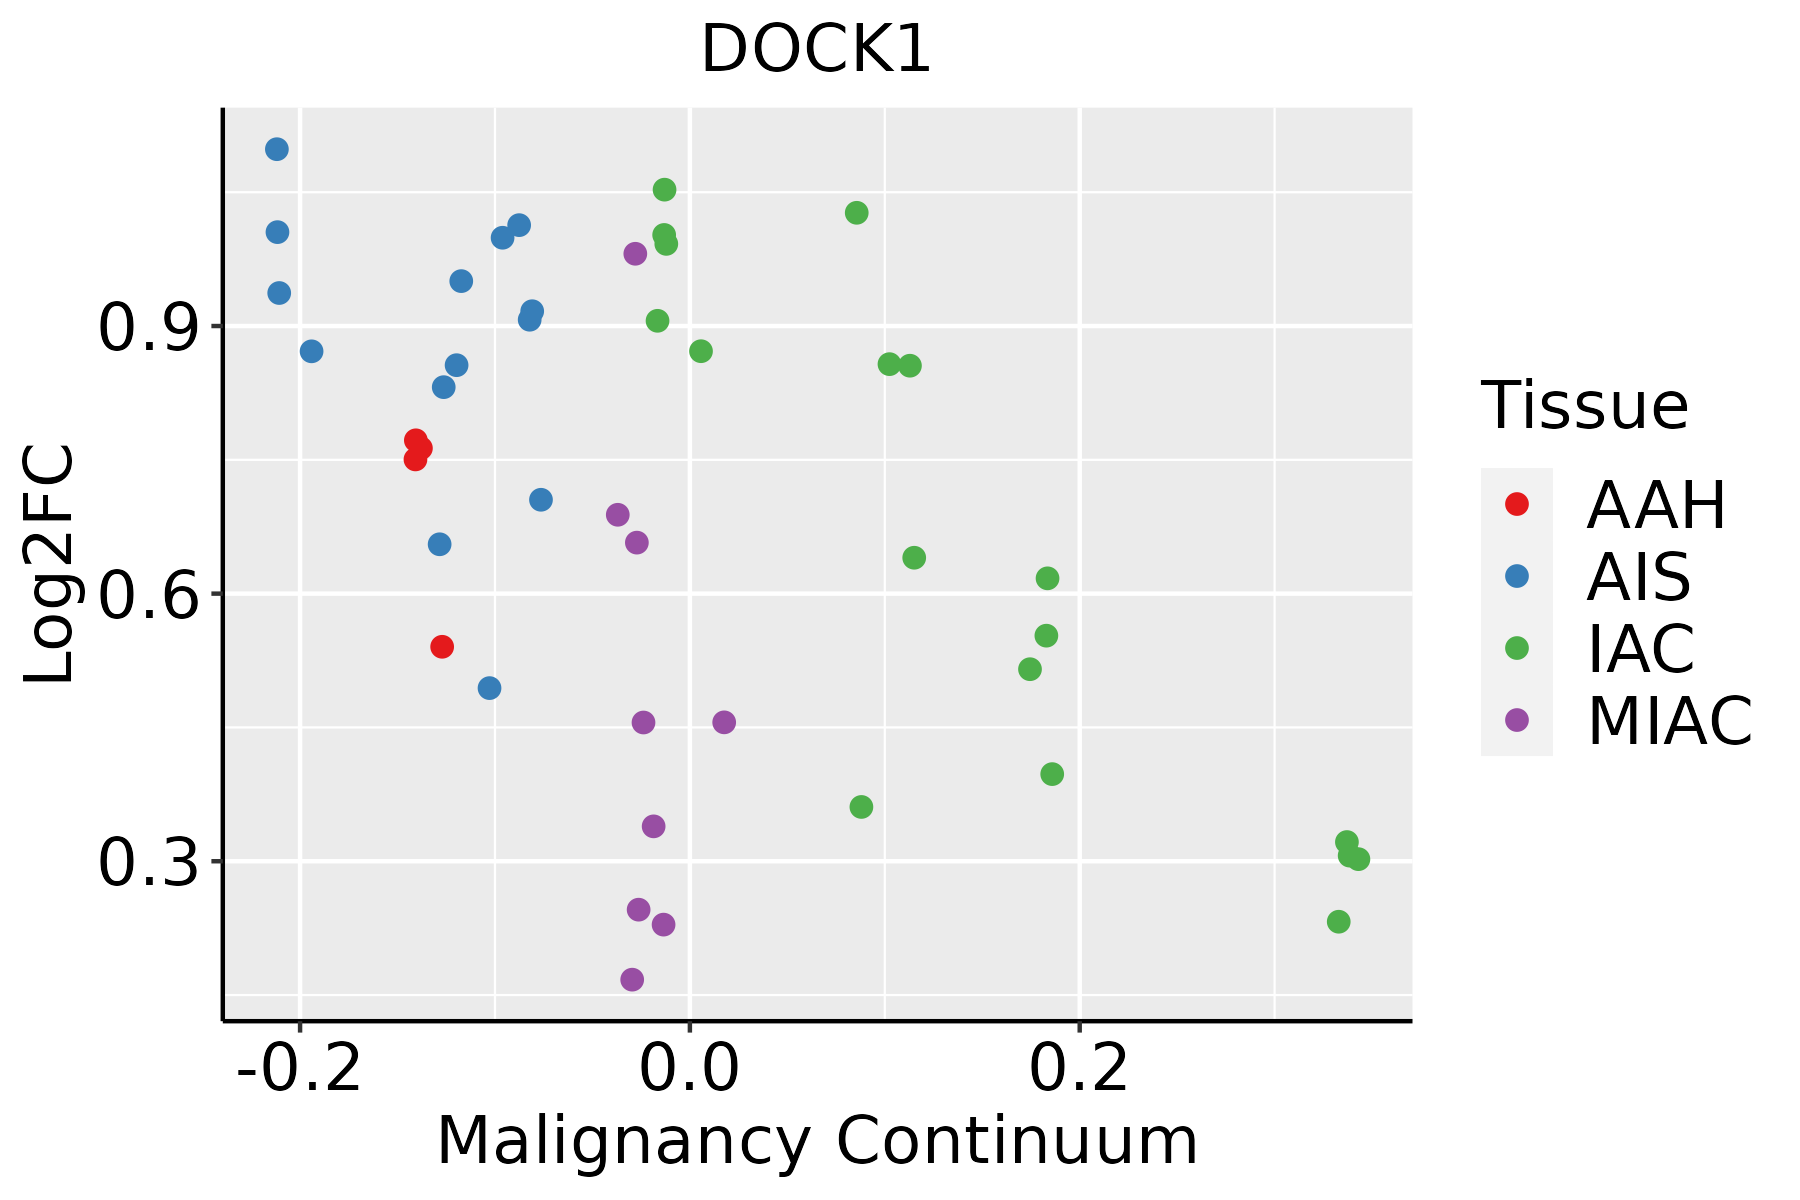 | AAH: Atypical adenomatous hyperplasia |
| AIS: Adenocarcinoma in situ |
| IAC: Invasive lung adenocarcinoma |
| MIA: Minimally invasive adenocarcinoma |
| Prostate |  | BPH: Benign Prostatic Hyperplasia |
| Skin |  | AK: Actinic keratosis |
| cSCC: Cutaneous squamous cell carcinoma |
| SCCIS:squamous cell carcinoma in situ |
| Thyroid | 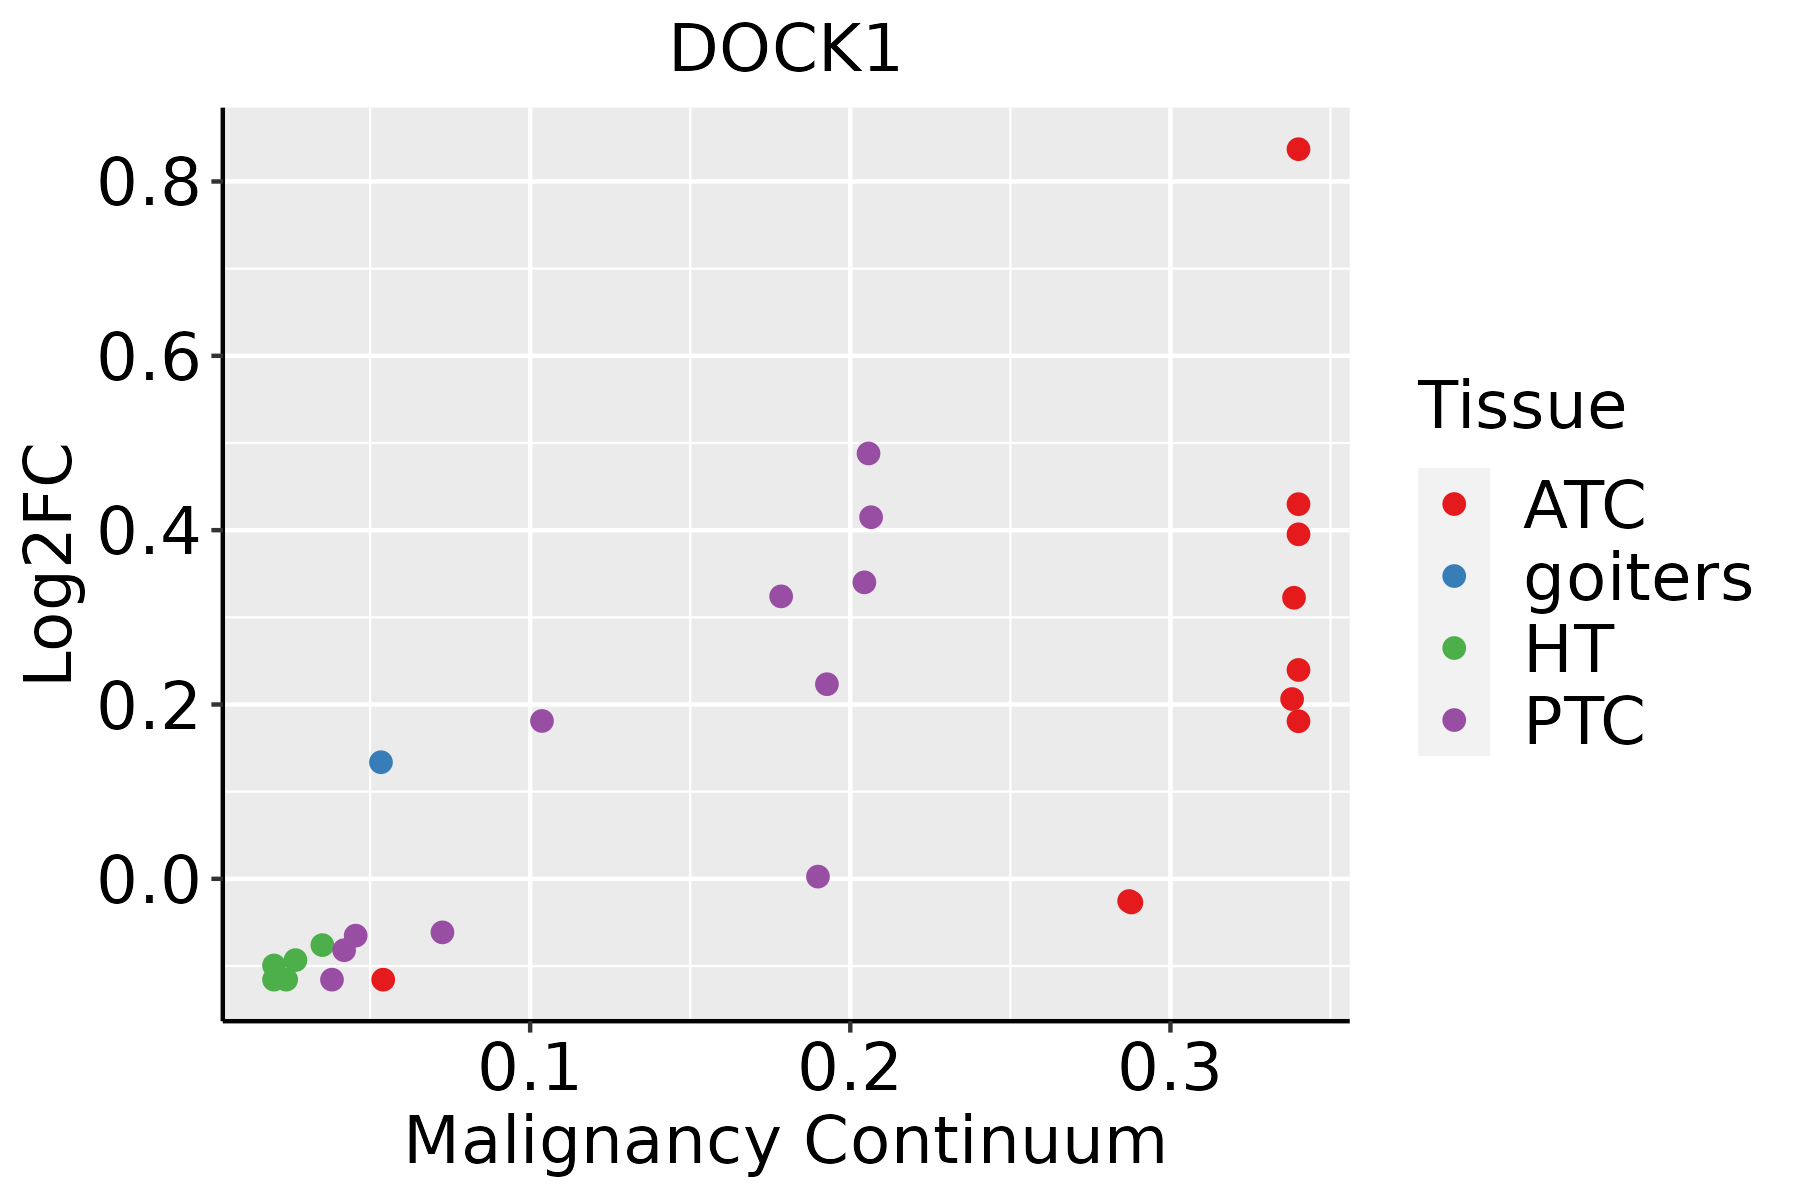 | ATC: Anaplastic thyroid cancer |
| HT: Hashimoto's thyroiditis |
| PTC: Papillary thyroid cancer |
| GO ID | Tissue | Disease Stage | Description | Gene Ratio | Bg Ratio | pvalue | p.adjust | Count |
| GO:001081010 | Cervix | CC | regulation of cell-substrate adhesion | 69/2311 | 221/18723 | 8.57e-14 | 5.69e-11 | 69 |
| GO:00315898 | Cervix | CC | cell-substrate adhesion | 96/2311 | 363/18723 | 1.48e-13 | 8.85e-11 | 96 |
| GO:002260410 | Cervix | CC | regulation of cell morphogenesis | 84/2311 | 309/18723 | 1.00e-12 | 4.29e-10 | 84 |
| GO:009013210 | Cervix | CC | epithelium migration | 90/2311 | 360/18723 | 2.45e-11 | 6.11e-09 | 90 |
| GO:00016679 | Cervix | CC | ameboidal-type cell migration | 110/2311 | 475/18723 | 2.66e-11 | 6.36e-09 | 110 |
| GO:001063110 | Cervix | CC | epithelial cell migration | 89/2311 | 357/18723 | 3.72e-11 | 8.54e-09 | 89 |
| GO:009013010 | Cervix | CC | tissue migration | 90/2311 | 365/18723 | 5.42e-11 | 1.05e-08 | 90 |
| GO:004578510 | Cervix | CC | positive regulation of cell adhesion | 101/2311 | 437/18723 | 1.96e-10 | 3.08e-08 | 101 |
| GO:001063210 | Cervix | CC | regulation of epithelial cell migration | 72/2311 | 292/18723 | 4.52e-09 | 4.43e-07 | 72 |
| GO:19000249 | Cervix | CC | regulation of substrate adhesion-dependent cell spreading | 23/2311 | 57/18723 | 8.94e-08 | 5.04e-06 | 23 |
| GO:00072295 | Cervix | CC | integrin-mediated signaling pathway | 34/2311 | 107/18723 | 1.01e-07 | 5.25e-06 | 34 |
| GO:00106349 | Cervix | CC | positive regulation of epithelial cell migration | 47/2311 | 176/18723 | 1.73e-07 | 8.01e-06 | 47 |
| GO:00107699 | Cervix | CC | regulation of cell morphogenesis involved in differentiation | 31/2311 | 96/18723 | 2.43e-07 | 1.05e-05 | 31 |
| GO:00344469 | Cervix | CC | substrate adhesion-dependent cell spreading | 32/2311 | 108/18723 | 1.36e-06 | 4.55e-05 | 32 |
| GO:001081110 | Cervix | CC | positive regulation of cell-substrate adhesion | 34/2311 | 123/18723 | 3.66e-06 | 9.68e-05 | 34 |
| GO:00107206 | Cervix | CC | positive regulation of cell development | 64/2311 | 298/18723 | 5.69e-06 | 1.41e-04 | 64 |
| GO:00107708 | Cervix | CC | positive regulation of cell morphogenesis involved in differentiation | 23/2311 | 79/18723 | 5.44e-05 | 8.04e-04 | 23 |
| GO:19000269 | Cervix | CC | positive regulation of substrate adhesion-dependent cell spreading | 15/2311 | 41/18723 | 6.11e-05 | 8.76e-04 | 15 |
| GO:0006909 | Cervix | CC | phagocytosis | 53/2311 | 308/18723 | 7.49e-03 | 4.01e-02 | 53 |
| GO:00103243 | Cervix | CC | membrane invagination | 28/2311 | 144/18723 | 9.50e-03 | 4.72e-02 | 28 |
| Pathway ID | Tissue | Disease Stage | Description | Gene Ratio | Bg Ratio | pvalue | p.adjust | qvalue | Count |
| hsa0513120 | Cervix | CC | Shigellosis | 69/1267 | 247/8465 | 7.64e-08 | 1.03e-06 | 6.10e-07 | 69 |
| hsa0451010 | Cervix | CC | Focal adhesion | 59/1267 | 203/8465 | 1.53e-07 | 1.84e-06 | 1.09e-06 | 59 |
| hsa0481016 | Cervix | CC | Regulation of actin cytoskeleton | 64/1267 | 229/8465 | 2.24e-07 | 2.59e-06 | 1.53e-06 | 64 |
| hsa0466612 | Cervix | CC | Fc gamma R-mediated phagocytosis | 31/1267 | 97/8465 | 1.78e-05 | 1.42e-04 | 8.40e-05 | 31 |
| hsa0513516 | Cervix | CC | Yersinia infection | 39/1267 | 137/8465 | 3.27e-05 | 2.41e-04 | 1.42e-04 | 39 |
| hsa0510020 | Cervix | CC | Bacterial invasion of epithelial cells | 23/1267 | 77/8465 | 6.25e-04 | 2.93e-03 | 1.73e-03 | 23 |
| hsa05131110 | Cervix | CC | Shigellosis | 69/1267 | 247/8465 | 7.64e-08 | 1.03e-06 | 6.10e-07 | 69 |
| hsa0451014 | Cervix | CC | Focal adhesion | 59/1267 | 203/8465 | 1.53e-07 | 1.84e-06 | 1.09e-06 | 59 |
| hsa0481017 | Cervix | CC | Regulation of actin cytoskeleton | 64/1267 | 229/8465 | 2.24e-07 | 2.59e-06 | 1.53e-06 | 64 |
| hsa0466613 | Cervix | CC | Fc gamma R-mediated phagocytosis | 31/1267 | 97/8465 | 1.78e-05 | 1.42e-04 | 8.40e-05 | 31 |
| hsa0513517 | Cervix | CC | Yersinia infection | 39/1267 | 137/8465 | 3.27e-05 | 2.41e-04 | 1.42e-04 | 39 |
| hsa05100110 | Cervix | CC | Bacterial invasion of epithelial cells | 23/1267 | 77/8465 | 6.25e-04 | 2.93e-03 | 1.73e-03 | 23 |
| hsa0513145 | Cervix | N_HPV | Shigellosis | 23/349 | 247/8465 | 2.10e-04 | 1.75e-03 | 1.37e-03 | 23 |
| hsa0510025 | Cervix | N_HPV | Bacterial invasion of epithelial cells | 10/349 | 77/8465 | 1.17e-03 | 7.93e-03 | 6.20e-03 | 10 |
| hsa0513155 | Cervix | N_HPV | Shigellosis | 23/349 | 247/8465 | 2.10e-04 | 1.75e-03 | 1.37e-03 | 23 |
| hsa0510035 | Cervix | N_HPV | Bacterial invasion of epithelial cells | 10/349 | 77/8465 | 1.17e-03 | 7.93e-03 | 6.20e-03 | 10 |
| hsa05131 | Colorectum | AD | Shigellosis | 109/2092 | 247/8465 | 1.09e-11 | 2.44e-10 | 1.55e-10 | 109 |
| hsa05100 | Colorectum | AD | Bacterial invasion of epithelial cells | 44/2092 | 77/8465 | 1.13e-09 | 2.22e-08 | 1.42e-08 | 44 |
| hsa04666 | Colorectum | AD | Fc gamma R-mediated phagocytosis | 46/2092 | 97/8465 | 9.10e-07 | 1.22e-05 | 7.77e-06 | 46 |
| hsa05135 | Colorectum | AD | Yersinia infection | 58/2092 | 137/8465 | 3.90e-06 | 4.35e-05 | 2.78e-05 | 58 |
| Hugo Symbol | Variant Class | Variant Classification | dbSNP RS | HGVSc | HGVSp | HGVSp Short | SWISSPROT | BIOTYPE | SIFT | PolyPhen | Tumor Sample Barcode | Tissue | Histology | Sex | Age | Stage | Therapy Types | Drugs | Outcome |
| DOCK1 | SNV | Missense_Mutation | rs774786886 | c.1295N>C | p.Arg432Pro | p.R432P | | protein_coding | deleterious(0) | probably_damaging(1) | TCGA-A2-A0EW-01 | Breast | breast invasive carcinoma | Female | <65 | III/IV | Chemotherapy | adriamycin | PD |
| DOCK1 | SNV | Missense_Mutation | | c.415C>A | p.Gln139Lys | p.Q139K | | protein_coding | tolerated(1) | benign(0.011) | TCGA-A2-A0YK-01 | Breast | breast invasive carcinoma | Female | <65 | I/II | Chemotherapy | cytoxan | SD |
| DOCK1 | SNV | Missense_Mutation | novel | c.4069N>G | p.Pro1357Ala | p.P1357A | | protein_coding | deleterious(0.02) | possibly_damaging(0.464) | TCGA-A7-A425-01 | Breast | breast invasive carcinoma | Female | >=65 | III/IV | Chemotherapy | adriamycin | PD |
| DOCK1 | SNV | Missense_Mutation | | c.1555N>A | p.Ala519Thr | p.A519T | | protein_coding | tolerated(0.12) | probably_damaging(1) | TCGA-A8-A09Z-01 | Breast | breast invasive carcinoma | Female | >=65 | I/II | Unknown | Unknown | SD |
| DOCK1 | SNV | Missense_Mutation | | c.550C>T | p.Leu184Phe | p.L184F | | protein_coding | deleterious(0) | probably_damaging(1) | TCGA-AC-A23H-01 | Breast | breast invasive carcinoma | Female | >=65 | I/II | Unknown | Unknown | PD |
| DOCK1 | SNV | Missense_Mutation | | c.2590N>A | p.Glu864Lys | p.E864K | | protein_coding | tolerated(0.61) | possibly_damaging(0.508) | TCGA-AN-A046-01 | Breast | breast invasive carcinoma | Female | >=65 | I/II | Unknown | Unknown | SD |
| DOCK1 | SNV | Missense_Mutation | rs559057300 | c.3379A>G | p.Ile1127Val | p.I1127V | | protein_coding | deleterious(0) | benign(0.28) | TCGA-AO-A128-01 | Breast | breast invasive carcinoma | Female | <65 | I/II | Chemotherapy | doxorubicin | SD |
| DOCK1 | SNV | Missense_Mutation | | c.746N>T | p.Pro249Leu | p.P249L | | protein_coding | deleterious(0.01) | possibly_damaging(0.856) | TCGA-AR-A250-01 | Breast | breast invasive carcinoma | Female | <65 | I/II | Chemotherapy | doxorubicin | SD |
| DOCK1 | SNV | Missense_Mutation | rs779842600 | c.1099N>G | p.Met367Val | p.M367V | | protein_coding | tolerated_low_confidence(0.08) | benign(0) | TCGA-BH-A0GY-01 | Breast | breast invasive carcinoma | Female | >=65 | I/II | Chemotherapy | cyotxan | SD |
| DOCK1 | SNV | Missense_Mutation | rs571051175 | c.4990C>T | p.Arg1664Cys | p.R1664C | | protein_coding | deleterious(0) | probably_damaging(0.999) | TCGA-BH-A18G-01 | Breast | breast invasive carcinoma | Female | >=65 | I/II | Unknown | Unknown | SD |


