
|
|||||
|
 | |
| |
| |
| |
| |
| |
|
Gene: CD99 |
Gene summary for CD99 |
| Gene information | Species | Human | Gene symbol | CD99 | Gene ID | 4267 |
| Gene name | CD99 molecule (Xg blood group) | |
| Gene Alias | HBA71 | |
| Cytomap | X | |
| Gene Type | protein-coding | GO ID | GO:0002376 | UniProtAcc | P14209 |
Top |
Malignant transformation analysis |
| Identification of the aberrant gene expression in precancerous and cancerous lesions by comparing the gene expression of stem-like cells in diseased tissues with normal stem cells |
| Entrez ID | Symbol | Replicates | Species | Organ | Tissue | Adj P-value | Log2FC | Malignancy |
| 4267 | CD99 | Pt13.b | Human | Liver | HCC | 3.30e-31 | 4.01e-01 | 0.0251 |
| 4267 | CD99 | Pt14.b | Human | Liver | HCC | 4.99e-05 | 1.73e-01 | 0.018 |
| 4267 | CD99 | S014 | Human | Liver | HCC | 4.69e-35 | 2.45e+00 | 0.2254 |
| 4267 | CD99 | S015 | Human | Liver | HCC | 5.38e-32 | 2.87e+00 | 0.2375 |
| 4267 | CD99 | S016 | Human | Liver | HCC | 3.58e-35 | 3.11e+00 | 0.2243 |
| 4267 | CD99 | S027 | Human | Liver | HCC | 4.31e-22 | 2.81e+00 | 0.2446 |
| 4267 | CD99 | S028 | Human | Liver | HCC | 6.79e-42 | 3.12e+00 | 0.2503 |
| 4267 | CD99 | S029 | Human | Liver | HCC | 9.18e-48 | 3.54e+00 | 0.2581 |
| 4267 | CD99 | C04 | Human | Oral cavity | OSCC | 3.88e-27 | 2.15e+00 | 0.2633 |
| 4267 | CD99 | C21 | Human | Oral cavity | OSCC | 3.28e-57 | 2.90e+00 | 0.2678 |
| 4267 | CD99 | C30 | Human | Oral cavity | OSCC | 2.62e-43 | 2.43e+00 | 0.3055 |
| 4267 | CD99 | C38 | Human | Oral cavity | OSCC | 3.48e-29 | 2.71e+00 | 0.172 |
| 4267 | CD99 | C43 | Human | Oral cavity | OSCC | 1.81e-110 | 2.84e+00 | 0.1704 |
| 4267 | CD99 | C46 | Human | Oral cavity | OSCC | 1.10e-50 | 1.53e+00 | 0.1673 |
| 4267 | CD99 | C51 | Human | Oral cavity | OSCC | 1.95e-39 | 2.63e+00 | 0.2674 |
| 4267 | CD99 | C57 | Human | Oral cavity | OSCC | 4.45e-37 | 1.90e+00 | 0.1679 |
| 4267 | CD99 | C06 | Human | Oral cavity | OSCC | 1.39e-27 | 2.32e+00 | 0.2699 |
| 4267 | CD99 | C07 | Human | Oral cavity | OSCC | 2.04e-16 | 2.54e+00 | 0.2491 |
| 4267 | CD99 | C08 | Human | Oral cavity | OSCC | 4.78e-55 | 1.57e+00 | 0.1919 |
| 4267 | CD99 | C86 | Human | Oral cavity | OSCC | 7.92e-03 | 1.14e+00 | 0.161 |
| Page: 1 2 3 4 5 6 7 8 9 10 11 12 13 14 |
| Tissue | Expression Dynamics | Abbreviation |
| Breast |  | IDC: Invasive ductal carcinoma |
| DCIS: Ductal carcinoma in situ | ||
| Precancer(BRCA1-mut): Precancerous lesion from BRCA1 mutation carriers | ||
| Cervix | 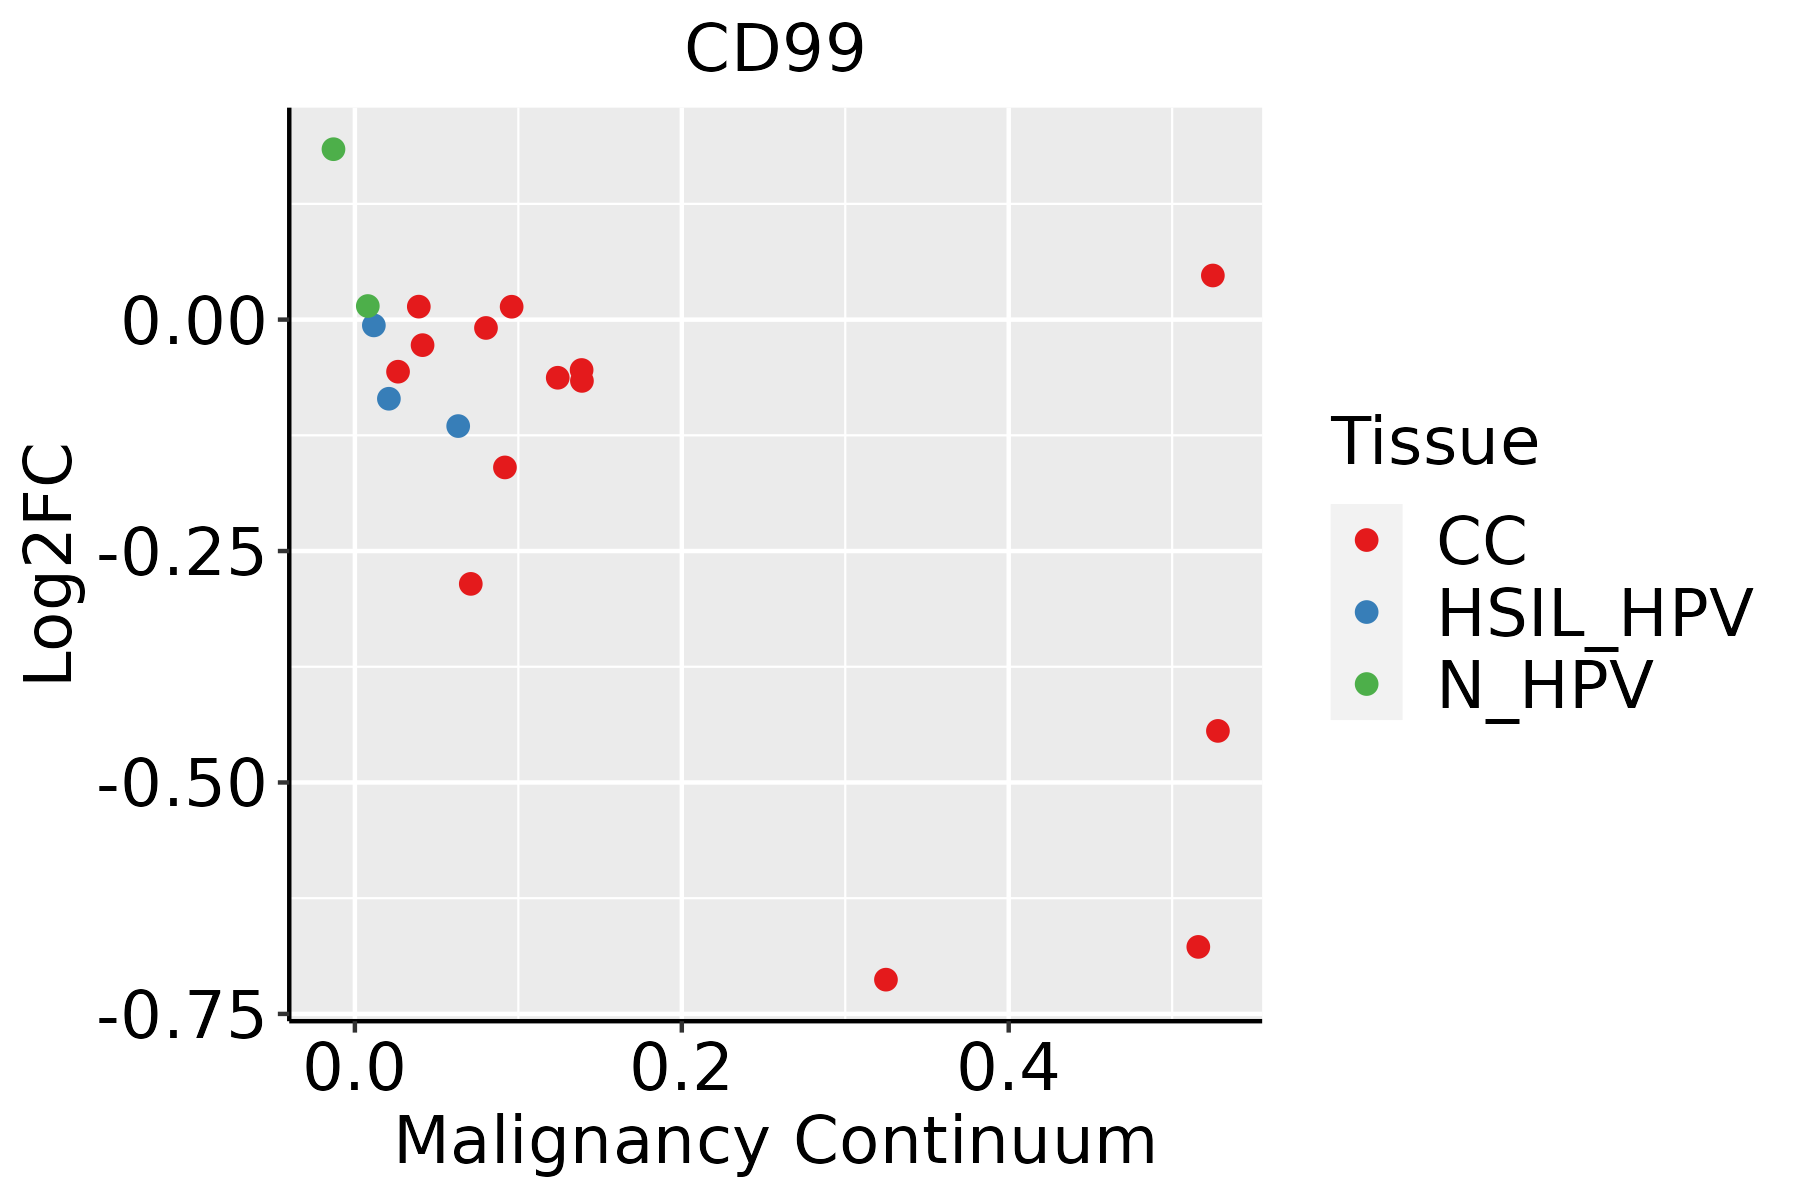 | CC: Cervix cancer |
| HSIL_HPV: HPV-infected high-grade squamous intraepithelial lesions | ||
| N_HPV: HPV-infected normal cervix | ||
| Colorectum (GSE201348) | 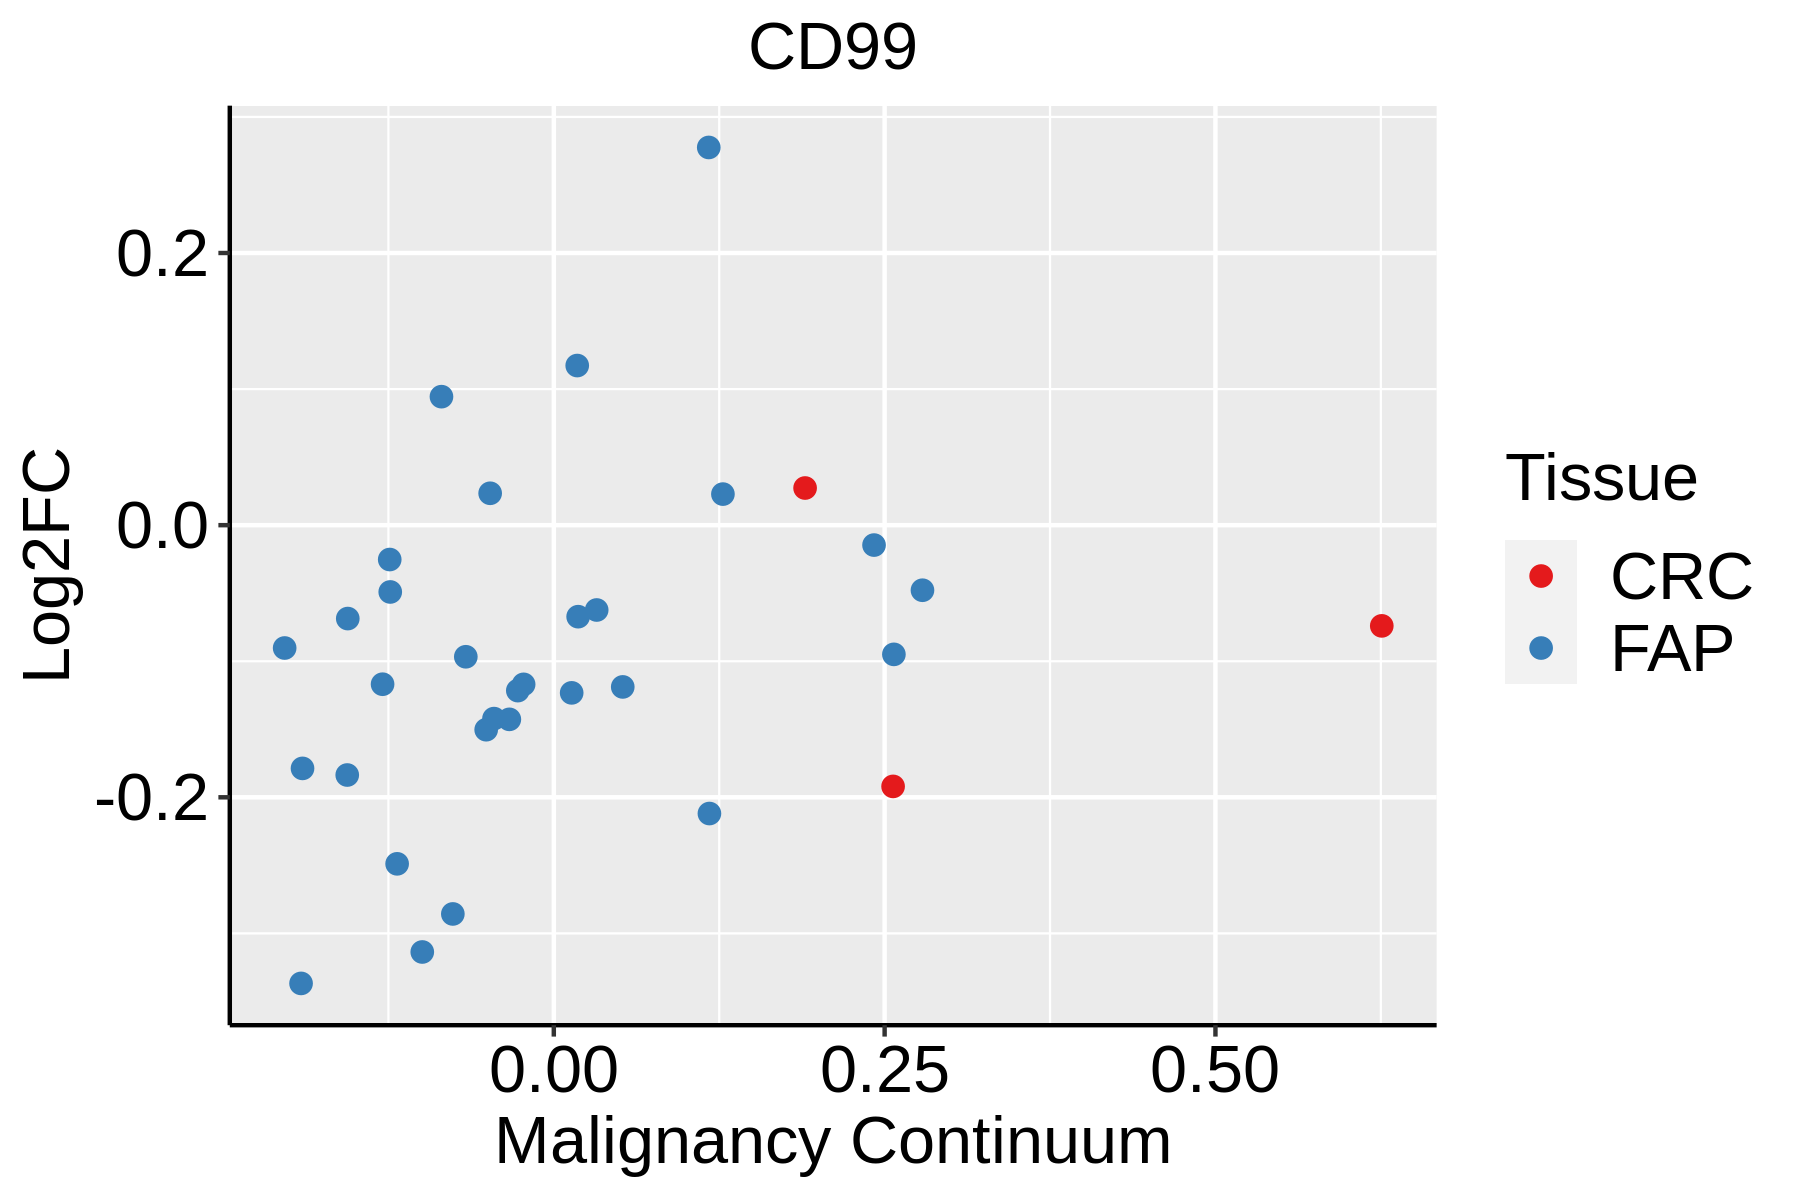 | FAP: Familial adenomatous polyposis |
| CRC: Colorectal cancer | ||
| Colorectum (HTA11) |  | AD: Adenomas |
| SER: Sessile serrated lesions | ||
| MSI-H: Microsatellite-high colorectal cancer | ||
| MSS: Microsatellite stable colorectal cancer | ||
| Endometrium | 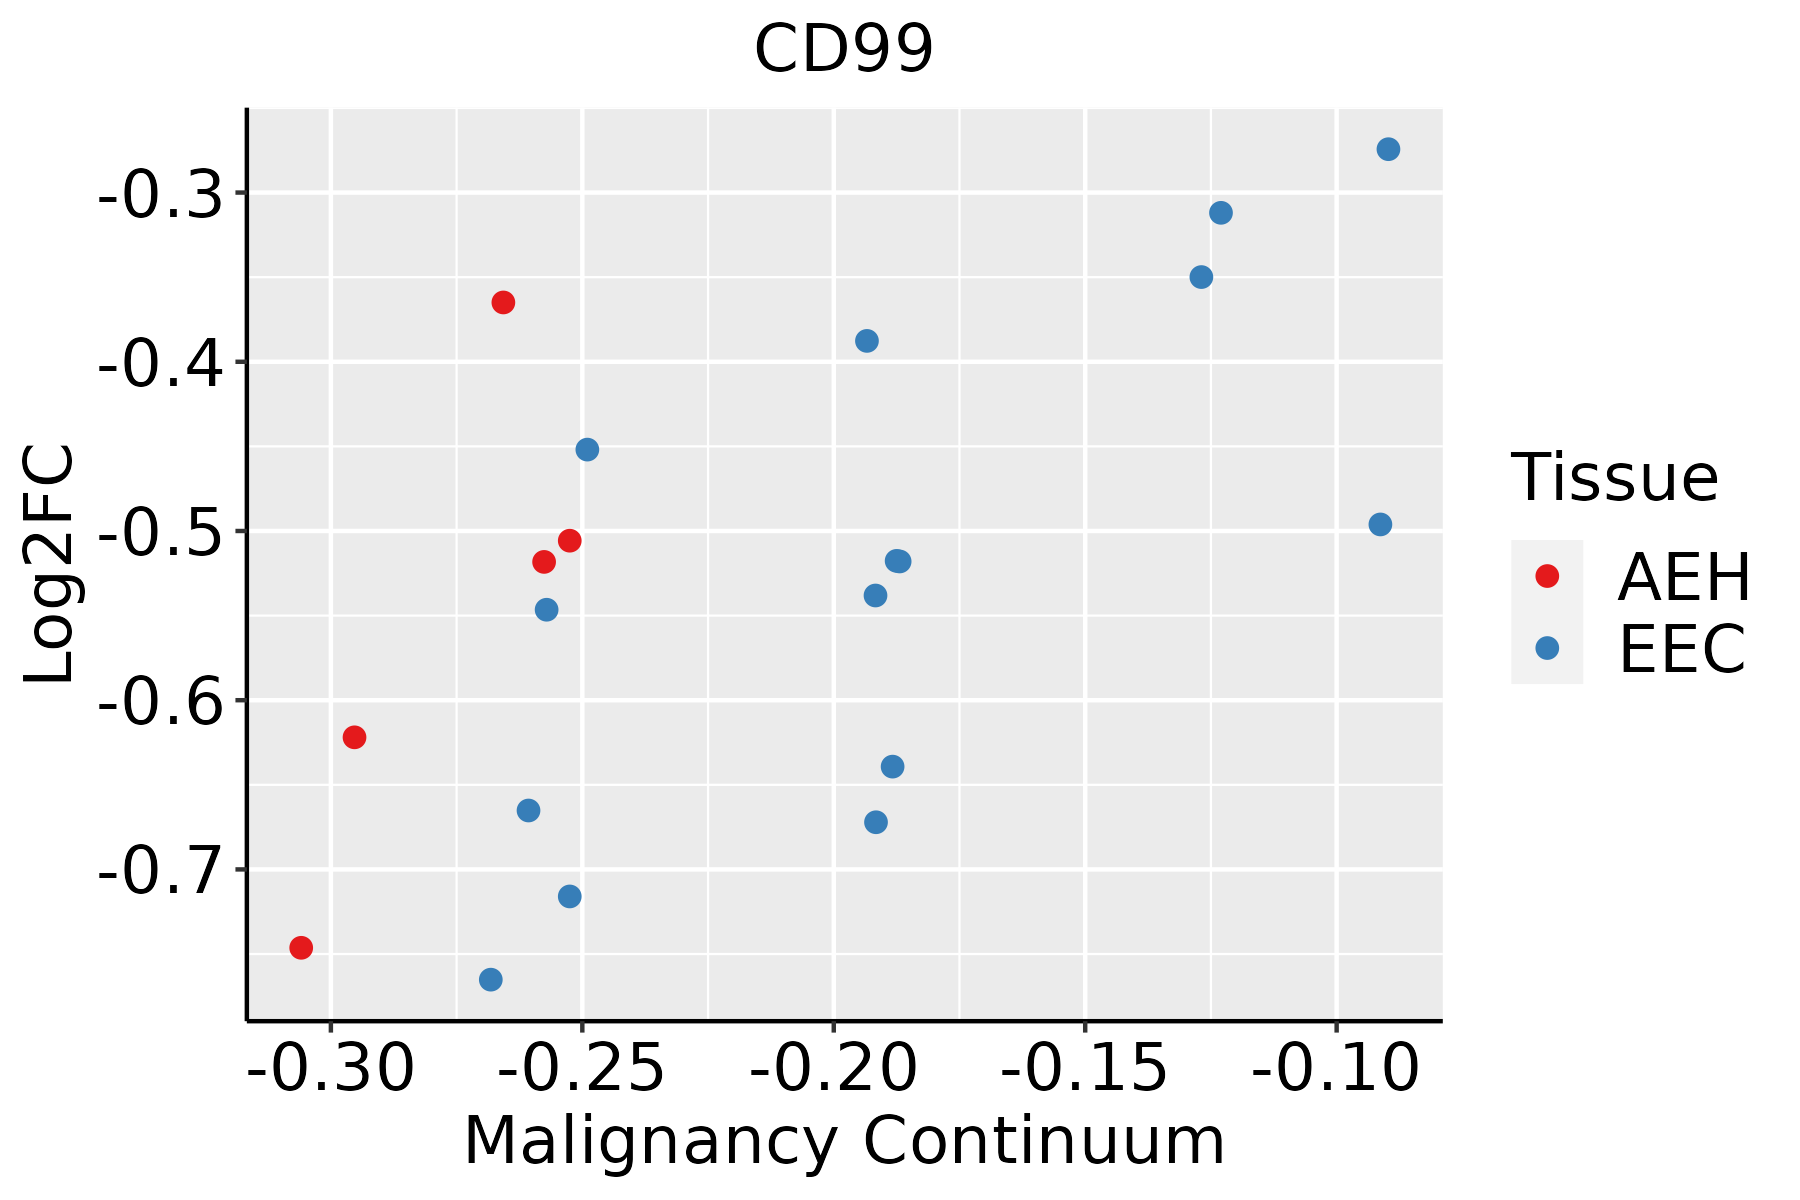 | AEH: Atypical endometrial hyperplasia |
| EEC: Endometrioid Cancer | ||
| Esophagus | 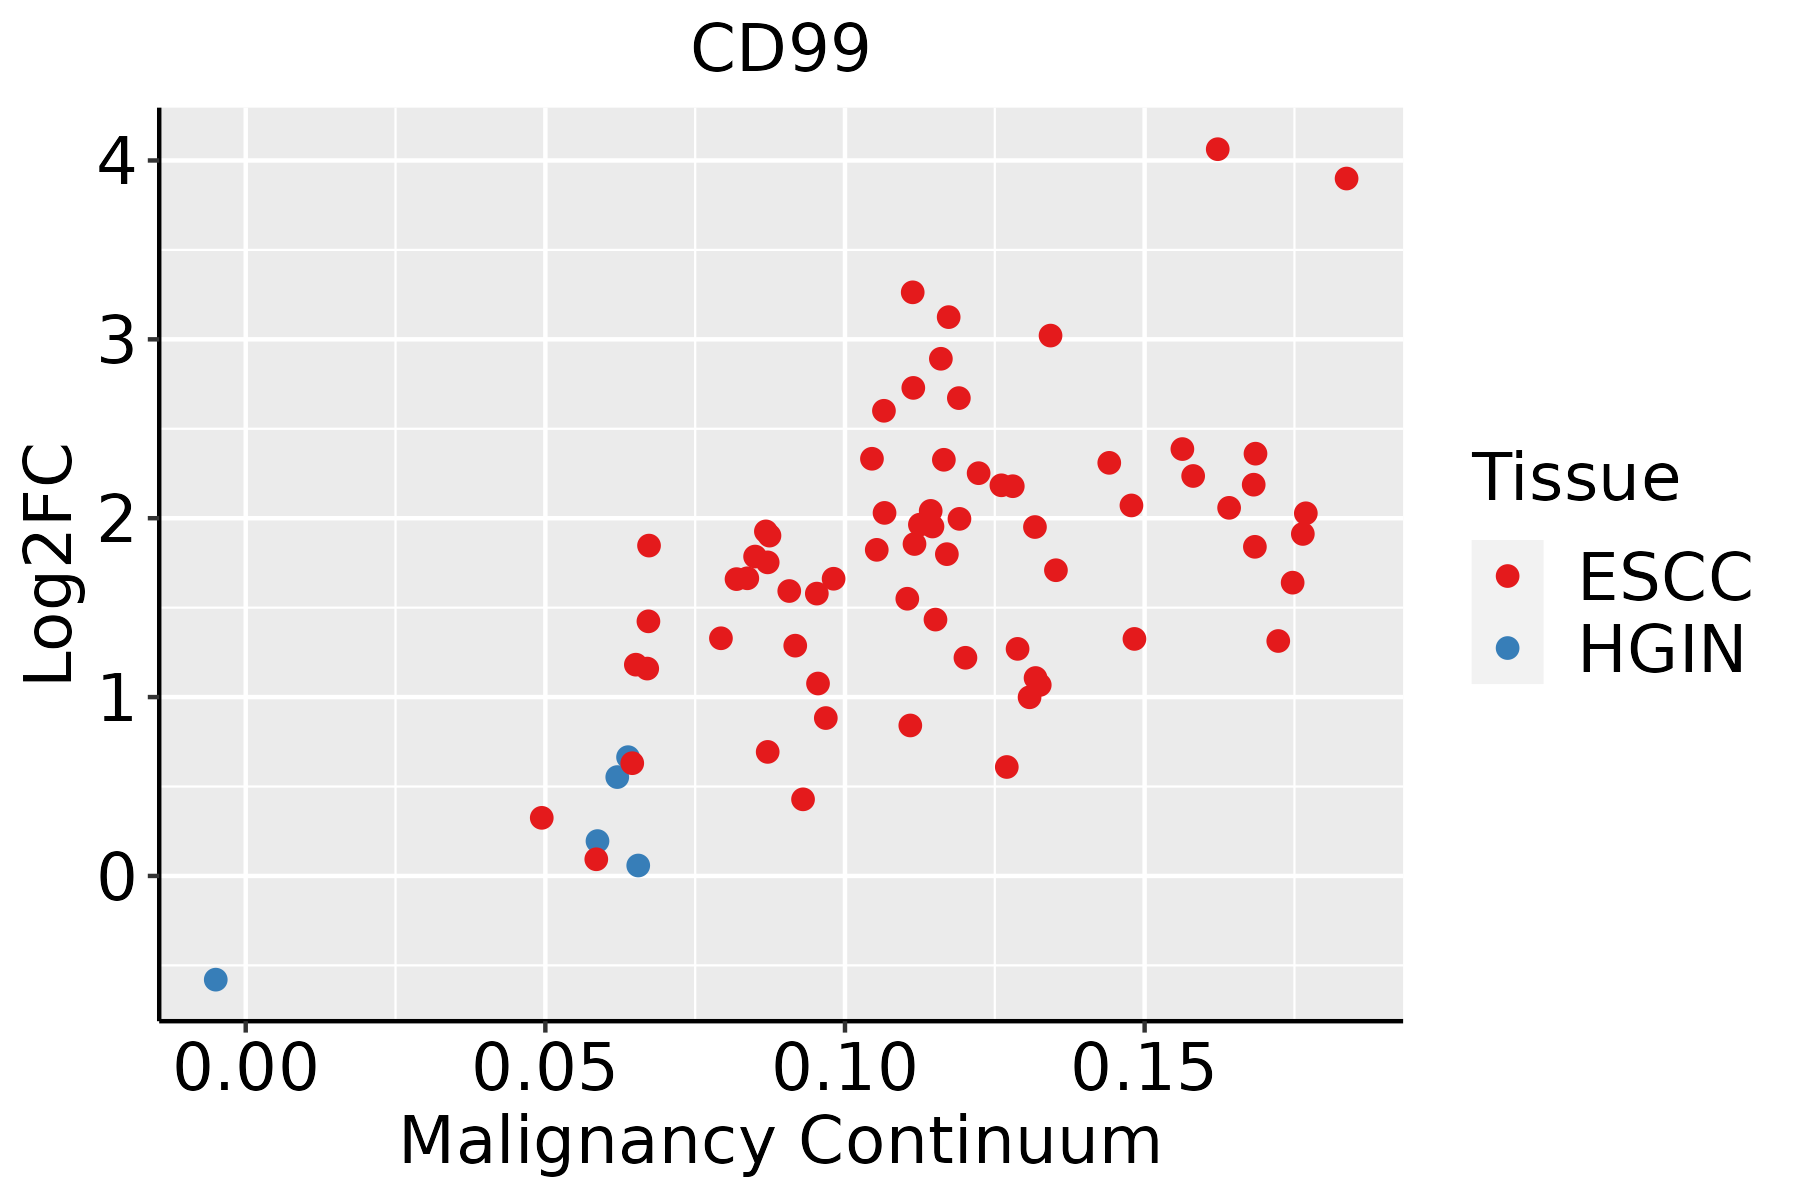 | ESCC: Esophageal squamous cell carcinoma |
| HGIN: High-grade intraepithelial neoplasias | ||
| LGIN: Low-grade intraepithelial neoplasias | ||
| GC | 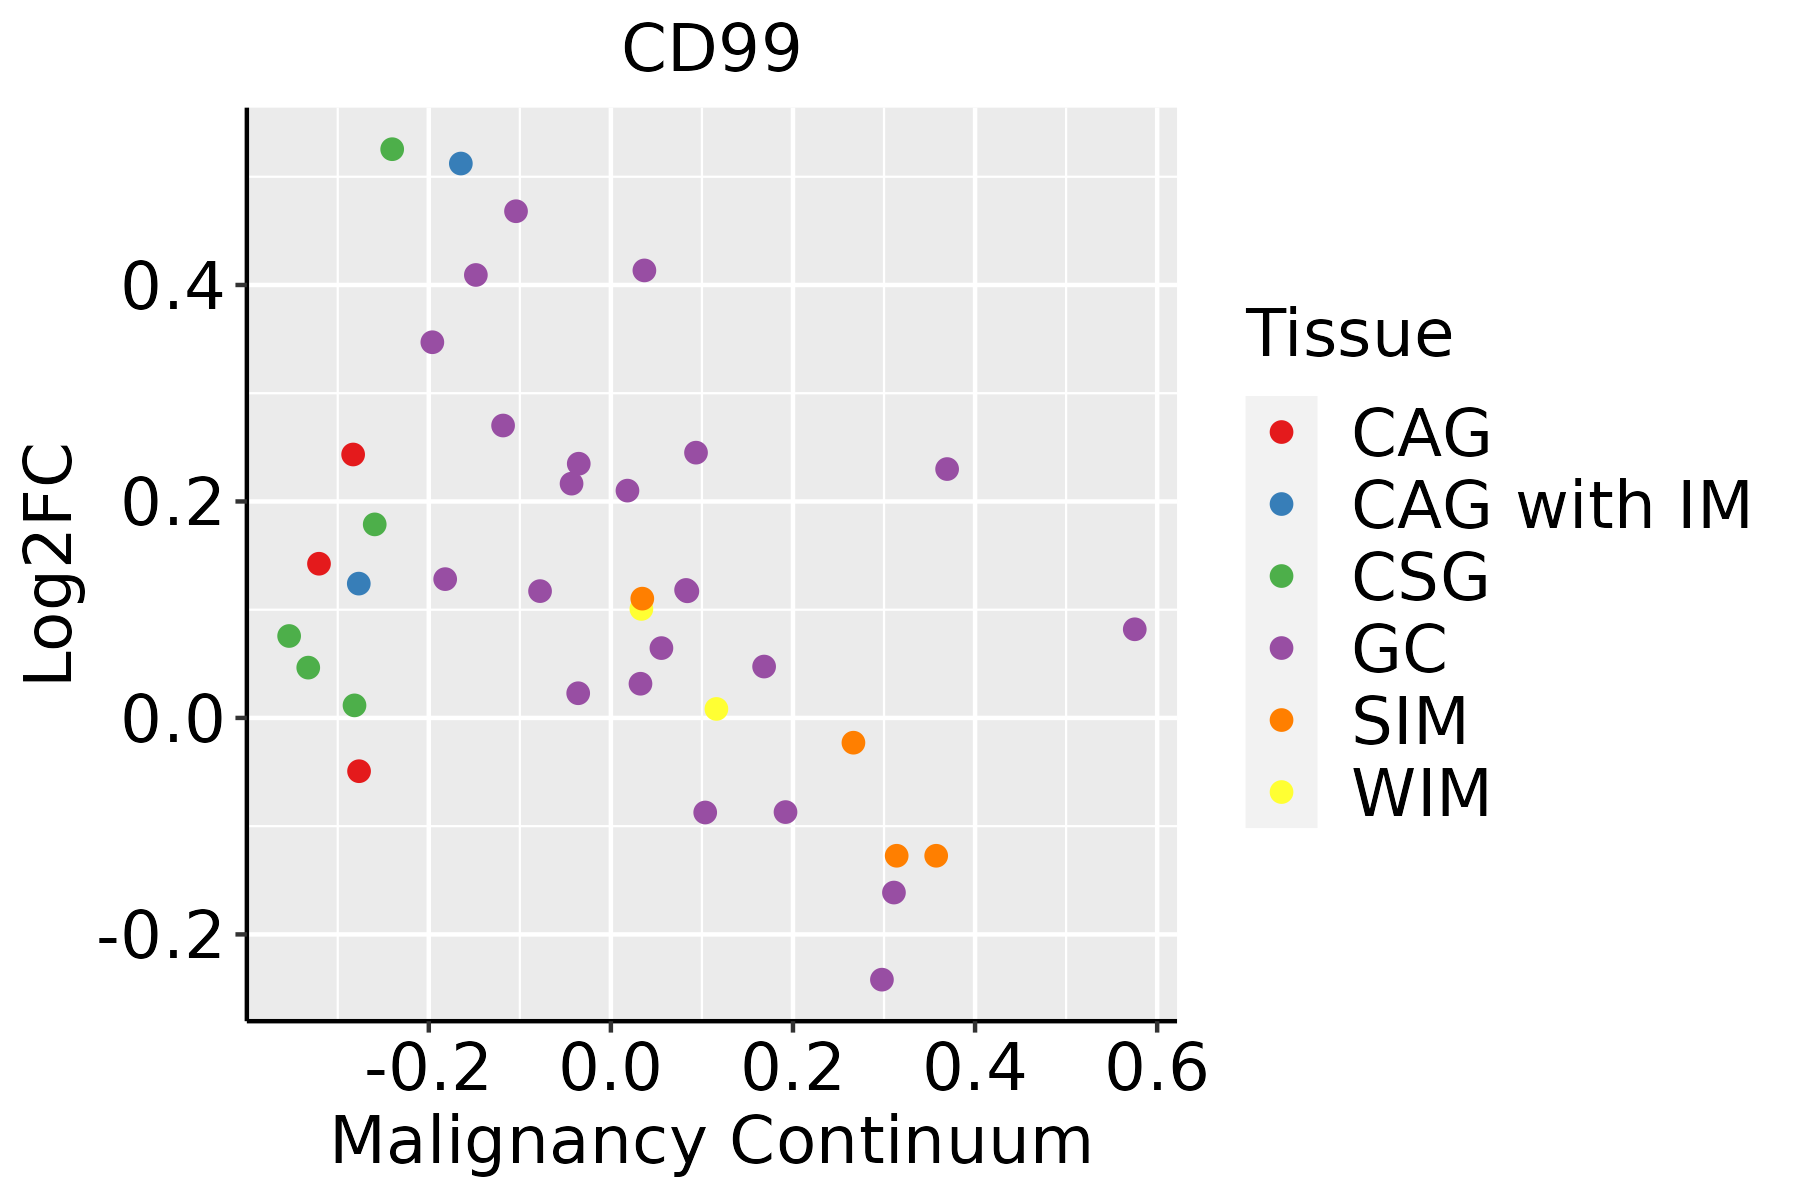 | CAG: Chronic atrophic gastritis |
| CAG with IM: Chronic atrophic gastritis with intestinal metaplasia | ||
| CSG: Chronic superficial gastritis | ||
| GC: Gastric cancer | ||
| SIM: Severe intestinal metaplasia | ||
| WIM: Wild intestinal metaplasia | ||
| Liver | 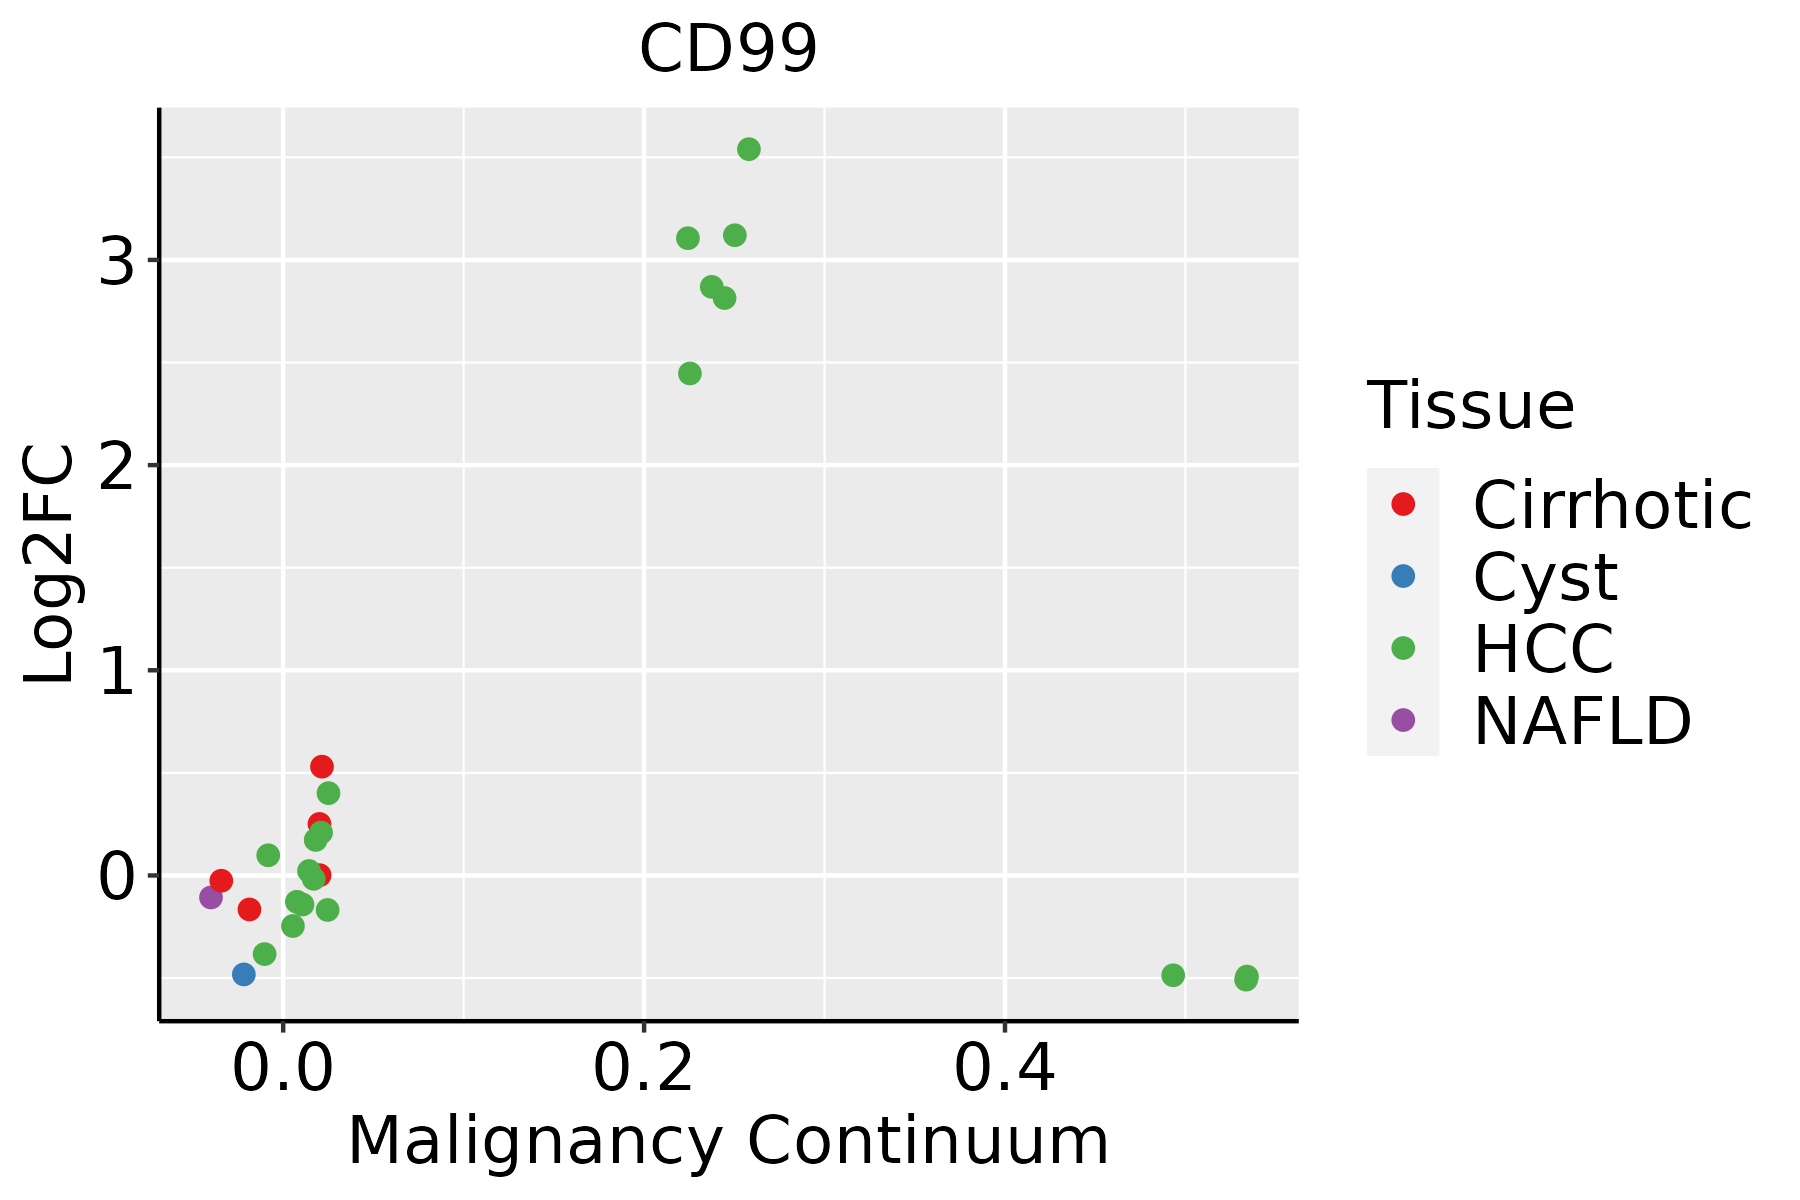 | HCC: Hepatocellular carcinoma |
| NAFLD: Non-alcoholic fatty liver disease | ||
| Oral Cavity | 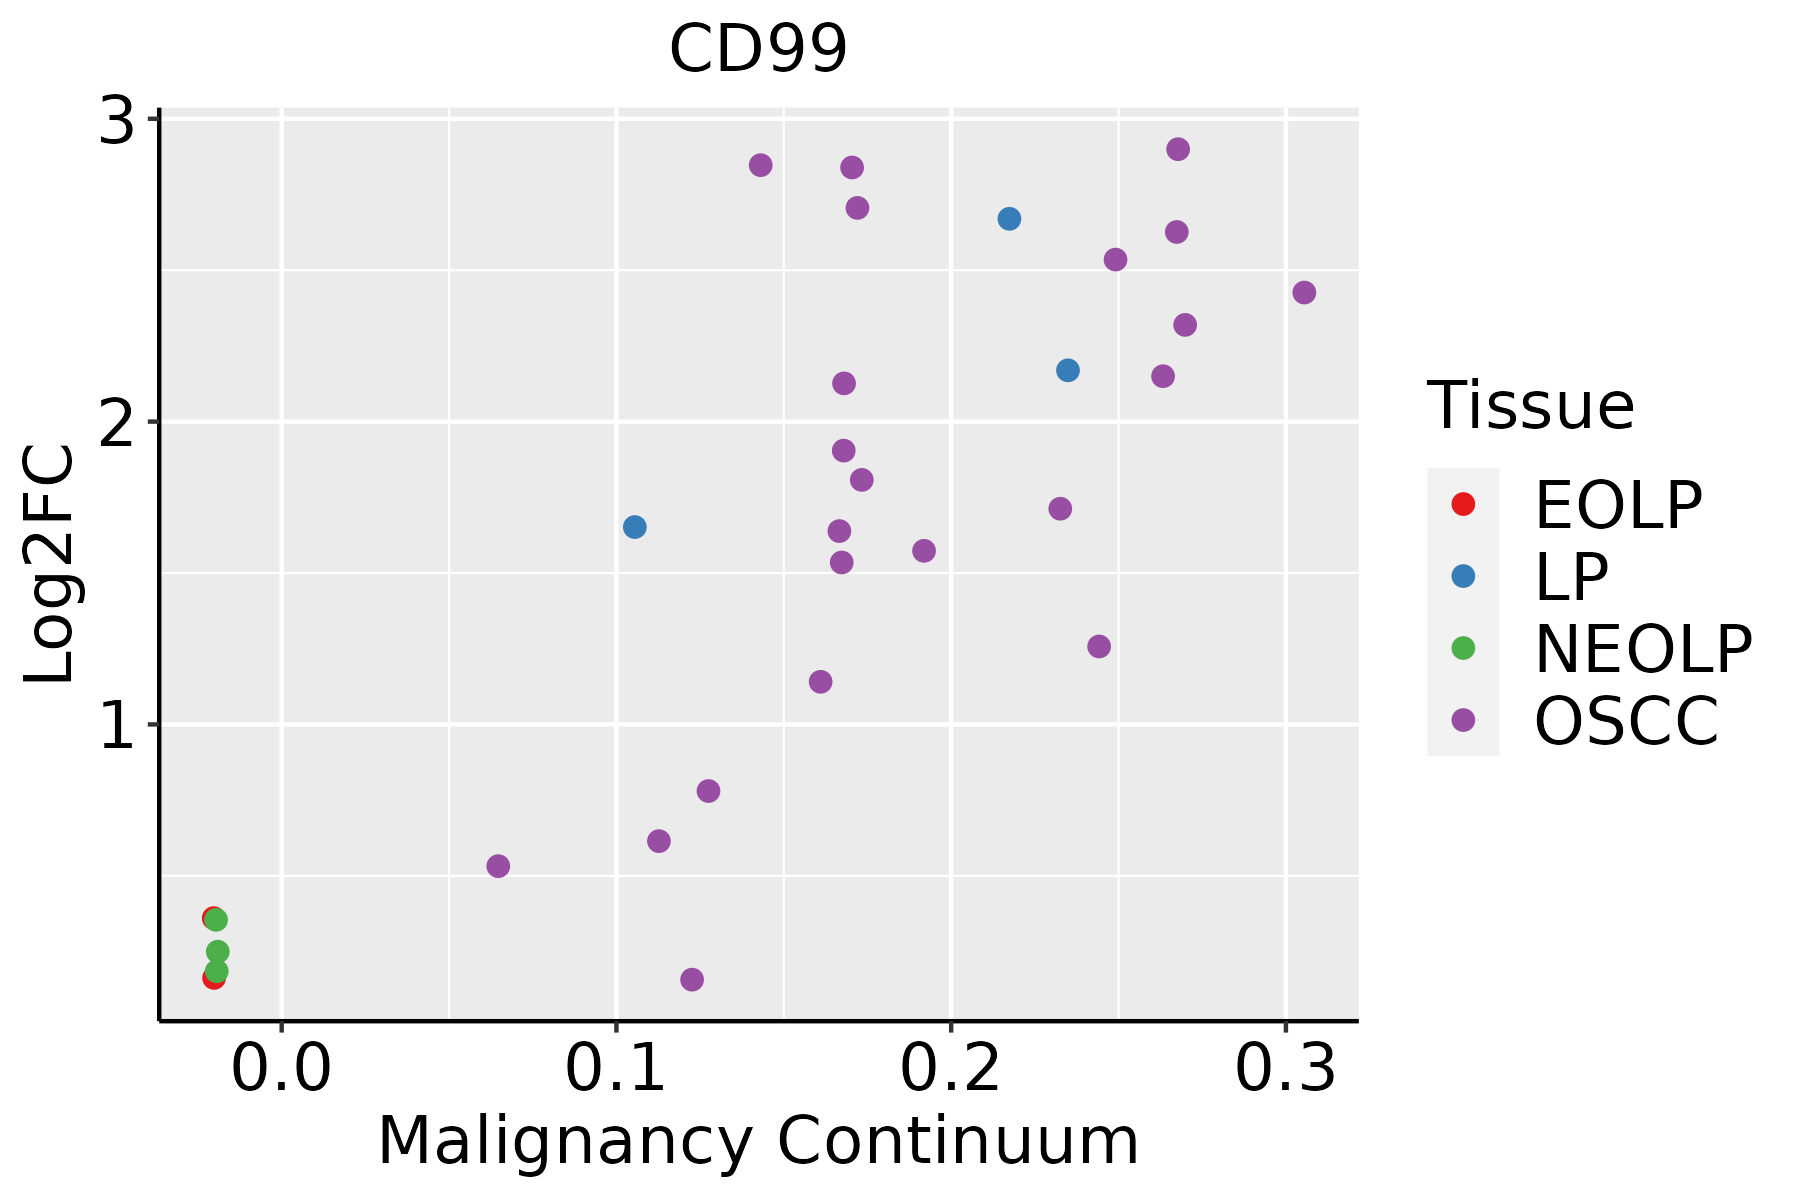 | EOLP: Erosive Oral lichen planus |
| LP: leukoplakia | ||
| NEOLP: Non-erosive oral lichen planus | ||
| OSCC: Oral squamous cell carcinoma | ||
| Prostate |  | BPH: Benign Prostatic Hyperplasia |
| Skin | 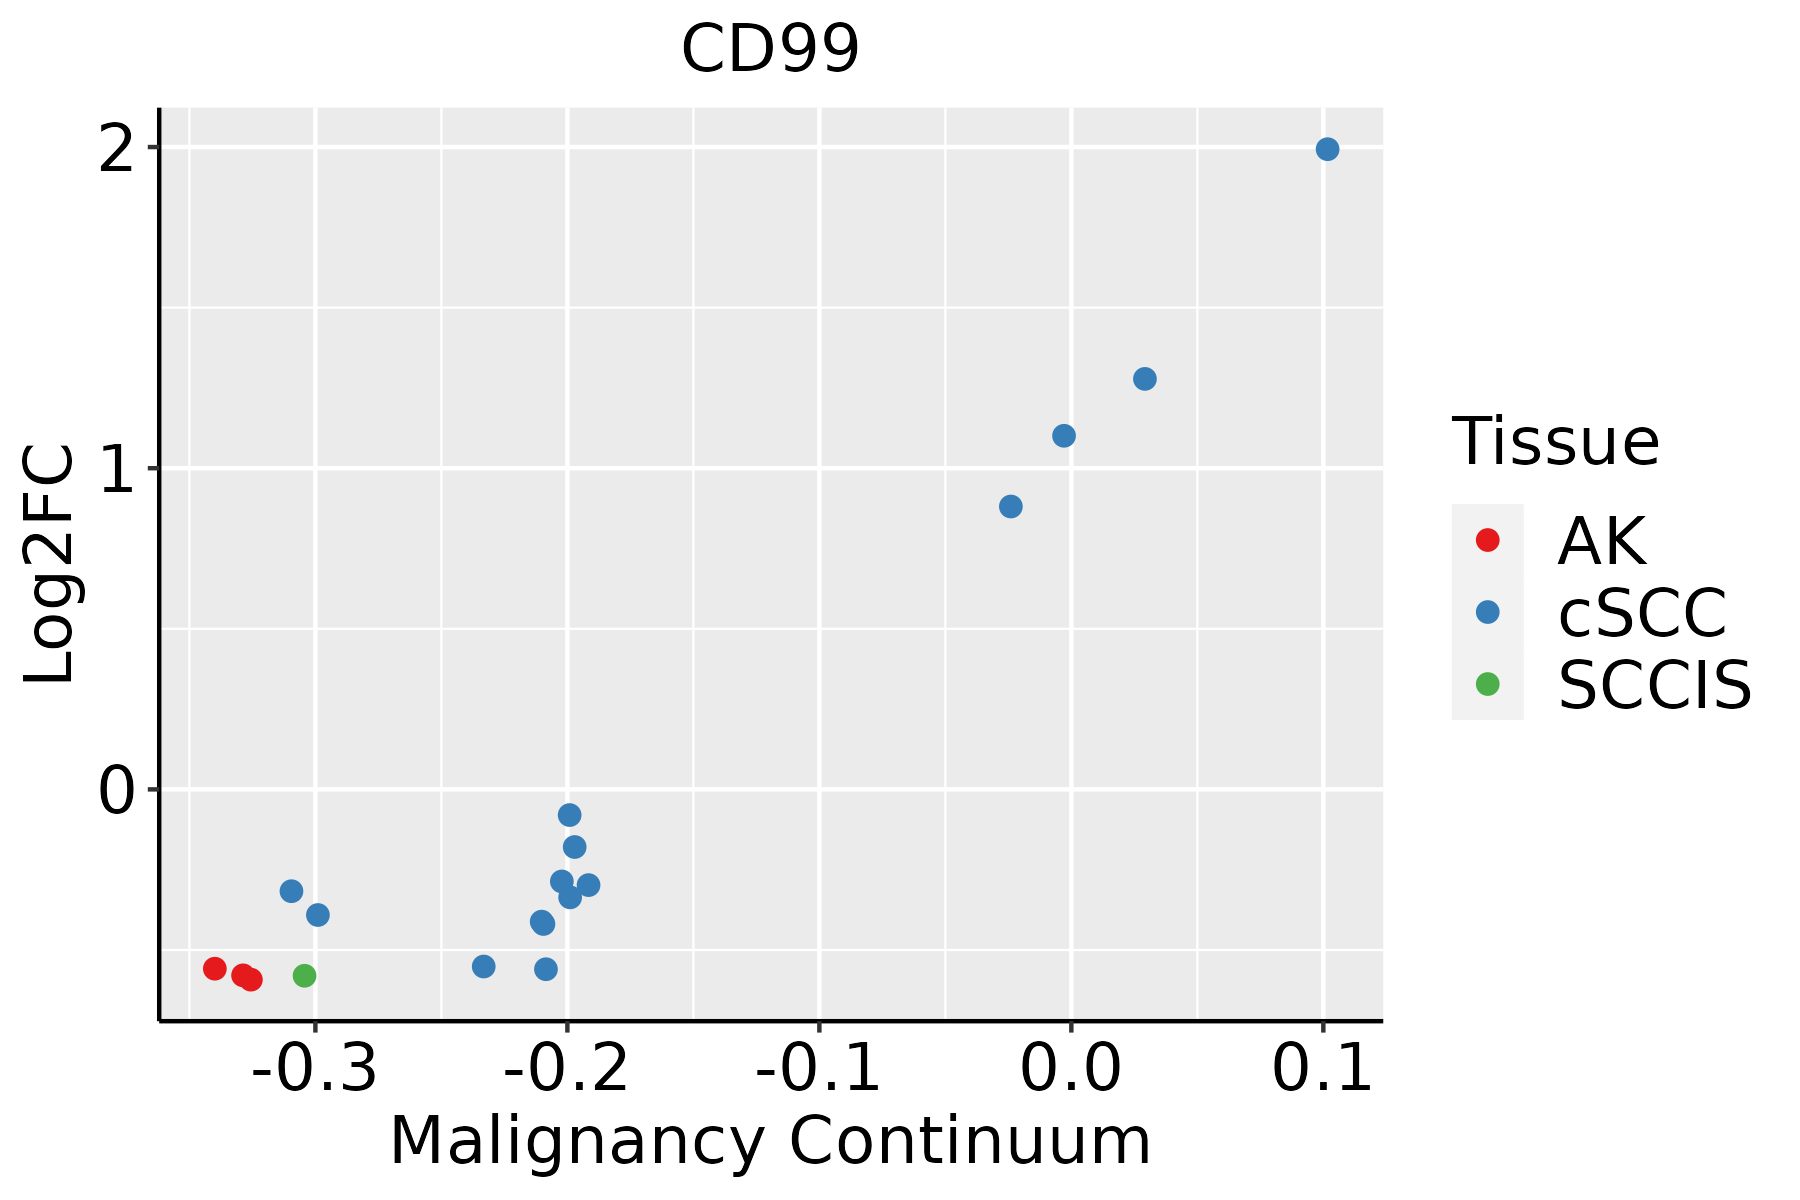 | AK: Actinic keratosis |
| cSCC: Cutaneous squamous cell carcinoma | ||
| SCCIS:squamous cell carcinoma in situ | ||
| Thyroid | 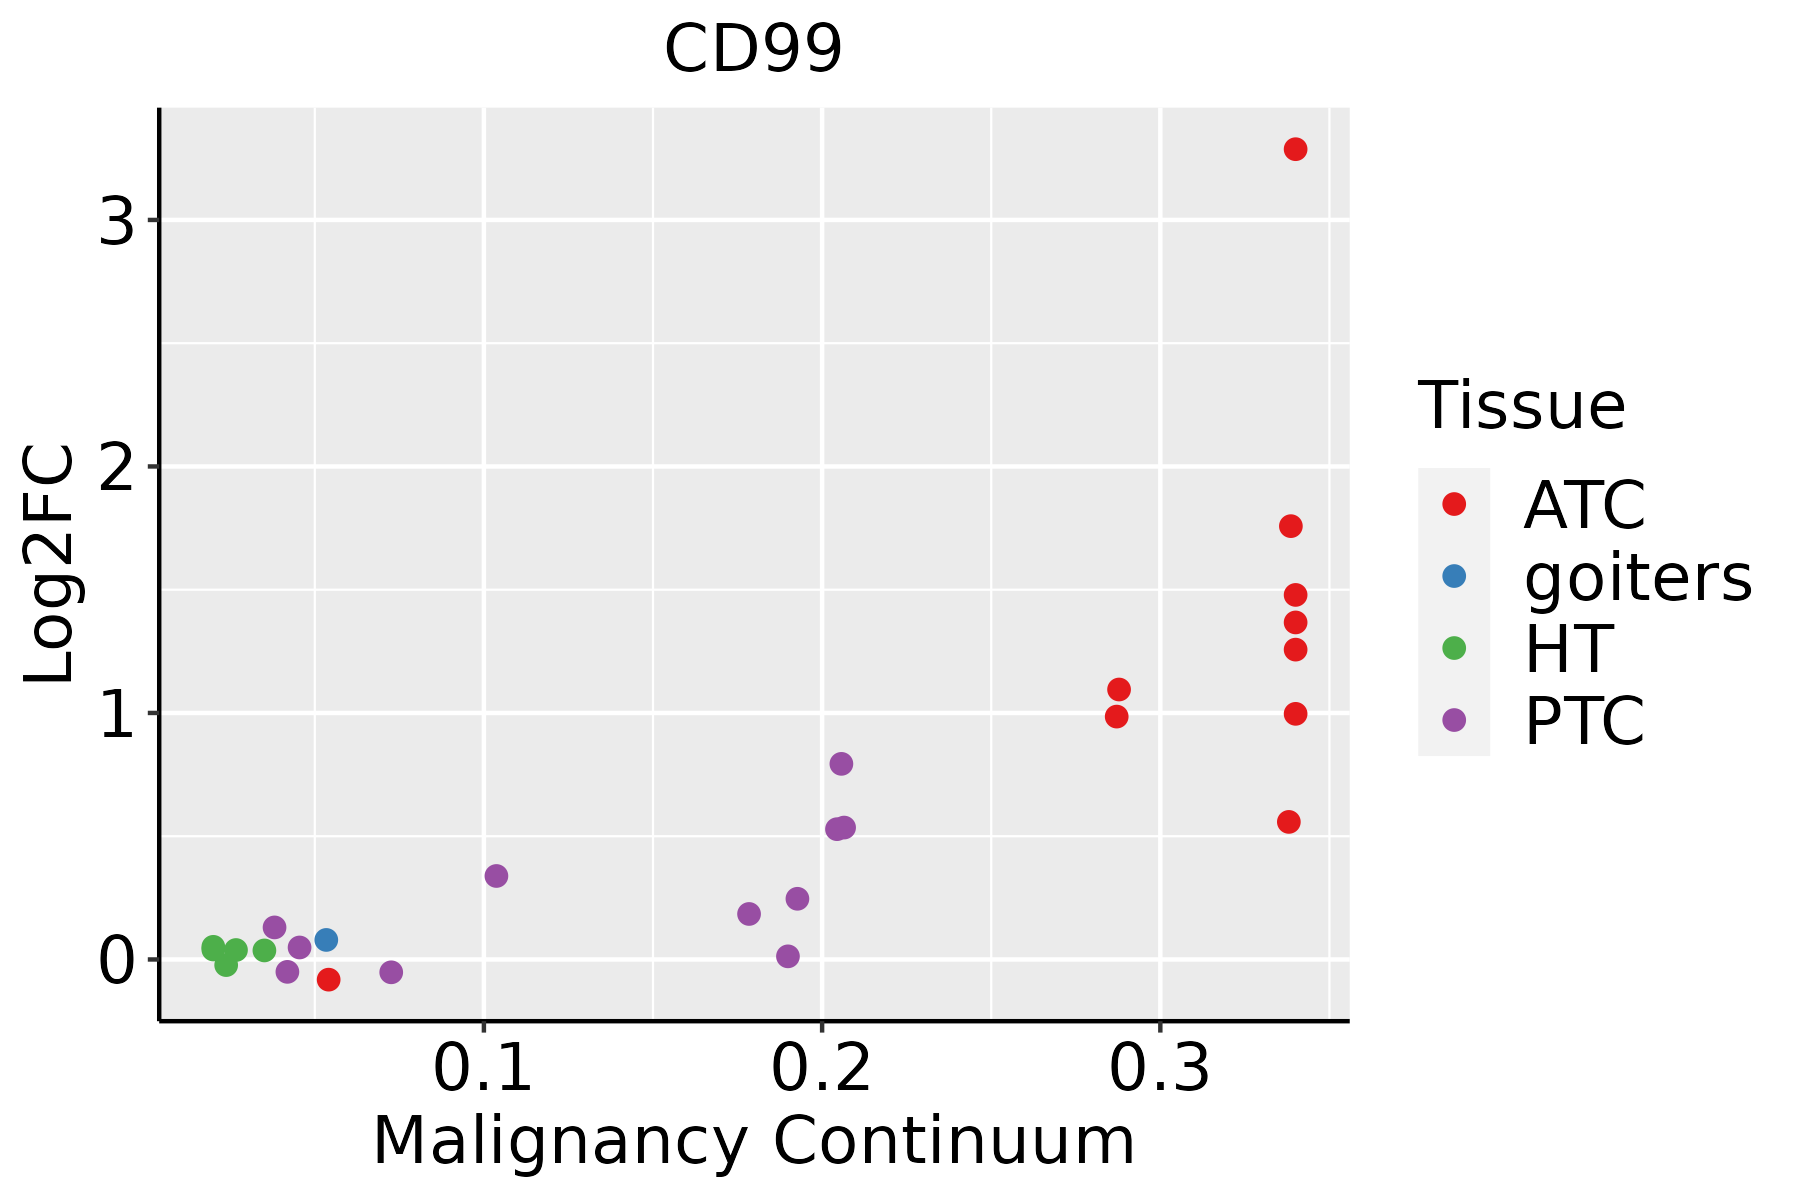 | ATC: Anaplastic thyroid cancer |
| HT: Hashimoto's thyroiditis | ||
| PTC: Papillary thyroid cancer |
| ∗log2FC in expression of this searched gene in stem-like cells from each diseased tissue sample relative to stem-like cells in normal samples in each tissue plotted against the malignancy continuum. Samples are colored based on if they are from different disease stage. |
Top |
Malignant transformation related pathway analysis |
| Find out the enriched GO biological processes and KEGG pathways involved in transition from healthy to precancer to cancer |
| Tissue | Disease Stage | Enriched GO biological Processes |
| Colorectum | AD |  |
| Colorectum | SER |  |
| Colorectum | MSS |  |
| Colorectum | MSI-H |  |
| Colorectum | FAP |  |
| ∗Top 15 enriched GO BP terms are showed in the bar plot of each disease state in each tissue. Each row represents a significant GO biological process which is colored according to the -log10(p.adjust). |
| Page: 1 2 3 4 5 6 7 8 9 |
| GO ID | Tissue | Disease Stage | Description | Gene Ratio | Bg Ratio | pvalue | p.adjust | Count |
| GO:00975297 | Breast | Precancer | myeloid leukocyte migration | 34/1080 | 220/18723 | 1.42e-07 | 7.82e-06 | 34 |
| GO:00509006 | Breast | Precancer | leukocyte migration | 47/1080 | 369/18723 | 2.82e-07 | 1.39e-05 | 47 |
| GO:00341099 | Breast | Precancer | homotypic cell-cell adhesion | 18/1080 | 90/18723 | 3.15e-06 | 1.03e-04 | 18 |
| GO:00975307 | Breast | Precancer | granulocyte migration | 24/1080 | 148/18723 | 4.04e-06 | 1.26e-04 | 24 |
| GO:19902665 | Breast | Precancer | neutrophil migration | 20/1080 | 122/18723 | 2.13e-05 | 4.99e-04 | 20 |
| GO:00026856 | Breast | Precancer | regulation of leukocyte migration | 27/1080 | 210/18723 | 7.93e-05 | 1.54e-03 | 27 |
| GO:00716744 | Breast | Precancer | mononuclear cell migration | 24/1080 | 196/18723 | 4.03e-04 | 5.44e-03 | 24 |
| GO:00026877 | Breast | Precancer | positive regulation of leukocyte migration | 18/1080 | 135/18723 | 7.60e-04 | 9.04e-03 | 18 |
| GO:005090011 | Breast | IDC | leukocyte migration | 54/1434 | 369/18723 | 3.10e-06 | 1.15e-04 | 54 |
| GO:009752911 | Breast | IDC | myeloid leukocyte migration | 37/1434 | 220/18723 | 4.65e-06 | 1.62e-04 | 37 |
| GO:003410913 | Breast | IDC | homotypic cell-cell adhesion | 20/1434 | 90/18723 | 1.20e-05 | 3.17e-04 | 20 |
| GO:009753011 | Breast | IDC | granulocyte migration | 27/1434 | 148/18723 | 1.98e-05 | 4.88e-04 | 27 |
| GO:199026611 | Breast | IDC | neutrophil migration | 23/1434 | 122/18723 | 4.67e-05 | 1.04e-03 | 23 |
| GO:000268511 | Breast | IDC | regulation of leukocyte migration | 33/1434 | 210/18723 | 6.10e-05 | 1.27e-03 | 33 |
| GO:007167411 | Breast | IDC | mononuclear cell migration | 29/1434 | 196/18723 | 4.68e-04 | 6.26e-03 | 29 |
| GO:000268711 | Breast | IDC | positive regulation of leukocyte migration | 21/1434 | 135/18723 | 1.42e-03 | 1.46e-02 | 21 |
| GO:0072678 | Breast | IDC | T cell migration | 12/1434 | 66/18723 | 3.99e-03 | 3.23e-02 | 12 |
| GO:009752921 | Breast | DCIS | myeloid leukocyte migration | 38/1390 | 220/18723 | 8.44e-07 | 3.44e-05 | 38 |
| GO:005090021 | Breast | DCIS | leukocyte migration | 54/1390 | 369/18723 | 1.22e-06 | 4.78e-05 | 54 |
| GO:009753021 | Breast | DCIS | granulocyte migration | 27/1390 | 148/18723 | 1.13e-05 | 2.92e-04 | 27 |
| Page: 1 2 3 4 5 6 7 8 |
| Pathway ID | Tissue | Disease Stage | Description | Gene Ratio | Bg Ratio | pvalue | p.adjust | qvalue | Count |
| hsa0467018 | Breast | Precancer | Leukocyte transendothelial migration | 20/684 | 114/8465 | 7.26e-04 | 5.33e-03 | 4.09e-03 | 20 |
| hsa0467019 | Breast | Precancer | Leukocyte transendothelial migration | 20/684 | 114/8465 | 7.26e-04 | 5.33e-03 | 4.09e-03 | 20 |
| hsa0467024 | Breast | IDC | Leukocyte transendothelial migration | 21/867 | 114/8465 | 5.41e-03 | 3.13e-02 | 2.34e-02 | 21 |
| hsa0467034 | Breast | IDC | Leukocyte transendothelial migration | 21/867 | 114/8465 | 5.41e-03 | 3.13e-02 | 2.34e-02 | 21 |
| hsa0467044 | Breast | DCIS | Leukocyte transendothelial migration | 21/846 | 114/8465 | 4.07e-03 | 2.31e-02 | 1.70e-02 | 21 |
| hsa0467054 | Breast | DCIS | Leukocyte transendothelial migration | 21/846 | 114/8465 | 4.07e-03 | 2.31e-02 | 1.70e-02 | 21 |
| hsa0467020 | Cervix | CC | Leukocyte transendothelial migration | 36/1267 | 114/8465 | 5.22e-06 | 4.83e-05 | 2.86e-05 | 36 |
| hsa04670110 | Cervix | CC | Leukocyte transendothelial migration | 36/1267 | 114/8465 | 5.22e-06 | 4.83e-05 | 2.86e-05 | 36 |
| hsa0451441 | Cervix | N_HPV | Cell adhesion molecules | 18/349 | 157/8465 | 7.71e-05 | 8.06e-04 | 6.30e-04 | 18 |
| hsa0467045 | Cervix | N_HPV | Leukocyte transendothelial migration | 12/349 | 114/8465 | 2.50e-03 | 1.45e-02 | 1.13e-02 | 12 |
| hsa0451451 | Cervix | N_HPV | Cell adhesion molecules | 18/349 | 157/8465 | 7.71e-05 | 8.06e-04 | 6.30e-04 | 18 |
| hsa0467055 | Cervix | N_HPV | Leukocyte transendothelial migration | 12/349 | 114/8465 | 2.50e-03 | 1.45e-02 | 1.13e-02 | 12 |
| hsa04670 | Colorectum | AD | Leukocyte transendothelial migration | 41/2092 | 114/8465 | 4.60e-03 | 2.20e-02 | 1.40e-02 | 41 |
| hsa046701 | Colorectum | AD | Leukocyte transendothelial migration | 41/2092 | 114/8465 | 4.60e-03 | 2.20e-02 | 1.40e-02 | 41 |
| hsa046702 | Colorectum | SER | Leukocyte transendothelial migration | 37/1580 | 114/8465 | 2.77e-04 | 2.56e-03 | 1.86e-03 | 37 |
| hsa046703 | Colorectum | SER | Leukocyte transendothelial migration | 37/1580 | 114/8465 | 2.77e-04 | 2.56e-03 | 1.86e-03 | 37 |
| hsa046704 | Colorectum | MSS | Leukocyte transendothelial migration | 36/1875 | 114/8465 | 1.21e-02 | 4.02e-02 | 2.46e-02 | 36 |
| hsa046705 | Colorectum | MSS | Leukocyte transendothelial migration | 36/1875 | 114/8465 | 1.21e-02 | 4.02e-02 | 2.46e-02 | 36 |
| hsa046706 | Colorectum | FAP | Leukocyte transendothelial migration | 37/1404 | 114/8465 | 2.12e-05 | 2.53e-04 | 1.54e-04 | 37 |
| hsa046707 | Colorectum | FAP | Leukocyte transendothelial migration | 37/1404 | 114/8465 | 2.12e-05 | 2.53e-04 | 1.54e-04 | 37 |
| Page: 1 2 3 |
Top |
Cell-cell communication analysis |
| Identification of potential cell-cell interactions between two cell types and their ligand-receptor pairs for different disease states |
| Ligand | Receptor | LRpair | Pathway | Tissue | Disease Stage |
| CD99 | CD99 | CD99_CD99 | CD99 | Breast | ADJ |
| CD99 | PILRA | CD99_PILRA | CD99 | Breast | DCIS |
| CD99 | CD99 | CD99_CD99 | CD99 | Breast | DCIS |
| CD99 | PILRA | CD99_PILRA | CD99 | Breast | IDC |
| CD99 | CD99 | CD99_CD99 | CD99 | Breast | IDC |
| CD99 | PILRA | CD99_PILRA | CD99 | Breast | Precancer |
| CD99 | CD99 | CD99_CD99 | CD99 | Breast | Precancer |
| CD99 | CD99 | CD99_CD99 | CD99 | Cervix | ADJ |
| CD99 | PILRA | CD99_PILRA | CD99 | Cervix | CC |
| CD99 | CD99 | CD99_CD99 | CD99 | Cervix | CC |
| CD99 | CD99L2 | CD99_CD99L2 | CD99 | Cervix | CC |
| CD99 | CD99 | CD99_CD99 | CD99 | Cervix | Healthy |
| CD99 | PILRA | CD99_PILRA | CD99 | Cervix | Precancer |
| CD99 | CD99 | CD99_CD99 | CD99 | Cervix | Precancer |
| CD99 | PILRA | CD99_PILRA | CD99 | CRC | AD |
| CD99 | CD99 | CD99_CD99 | CD99 | CRC | AD |
| CD99 | CD99 | CD99_CD99 | CD99 | CRC | ADJ |
| CD99 | CD99 | CD99_CD99 | CD99 | CRC | CRC |
| CD99 | PILRA | CD99_PILRA | CD99 | CRC | MSI-H |
| CD99 | CD99 | CD99_CD99 | CD99 | CRC | MSI-H |
| Page: 1 2 3 4 5 |
Top |
Single-cell gene regulatory network inference analysis |
| Find out the significant the regulons (TFs) and the target genes of each regulon across cell types for different disease states |
| TF | Cell Type | Tissue | Disease Stage | Target Gene | RSS | Regulon Activity |
| ∗The dot plots of a searched regulon are shown for all cell subpopulations in each disease state of each tissue based on the regulon specific score inferred using pySCENIC and by calculating the average expression. |
| Page: 1 |
Top |
Somatic mutation of malignant transformation related genes |
| Annotation of somatic variants for genes involved in malignant transformation |
| Hugo Symbol | Variant Class | Variant Classification | dbSNP RS | HGVSc | HGVSp | HGVSp Short | SWISSPROT | BIOTYPE | SIFT | PolyPhen | Tumor Sample Barcode | Tissue | Histology | Sex | Age | Stage | Therapy Types | Drugs | Outcome |
| CD99 | SNV | Missense_Mutation | c.343N>G | p.Arg115Gly | p.R115G | P14209 | protein_coding | tolerated(0.36) | benign(0) | TCGA-A8-A09Z-01 | Breast | breast invasive carcinoma | Female | >=65 | I/II | Unknown | Unknown | SD | |
| CD99 | SNV | Missense_Mutation | c.315N>T | p.Lys105Asn | p.K105N | P14209 | protein_coding | tolerated(0.47) | benign(0.026) | TCGA-AO-A03O-01 | Breast | breast invasive carcinoma | Female | >=65 | I/II | Chemotherapy | doxorubicin | SD | |
| CD99 | SNV | Missense_Mutation | c.352N>A | p.Gly118Arg | p.G118R | P14209 | protein_coding | tolerated(0.09) | benign(0.397) | TCGA-D8-A1JH-01 | Breast | breast invasive carcinoma | Female | <65 | I/II | Hormone Therapy | nolvadex | SD | |
| CD99 | insertion | Frame_Shift_Ins | novel | c.132_133insA | p.Lys46GlufsTer7 | p.K46Efs*7 | P14209 | protein_coding | TCGA-MA-AA42-01 | Cervix | cervical & endocervical cancer | Female | >=65 | I/II | Unknown | Unknown | SD | ||
| CD99 | SNV | Missense_Mutation | rs188016181 | c.409N>A | p.Ala137Thr | p.A137T | P14209 | protein_coding | tolerated(0.73) | probably_damaging(0.994) | TCGA-AZ-4615-01 | Colorectum | colon adenocarcinoma | Male | >=65 | III/IV | Chemotherapy | xeloda | PD |
| CD99 | SNV | Missense_Mutation | rs770516694 | c.403G>A | p.Val135Met | p.V135M | P14209 | protein_coding | tolerated(0.06) | possibly_damaging(0.886) | TCGA-CM-4746-01 | Colorectum | colon adenocarcinoma | Male | <65 | I/II | Unknown | Unknown | SD |
| CD99 | SNV | Missense_Mutation | rs768811289 | c.203G>A | p.Arg68Gln | p.R68Q | P14209 | protein_coding | tolerated(0.55) | benign(0) | TCGA-A5-A0G1-01 | Endometrium | uterine corpus endometrioid carcinoma | Female | >=65 | I/II | Unknown | Unknown | SD |
| CD99 | SNV | Missense_Mutation | novel | c.412G>A | p.Val138Met | p.V138M | P14209 | protein_coding | deleterious(0.01) | probably_damaging(0.96) | TCGA-A5-A1OF-01 | Endometrium | uterine corpus endometrioid carcinoma | Female | <65 | I/II | Unknown | Unknown | SD |
| CD99 | SNV | Missense_Mutation | rs774386901 | c.196N>A | p.Asp66Asn | p.D66N | P14209 | protein_coding | tolerated(0.35) | probably_damaging(0.948) | TCGA-AP-A1DV-01 | Endometrium | uterine corpus endometrioid carcinoma | Female | <65 | I/II | Unknown | Unknown | SD |
| CD99 | SNV | Missense_Mutation | rs774386901 | c.196N>A | p.Asp66Asn | p.D66N | P14209 | protein_coding | tolerated(0.35) | probably_damaging(0.948) | TCGA-EO-A22X-01 | Endometrium | uterine corpus endometrioid carcinoma | Female | <65 | III/IV | Unspecific | Carboplatin | Complete Response |
| Page: 1 2 |
Top |
Related drugs of malignant transformation related genes |
| Identification of chemicals and drugs interact with genes involved in malignant transfromation |
| (DGIdb 4.0) |
| Entrez ID | Symbol | Category | Interaction Types | Drug Claim Name | Drug Name | PMIDs |
| Page: 1 |

Copyright 2023-Present -The University of Texas Health Science Center at Houston |