
|
|||||
|
 | |
| |
| |
| |
| |
| |
|
Gene: BZW1 |
Gene summary for BZW1 |
| Gene information | Species | Human | Gene symbol | BZW1 | Gene ID | 9689 |
| Gene name | basic leucine zipper and W2 domains 1 | |
| Gene Alias | BZAP45 | |
| Cytomap | 2q33.1 | |
| Gene Type | protein-coding | GO ID | GO:0005575 | UniProtAcc | A0A024R3Z6 |
Top |
Malignant transformation analysis |
| Identification of the aberrant gene expression in precancerous and cancerous lesions by comparing the gene expression of stem-like cells in diseased tissues with normal stem cells |
| Entrez ID | Symbol | Replicates | Species | Organ | Tissue | Adj P-value | Log2FC | Malignancy |
| 9689 | BZW1 | GSM5252132_BPH389PrGF | Human | Prostate | BPH | 1.71e-08 | 1.27e+00 | -0.2247 |
| 9689 | BZW1 | GSM5252133_BPH389PrSF | Human | Prostate | BPH | 2.78e-11 | 1.45e+00 | -0.2027 |
| 9689 | BZW1 | GSM5252134_BPH511PrG_Fcol_3GEX | Human | Prostate | BPH | 8.05e-09 | 6.20e-01 | -0.1433 |
| 9689 | BZW1 | GSM5252135_BPH511PrPUr_Fcol_3GEX | Human | Prostate | BPH | 4.09e-38 | 1.82e+00 | -0.1833 |
| 9689 | BZW1 | GSM5252136_BPH556PrGA1_Fcol | Human | Prostate | BPH | 4.59e-07 | 6.21e-01 | -0.23 |
| 9689 | BZW1 | GSM5252137_BPH556PrGA2_Fcol | Human | Prostate | BPH | 1.22e-06 | 9.03e-01 | -0.23 |
| 9689 | BZW1 | 047563_1562-all-cells | Human | Prostate | BPH | 1.90e-19 | -4.32e-02 | 0.0791 |
| 9689 | BZW1 | Dong_P1 | Human | Prostate | Tumor | 3.15e-23 | 1.45e-02 | 0.035 |
| 9689 | BZW1 | Dong_P3 | Human | Prostate | Tumor | 5.73e-17 | -3.02e-01 | 0.0278 |
| 9689 | BZW1 | Dong_P4 | Human | Prostate | Tumor | 4.57e-09 | 6.99e-02 | 0.0292 |
| 9689 | BZW1 | Dong_P5 | Human | Prostate | Tumor | 4.49e-36 | -2.07e-01 | 0.053 |
| 9689 | BZW1 | P10 | Human | Prostate | Tumor | 7.68e-05 | 2.72e-01 | -0.0902 |
| 9689 | BZW1 | GSM5353222_PA_PB2B_Pool_1_3_S52_L002 | Human | Prostate | Tumor | 7.14e-06 | -5.14e-01 | 0.1608 |
| 9689 | BZW1 | GSM5353223_PA_PB2B_Pool_2_S26_L001 | Human | Prostate | Tumor | 8.49e-04 | -5.57e-01 | 0.1604 |
| 9689 | BZW1 | GSM5353227_PA_PR5199-193K_Pool_1_2_3_S55_L002 | Human | Prostate | Tumor | 1.23e-03 | -4.84e-01 | 0.1602 |
| 9689 | BZW1 | GSM5353240_PA_PR5254_T1_S15_L001 | Human | Prostate | Tumor | 4.19e-11 | -5.80e-01 | 0.1575 |
| 9689 | BZW1 | GSM5353243_PA_PR5261_T1_S23_L002 | Human | Prostate | Tumor | 4.98e-16 | -5.48e-01 | 0.1545 |
| 9689 | BZW1 | GSM5353244_PA_PR5261_T2_S24_L002 | Human | Prostate | Tumor | 8.50e-18 | -4.80e-01 | 0.1569 |
| 9689 | BZW1 | P2_S3_AK | Human | Skin | AK | 2.39e-02 | -5.52e-02 | -0.3287 |
| 9689 | BZW1 | P4_S8_cSCC | Human | Skin | cSCC | 8.89e-03 | 1.11e-01 | -0.3095 |
| Page: 1 2 3 4 5 6 7 8 9 10 11 |
| Tissue | Expression Dynamics | Abbreviation |
| Breast | 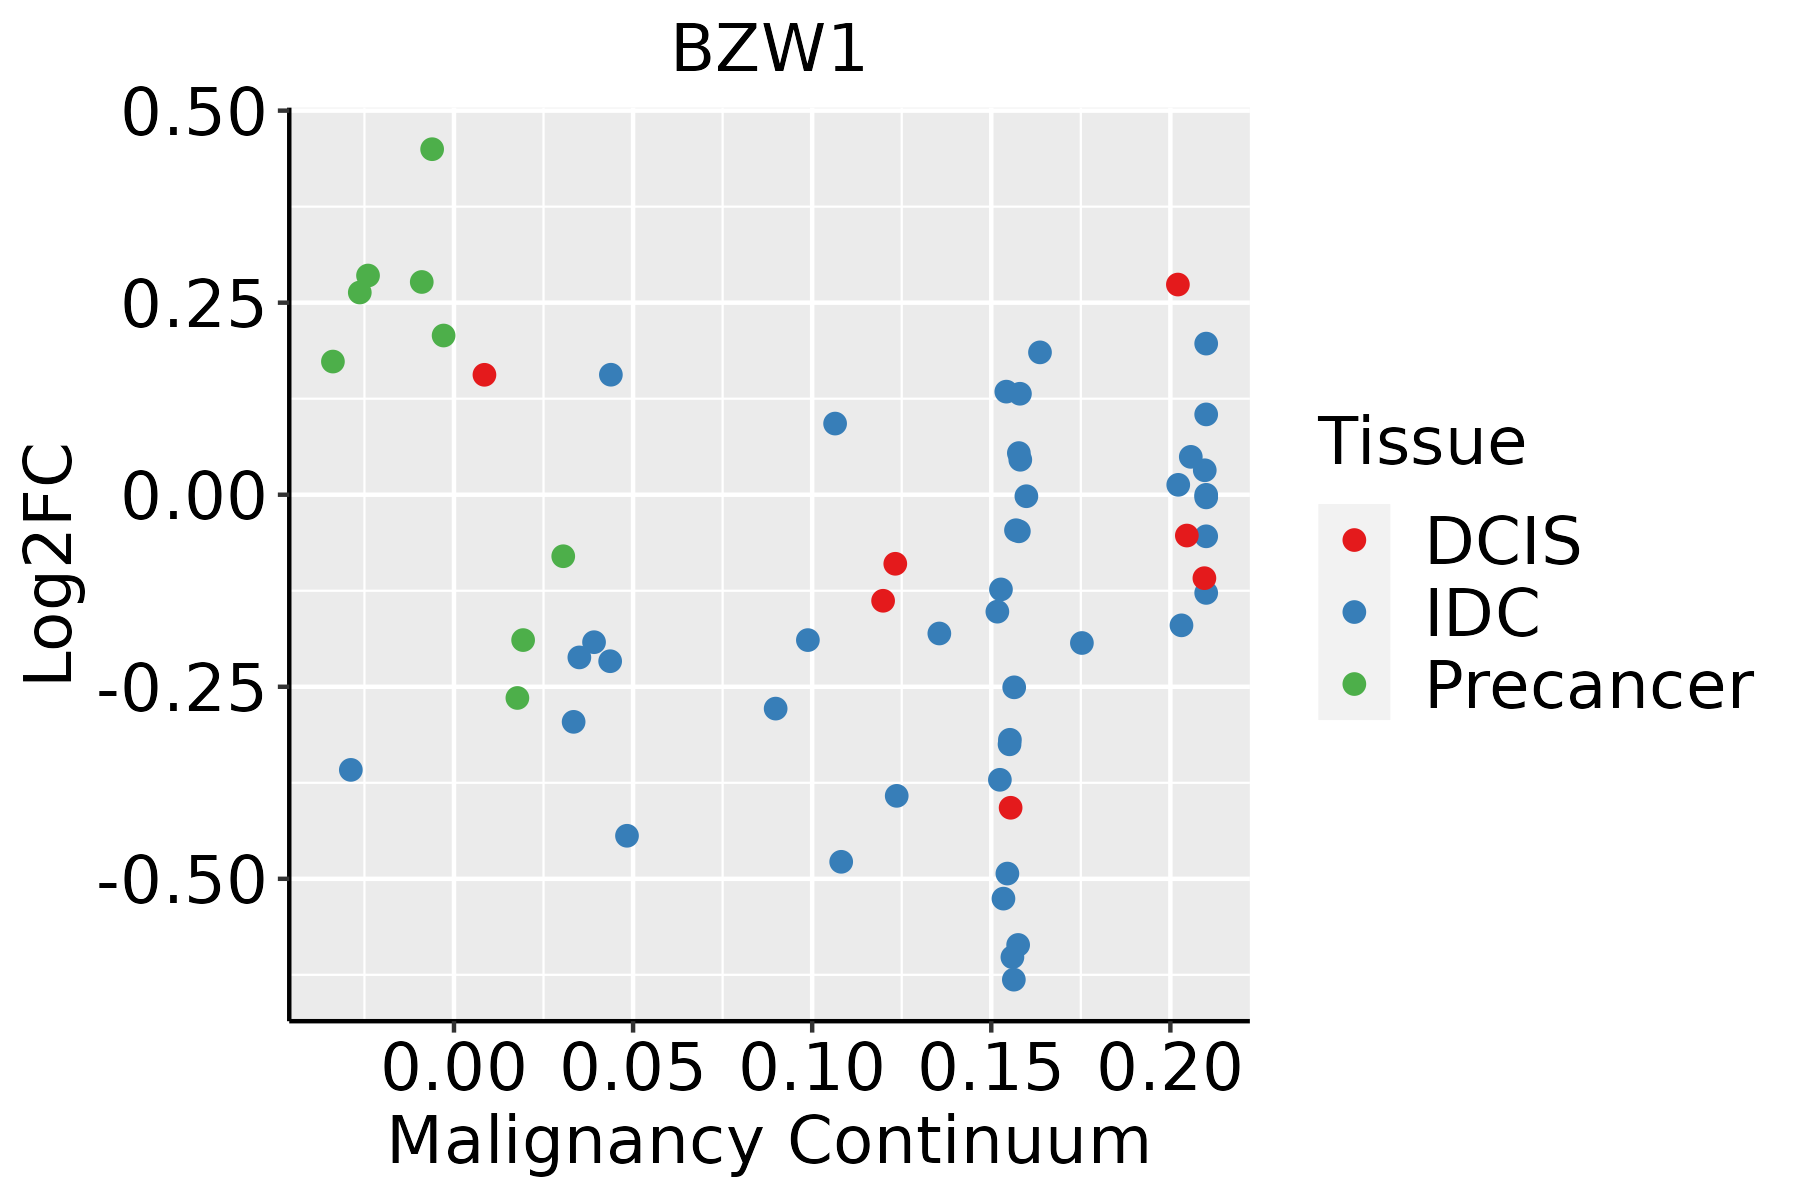 | IDC: Invasive ductal carcinoma |
| DCIS: Ductal carcinoma in situ | ||
| Precancer(BRCA1-mut): Precancerous lesion from BRCA1 mutation carriers | ||
| Cervix | 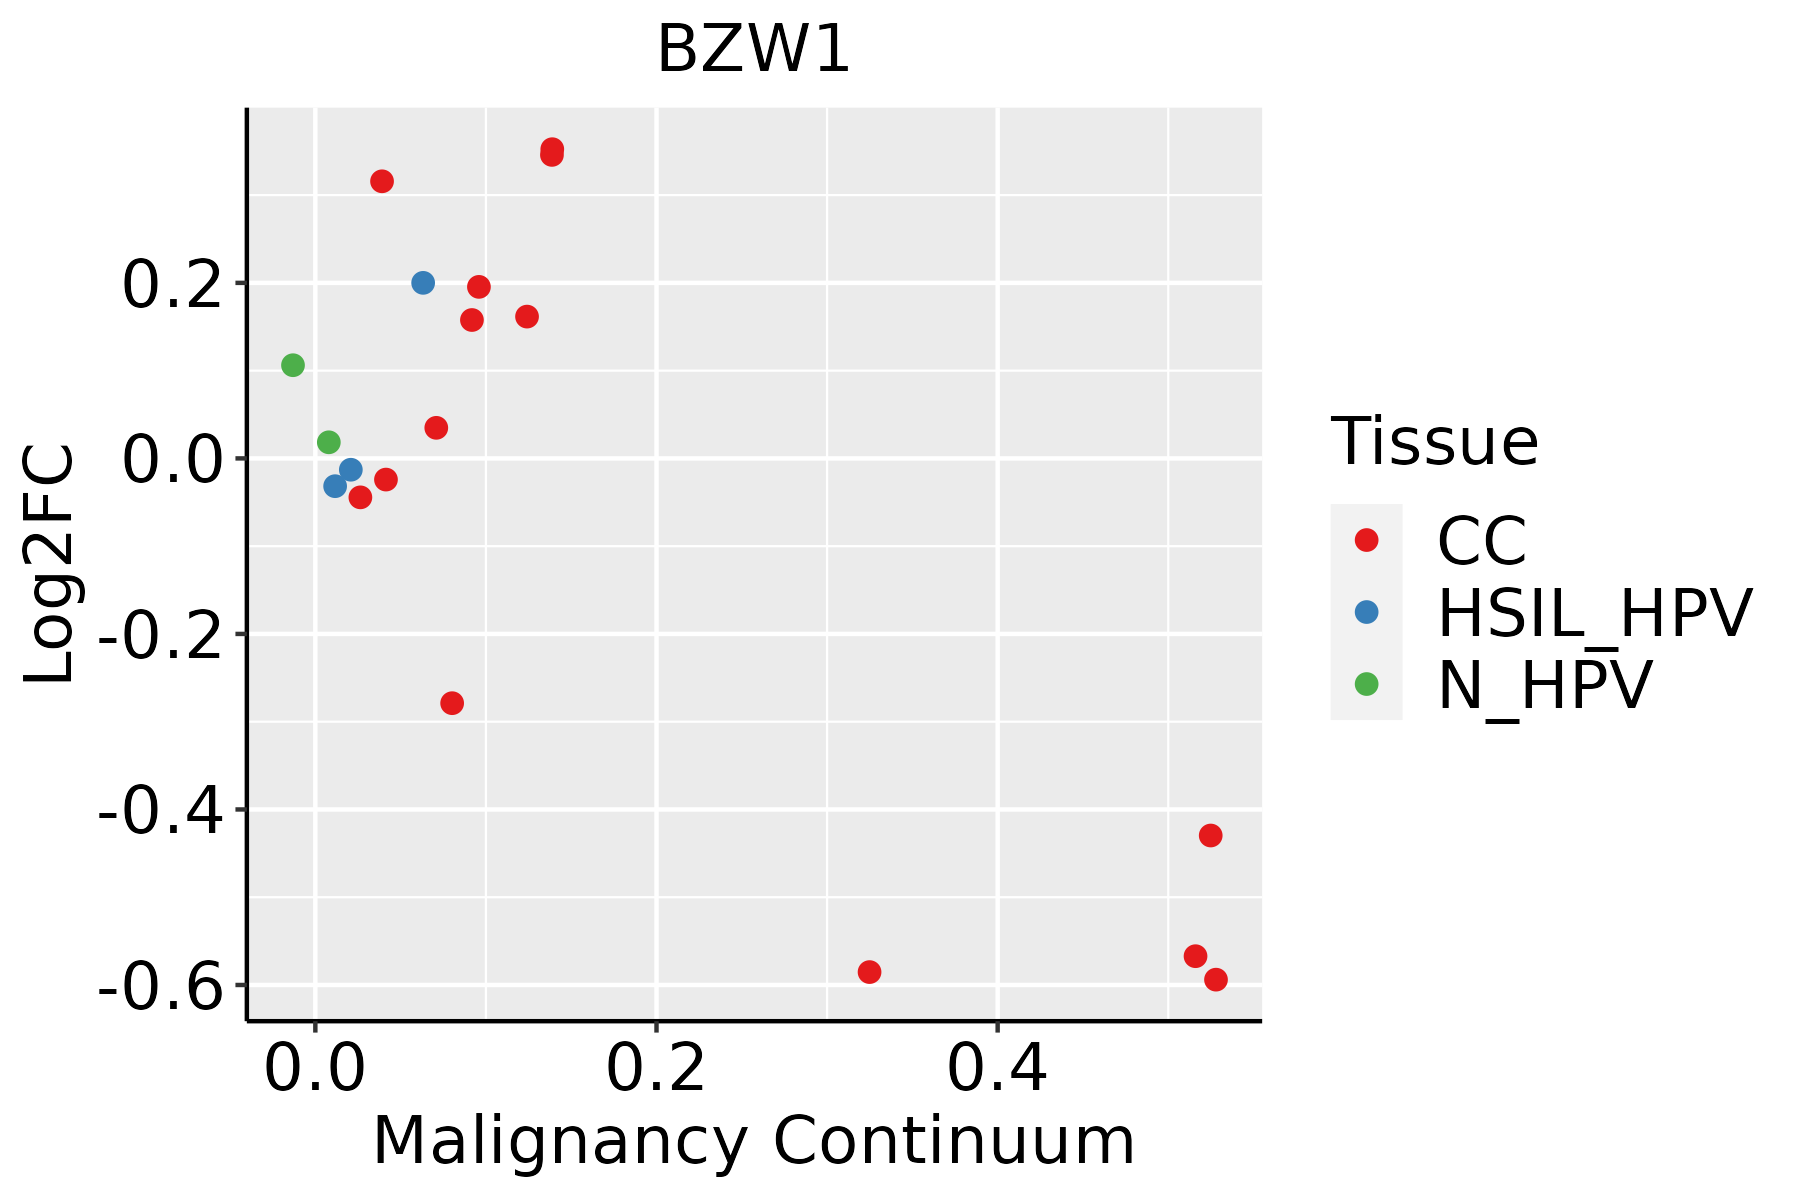 | CC: Cervix cancer |
| HSIL_HPV: HPV-infected high-grade squamous intraepithelial lesions | ||
| N_HPV: HPV-infected normal cervix | ||
| Endometrium |  | AEH: Atypical endometrial hyperplasia |
| EEC: Endometrioid Cancer | ||
| Esophagus | 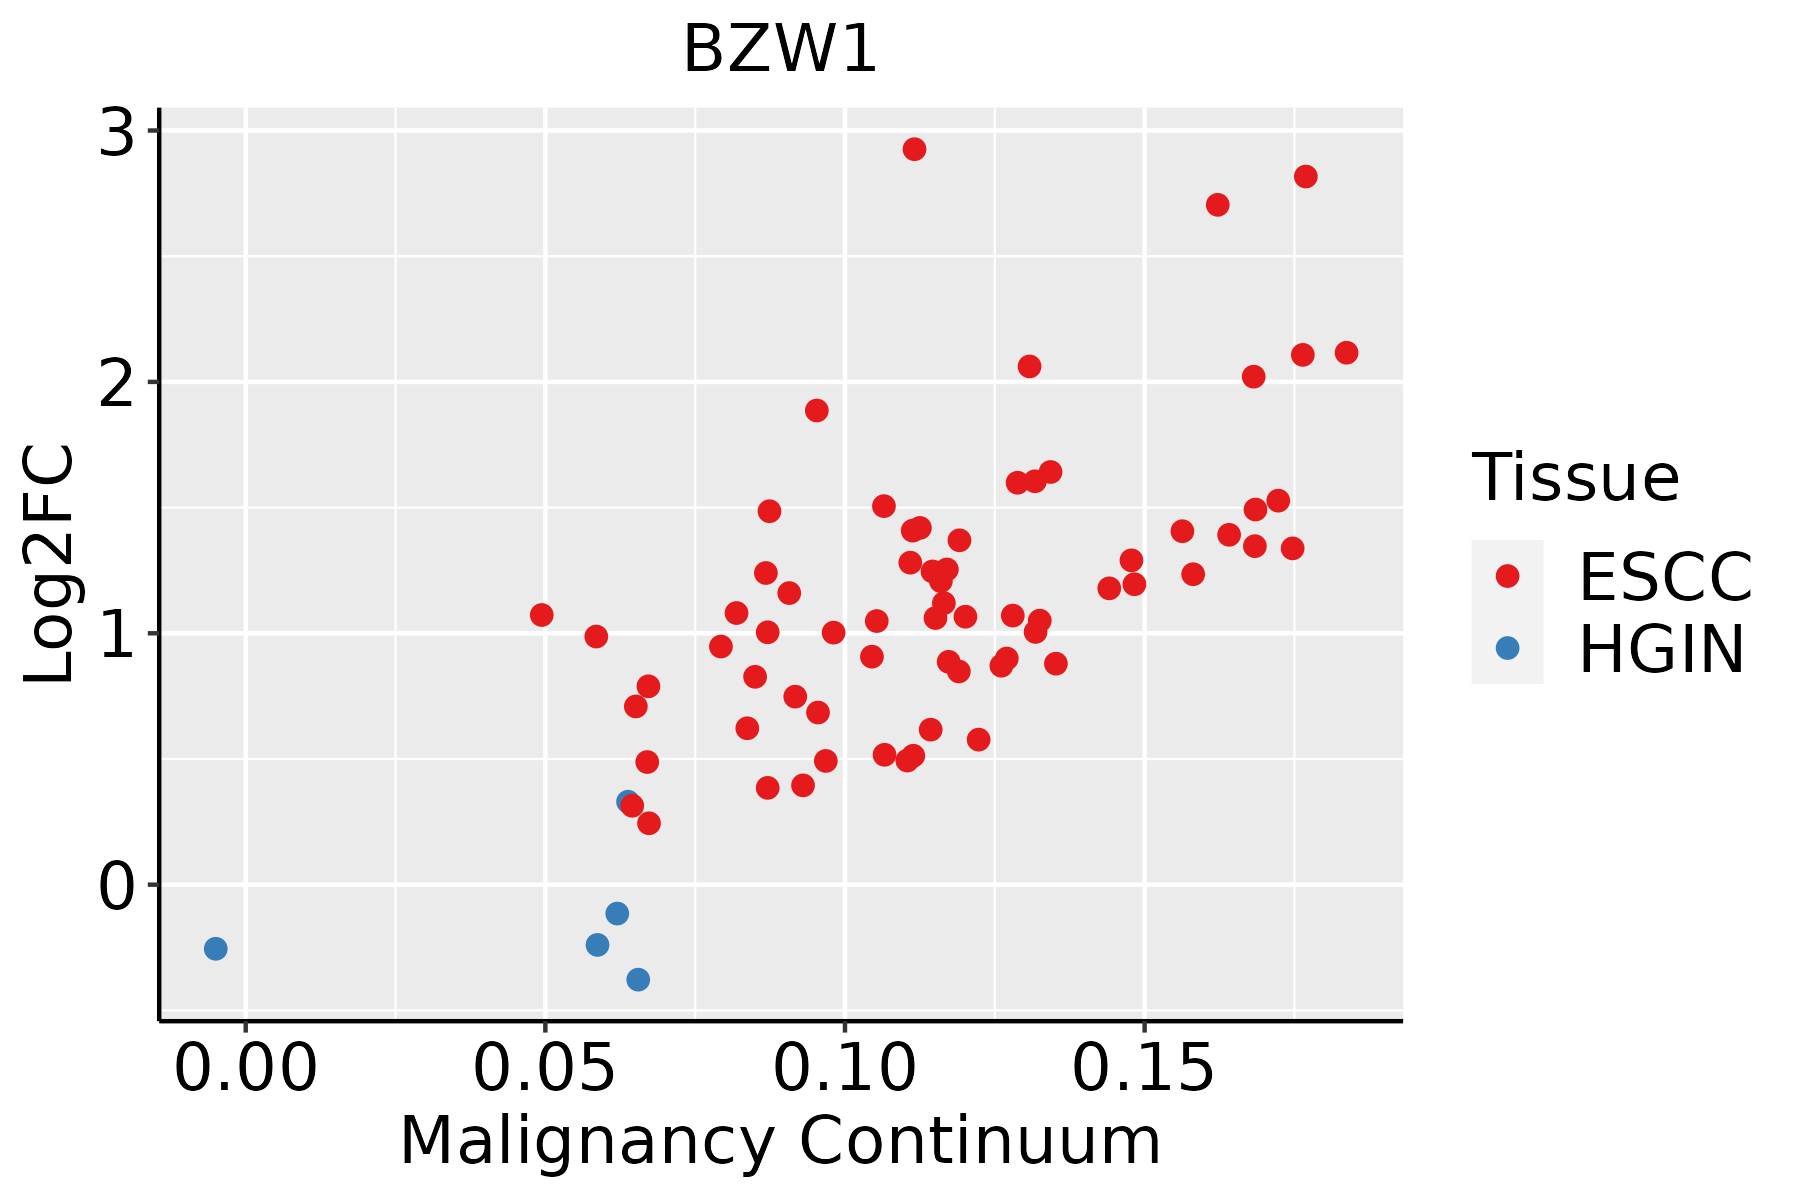 | ESCC: Esophageal squamous cell carcinoma |
| HGIN: High-grade intraepithelial neoplasias | ||
| LGIN: Low-grade intraepithelial neoplasias | ||
| Liver | 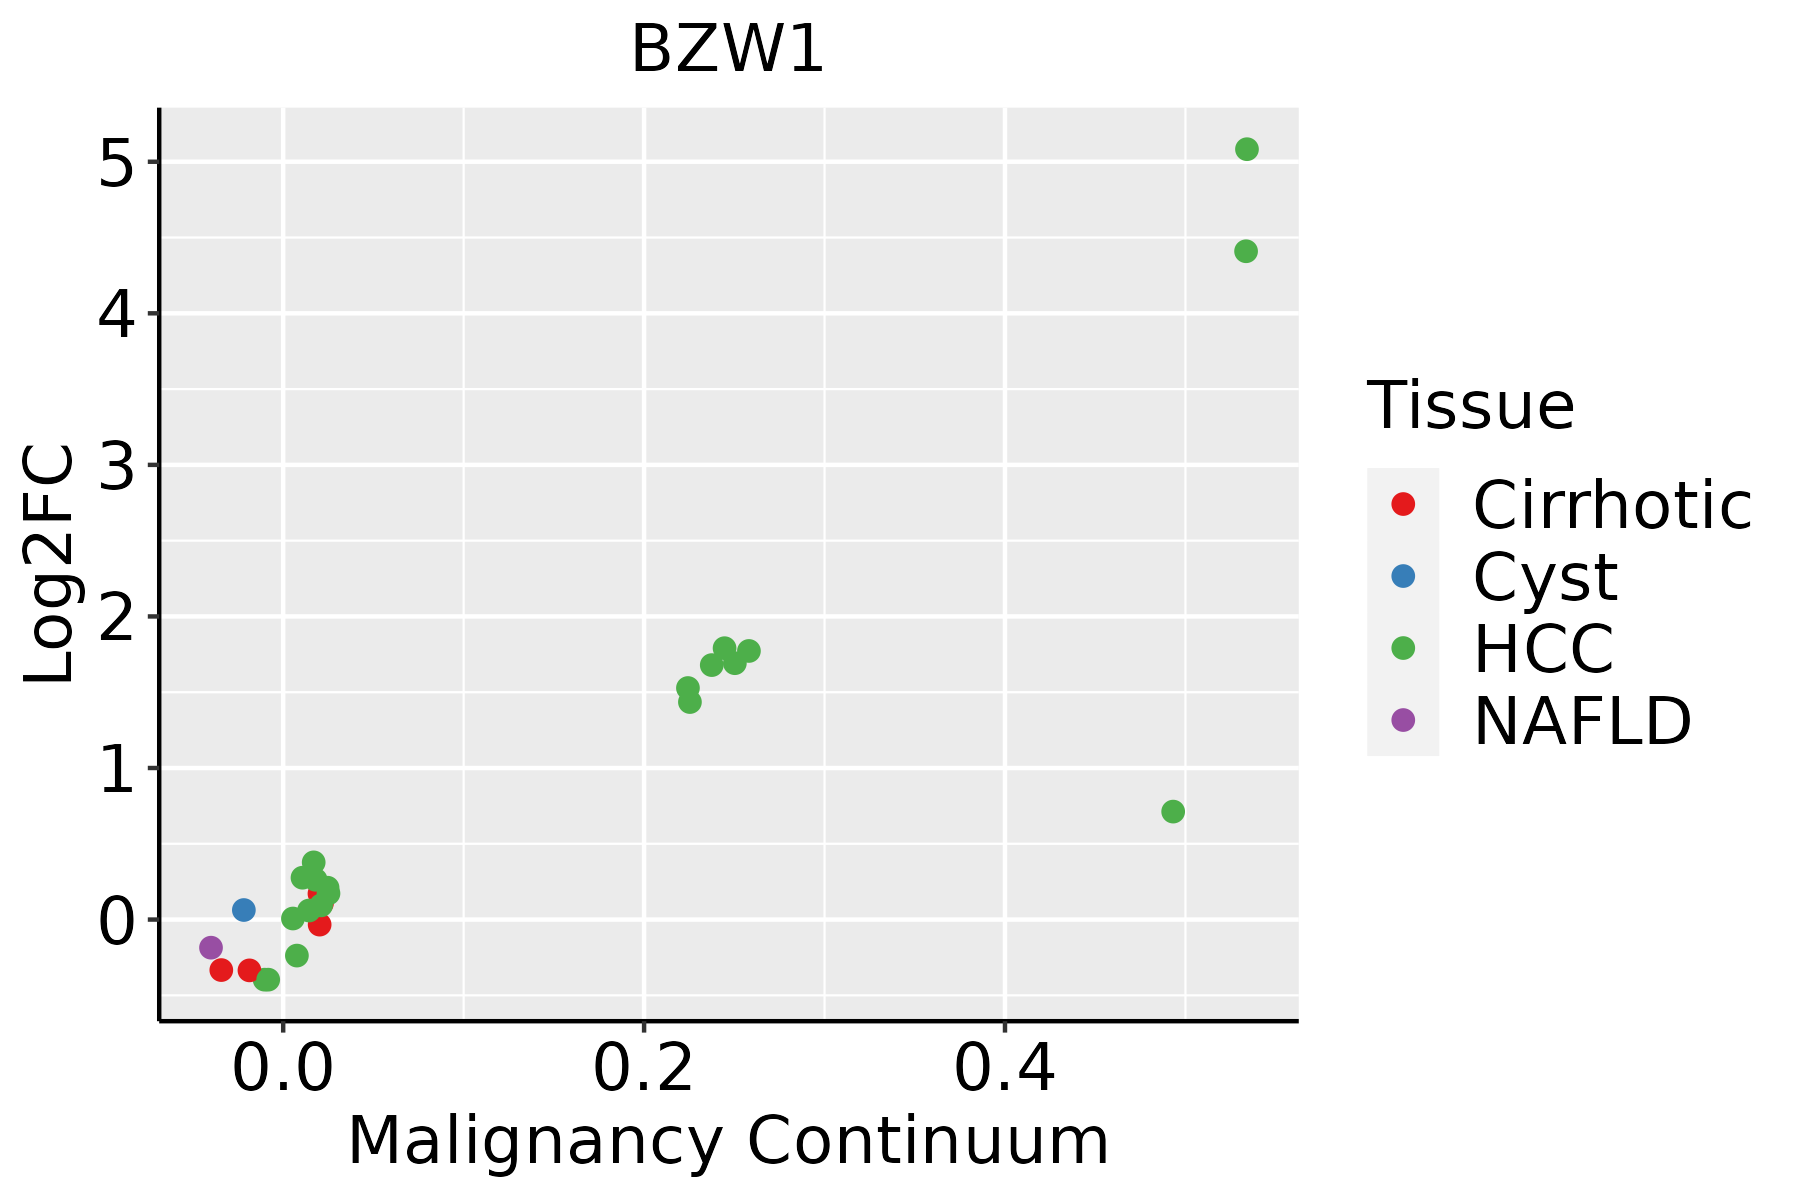 | HCC: Hepatocellular carcinoma |
| NAFLD: Non-alcoholic fatty liver disease | ||
| Lung | 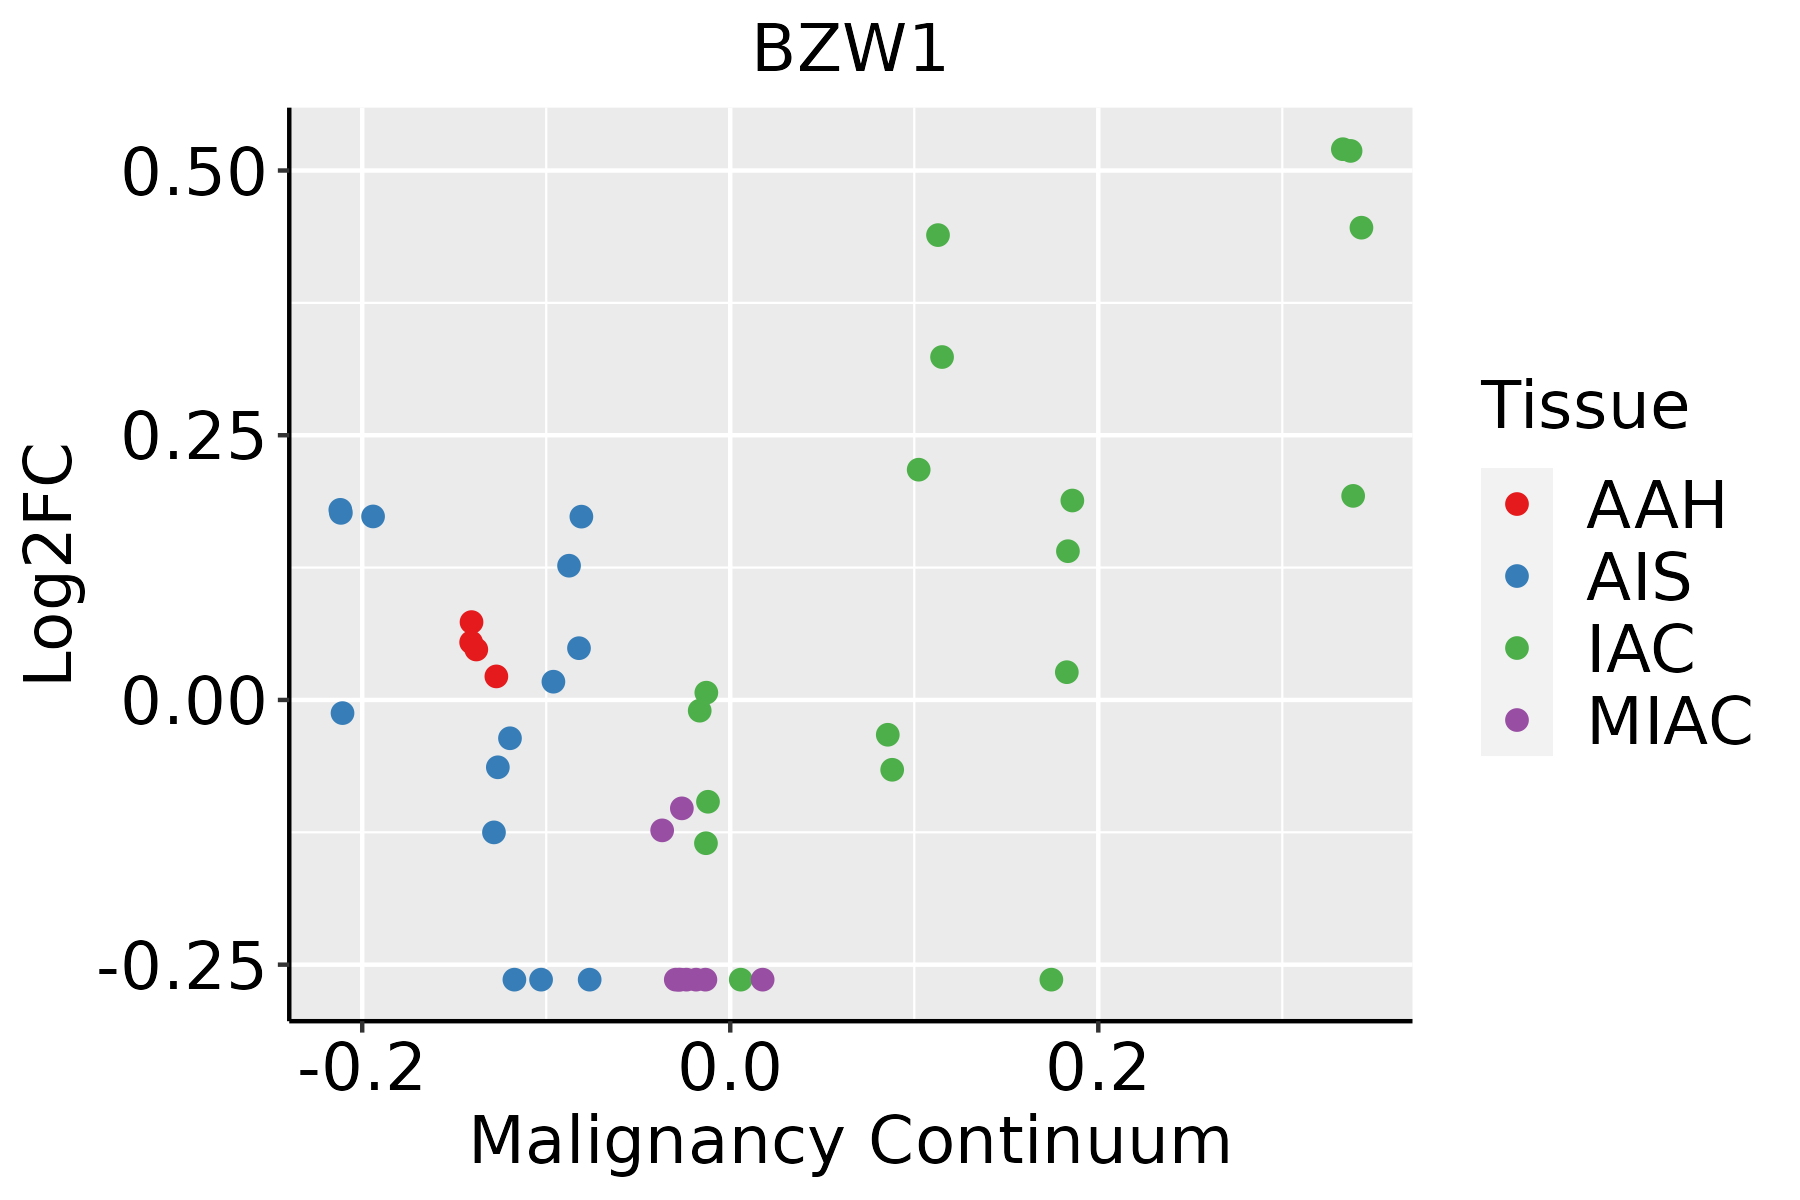 | AAH: Atypical adenomatous hyperplasia |
| AIS: Adenocarcinoma in situ | ||
| IAC: Invasive lung adenocarcinoma | ||
| MIA: Minimally invasive adenocarcinoma | ||
| Oral Cavity | 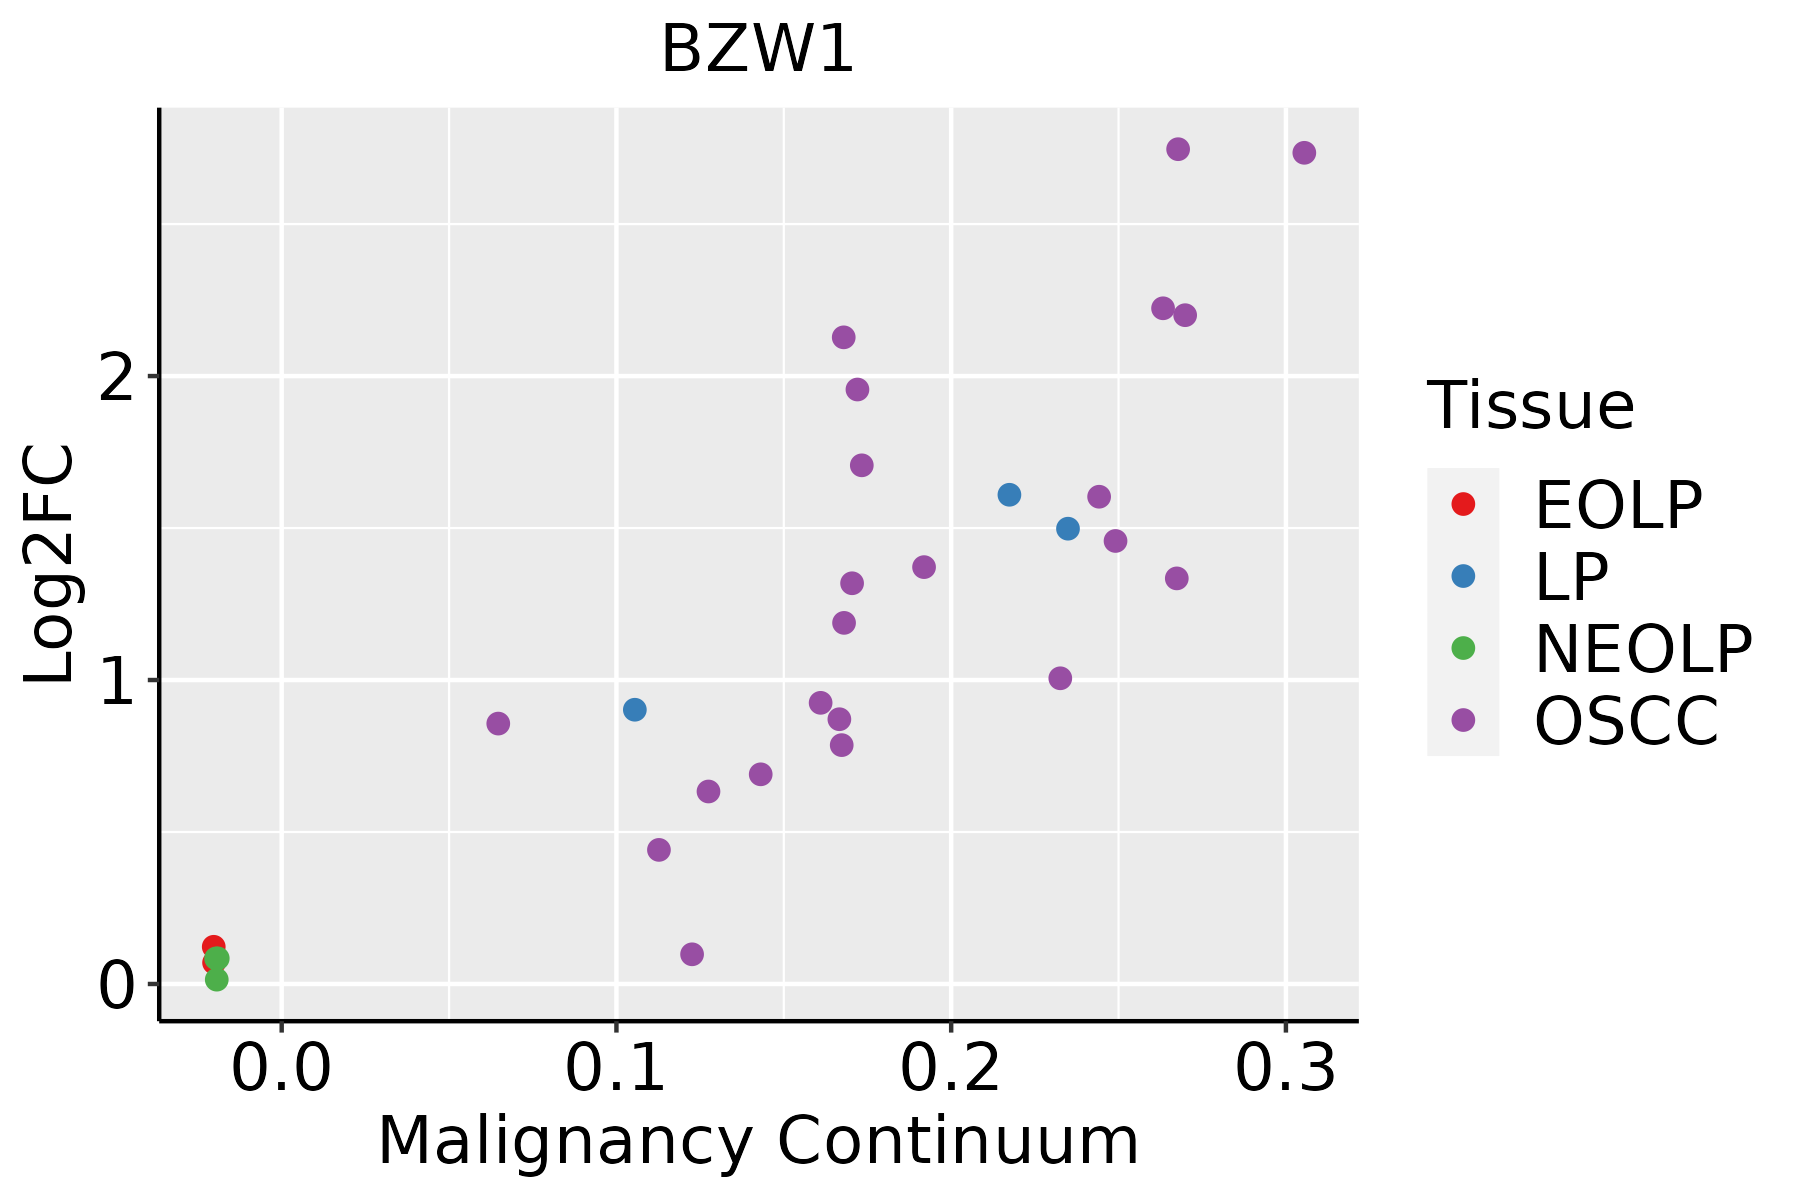 | EOLP: Erosive Oral lichen planus |
| LP: leukoplakia | ||
| NEOLP: Non-erosive oral lichen planus | ||
| OSCC: Oral squamous cell carcinoma | ||
| Prostate |  | BPH: Benign Prostatic Hyperplasia |
| Skin | 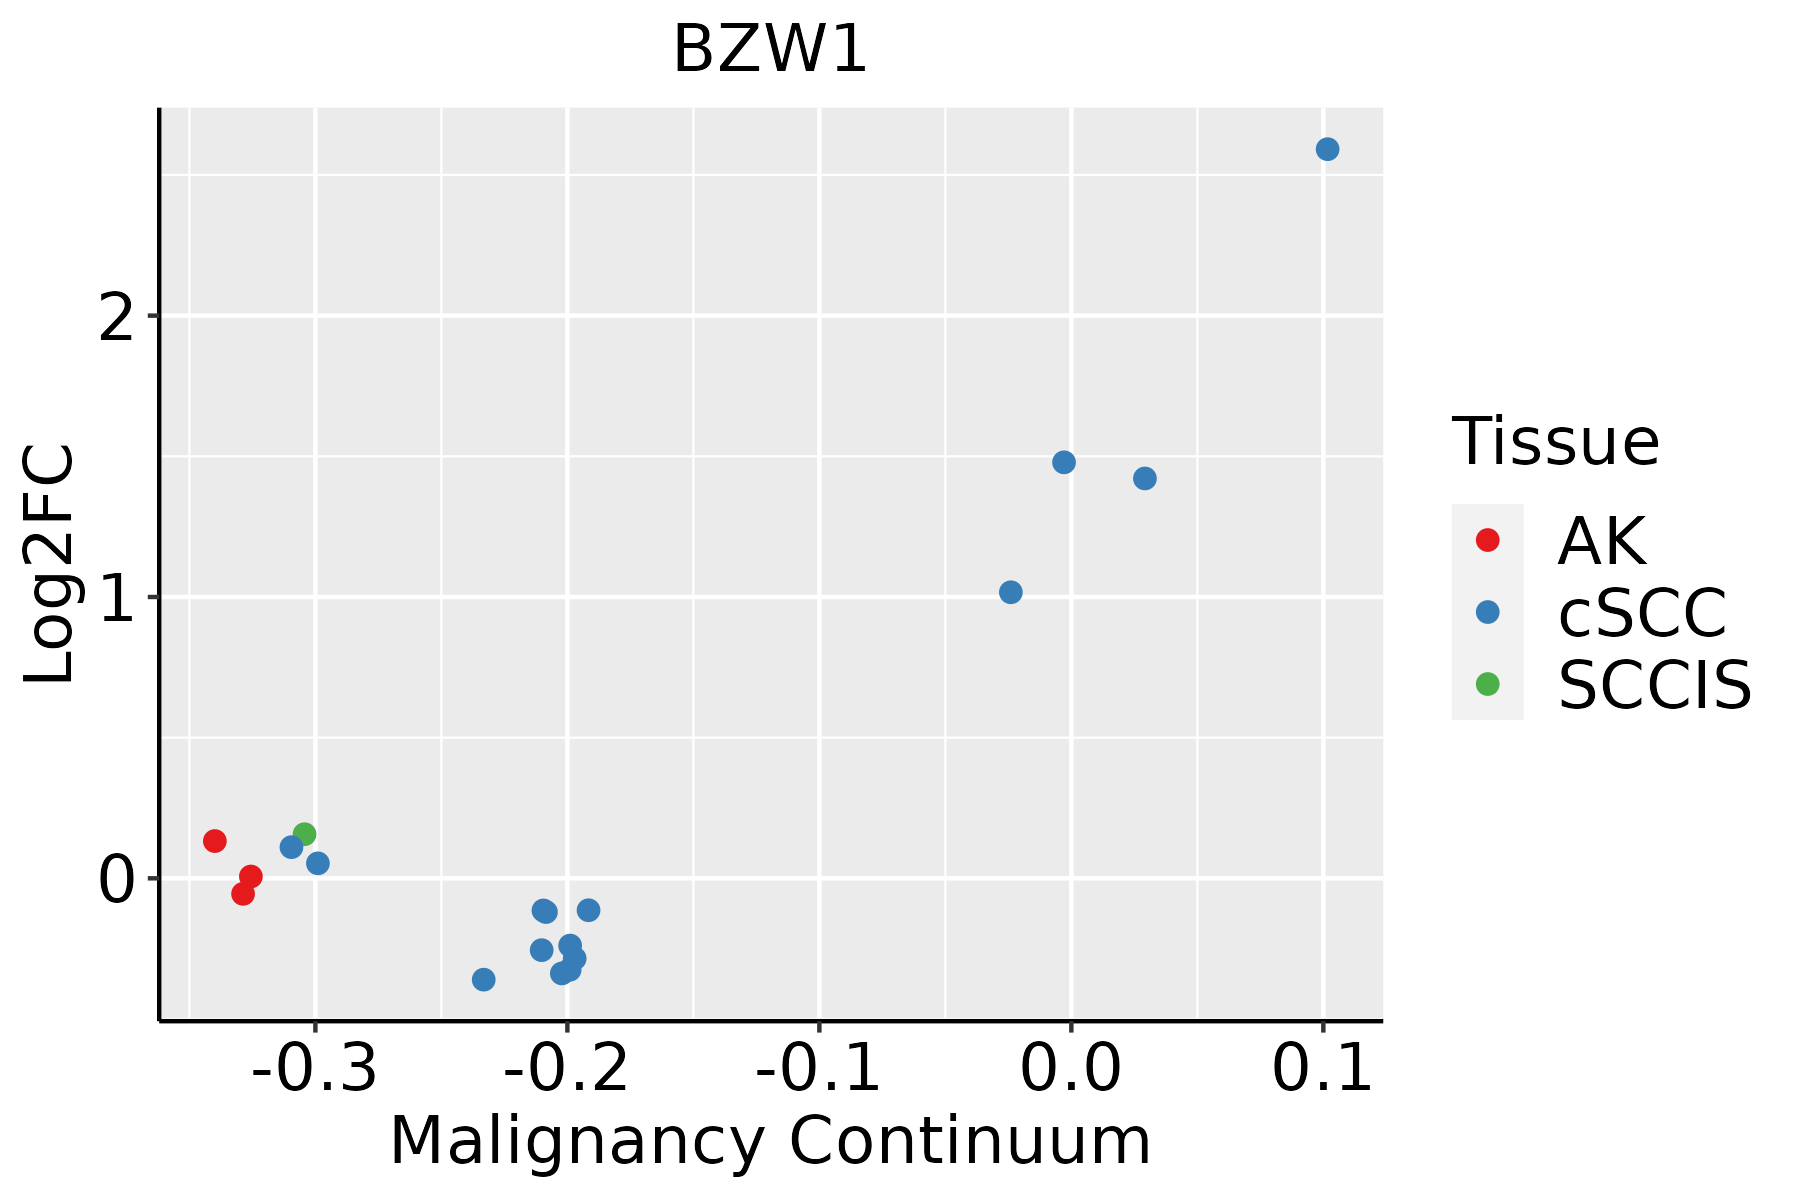 | AK: Actinic keratosis |
| cSCC: Cutaneous squamous cell carcinoma | ||
| SCCIS:squamous cell carcinoma in situ | ||
| Thyroid | 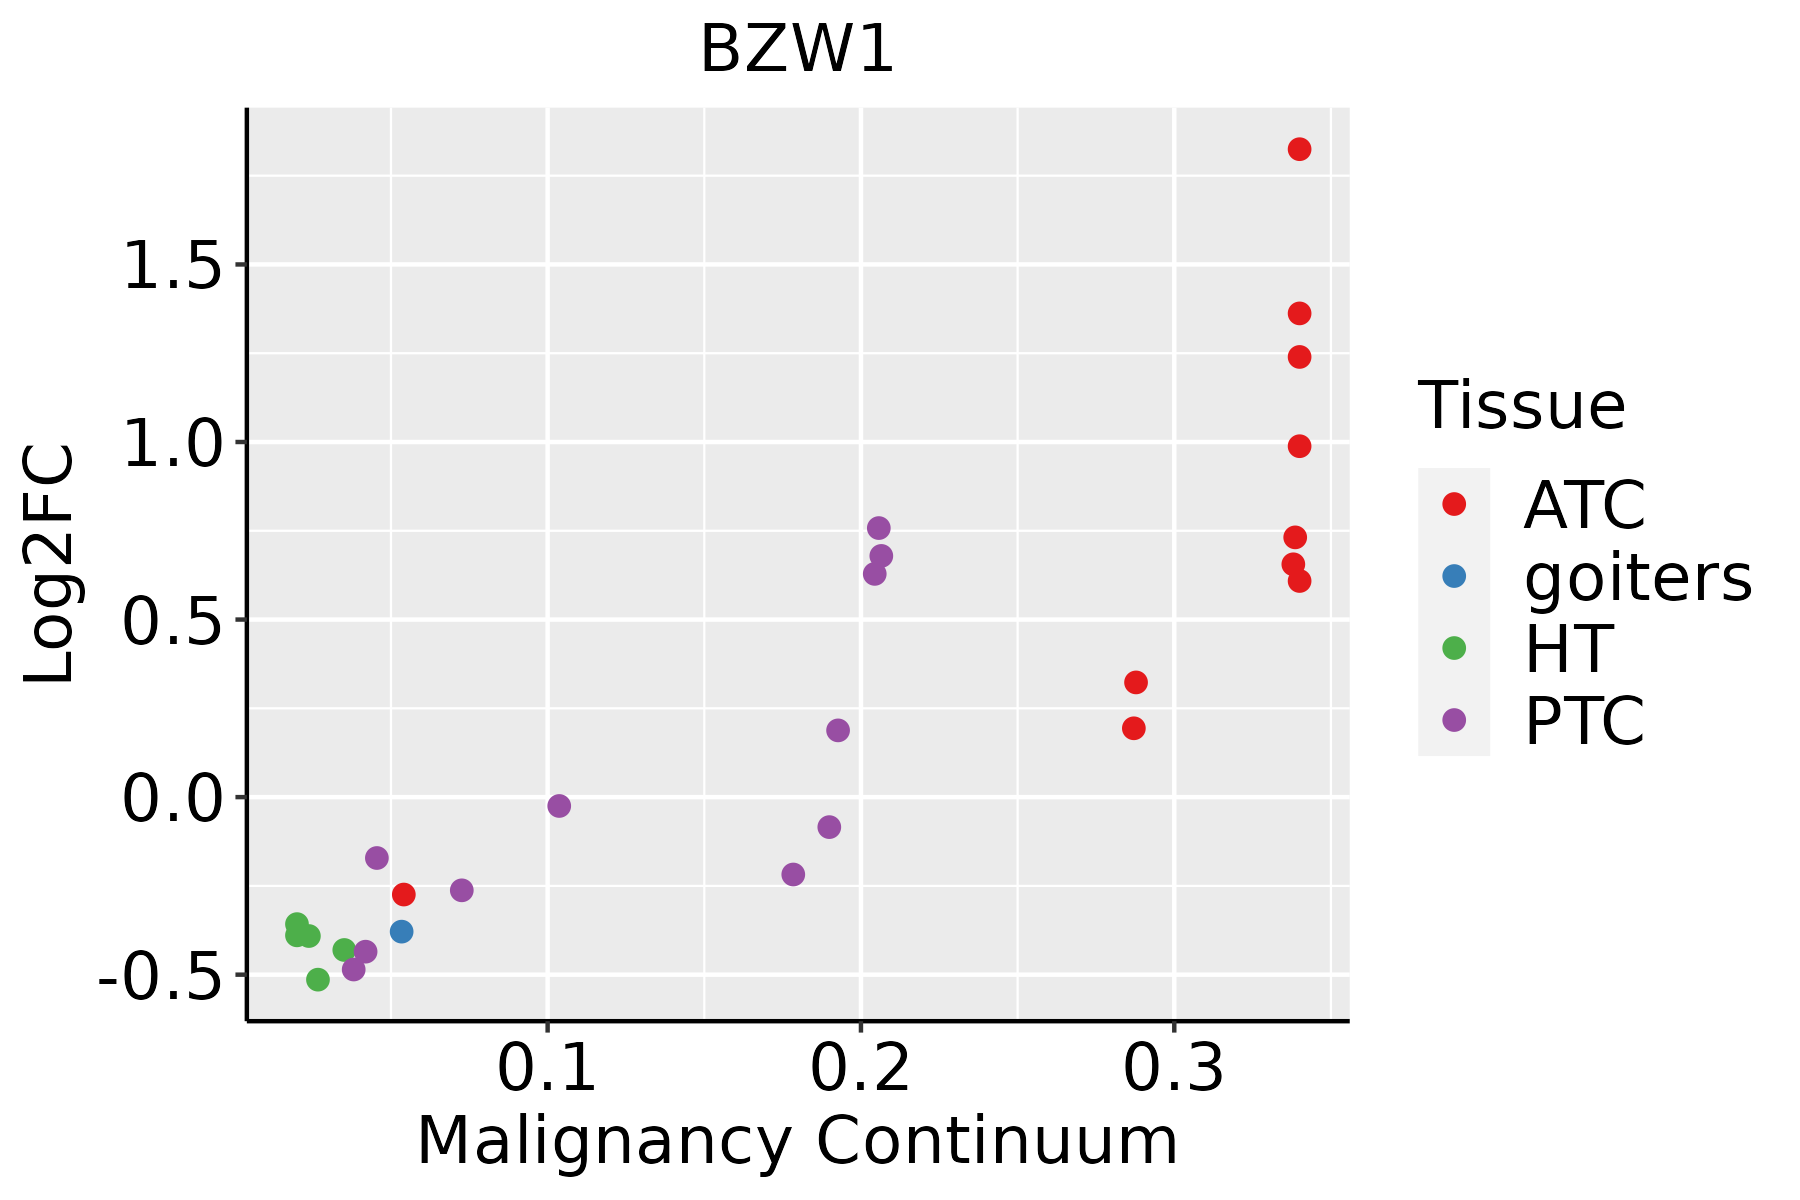 | ATC: Anaplastic thyroid cancer |
| HT: Hashimoto's thyroiditis | ||
| PTC: Papillary thyroid cancer |
| ∗log2FC in expression of this searched gene in stem-like cells from each diseased tissue sample relative to stem-like cells in normal samples in each tissue plotted against the malignancy continuum. Samples are colored based on if they are from different disease stage. |
Top |
Malignant transformation related pathway analysis |
| Find out the enriched GO biological processes and KEGG pathways involved in transition from healthy to precancer to cancer |
| Tissue | Disease Stage | Enriched GO biological Processes |
| Colorectum | AD |  |
| Colorectum | SER |  |
| Colorectum | MSS |  |
| Colorectum | MSI-H |  |
| Colorectum | FAP |  |
| ∗Top 15 enriched GO BP terms are showed in the bar plot of each disease state in each tissue. Each row represents a significant GO biological process which is colored according to the -log10(p.adjust). |
| Page: 1 2 3 4 5 6 7 8 9 |
| GO ID | Tissue | Disease Stage | Description | Gene Ratio | Bg Ratio | pvalue | p.adjust | Count |
| Page: 1 |
| Pathway ID | Tissue | Disease Stage | Description | Gene Ratio | Bg Ratio | pvalue | p.adjust | qvalue | Count |
| Page: 1 |
Top |
Cell-cell communication analysis |
| Identification of potential cell-cell interactions between two cell types and their ligand-receptor pairs for different disease states |
| Ligand | Receptor | LRpair | Pathway | Tissue | Disease Stage |
| Page: 1 |
Top |
Single-cell gene regulatory network inference analysis |
| Find out the significant the regulons (TFs) and the target genes of each regulon across cell types for different disease states |
| TF | Cell Type | Tissue | Disease Stage | Target Gene | RSS | Regulon Activity |
| ∗The dot plots of a searched regulon are shown for all cell subpopulations in each disease state of each tissue based on the regulon specific score inferred using pySCENIC and by calculating the average expression. |
| Page: 1 |
Top |
Somatic mutation of malignant transformation related genes |
| Annotation of somatic variants for genes involved in malignant transformation |
| Hugo Symbol | Variant Class | Variant Classification | dbSNP RS | HGVSc | HGVSp | HGVSp Short | SWISSPROT | BIOTYPE | SIFT | PolyPhen | Tumor Sample Barcode | Tissue | Histology | Sex | Age | Stage | Therapy Types | Drugs | Outcome |
| BZW1 | SNV | Missense_Mutation | c.1046N>G | p.Ala349Gly | p.A349G | Q7L1Q6 | protein_coding | deleterious(0.01) | possibly_damaging(0.686) | TCGA-AQ-A04J-01 | Breast | breast invasive carcinoma | Female | <65 | I/II | Chemotherapy | cytoxan | SD | |
| BZW1 | SNV | Missense_Mutation | c.757N>A | p.Ala253Thr | p.A253T | Q7L1Q6 | protein_coding | tolerated(0.5) | benign(0.277) | TCGA-B6-A0IJ-01 | Breast | breast invasive carcinoma | Female | <65 | I/II | Unknown | Unknown | SD | |
| BZW1 | SNV | Missense_Mutation | novel | c.773T>G | p.Val258Gly | p.V258G | Q7L1Q6 | protein_coding | tolerated(0.37) | benign(0.043) | TCGA-2W-A8YY-01 | Cervix | cervical & endocervical cancer | Female | <65 | I/II | Chemotherapy | cisplatin | CR |
| BZW1 | SNV | Missense_Mutation | c.212N>A | p.Gly71Asp | p.G71D | Q7L1Q6 | protein_coding | deleterious(0) | probably_damaging(0.973) | TCGA-AZ-6601-01 | Colorectum | colon adenocarcinoma | Male | >=65 | I/II | Unknown | Unknown | PD | |
| BZW1 | SNV | Missense_Mutation | novel | c.662N>C | p.Leu221Pro | p.L221P | Q7L1Q6 | protein_coding | deleterious(0) | possibly_damaging(0.861) | TCGA-G4-6294-01 | Colorectum | colon adenocarcinoma | Male | >=65 | III/IV | Chemotherapy | fluorouracil | PD |
| BZW1 | SNV | Missense_Mutation | c.118N>G | p.Lys40Glu | p.K40E | Q7L1Q6 | protein_coding | deleterious(0) | probably_damaging(0.994) | TCGA-WS-AB45-01 | Colorectum | colon adenocarcinoma | Female | <65 | I/II | Unknown | Unknown | SD | |
| BZW1 | SNV | Missense_Mutation | novel | c.290N>A | p.Arg97Gln | p.R97Q | Q7L1Q6 | protein_coding | deleterious(0.01) | possibly_damaging(0.782) | TCGA-F5-6814-01 | Colorectum | rectum adenocarcinoma | Male | <65 | I/II | Unknown | Unknown | SD |
| BZW1 | insertion | Frame_Shift_Ins | rs774640795 | c.942_943insA | p.Asn317LysfsTer54 | p.N317Kfs*54 | Q7L1Q6 | protein_coding | TCGA-AA-3821-01 | Colorectum | colon adenocarcinoma | Female | >=65 | I/II | Unknown | Unknown | SD | ||
| BZW1 | deletion | Frame_Shift_Del | c.950delA | p.Asn317ThrfsTer11 | p.N317Tfs*11 | Q7L1Q6 | protein_coding | TCGA-AA-3845-01 | Colorectum | colon adenocarcinoma | Female | >=65 | I/II | Unknown | Unknown | PD | |||
| BZW1 | deletion | Frame_Shift_Del | c.950delA | p.Asn317ThrfsTer11 | p.N317Tfs*11 | Q7L1Q6 | protein_coding | TCGA-AD-A5EJ-01 | Colorectum | colon adenocarcinoma | Female | >=65 | I/II | Unknown | Unknown | SD |
| Page: 1 2 3 4 5 6 7 |
Top |
Related drugs of malignant transformation related genes |
| Identification of chemicals and drugs interact with genes involved in malignant transfromation |
| (DGIdb 4.0) |
| Entrez ID | Symbol | Category | Interaction Types | Drug Claim Name | Drug Name | PMIDs |
| Page: 1 |

Copyright 2023-Present -The University of Texas Health Science Center at Houston |