
|
|||||
|
 | |
| |
| |
| |
| |
| |
|
Gene: ATPIF1 |
Gene summary for ATPIF1 |
| Gene information | Species | Human | Gene symbol | ATPIF1 | Gene ID | 93974 |
| Gene name | ATP synthase inhibitory factor subunit 1 | |
| Gene Alias | ATPI | |
| Cytomap | 1p35.3 | |
| Gene Type | protein-coding | GO ID | GO:0000422 | UniProtAcc | Q9UII2 |
Top |
Malignant transformation analysis |
| Identification of the aberrant gene expression in precancerous and cancerous lesions by comparing the gene expression of stem-like cells in diseased tissues with normal stem cells |
| Entrez ID | Symbol | Replicates | Species | Organ | Tissue | Adj P-value | Log2FC | Malignancy |
| 93974 | ATPIF1 | GSM5353217_PA_PB1A_Pool_2_S107_L004 | Human | Prostate | Tumor | 3.83e-03 | 5.96e-01 | 0.156 |
| 93974 | ATPIF1 | GSM5353218_PA_PB1B_Pool_1_2_S74_L003 | Human | Prostate | Tumor | 1.56e-06 | 6.54e-01 | 0.1479 |
| 93974 | ATPIF1 | GSM5353220_PA_PB1B_Pool_3_S51_L002 | Human | Prostate | Tumor | 3.71e-02 | 3.60e-01 | 0.1531 |
| 93974 | ATPIF1 | GSM5353221_PA_PB2A_Pool_1_3_S25_L001 | Human | Prostate | Tumor | 4.98e-21 | 6.90e-01 | 0.1633 |
| 93974 | ATPIF1 | GSM5353222_PA_PB2B_Pool_1_3_S52_L002 | Human | Prostate | Tumor | 1.37e-13 | 4.75e-01 | 0.1608 |
| 93974 | ATPIF1 | GSM5353223_PA_PB2B_Pool_2_S26_L001 | Human | Prostate | Tumor | 2.19e-13 | 5.30e-01 | 0.1604 |
| 93974 | ATPIF1 | GSM5353224_PA_PR5186_Pool_1_2_3_S27_L001 | Human | Prostate | Tumor | 2.07e-22 | 6.53e-01 | 0.1621 |
| 93974 | ATPIF1 | GSM5353225_PA_PR5196-1_Pool_1_2_3_S53_L002 | Human | Prostate | Tumor | 3.27e-04 | 3.72e-01 | 0.1619 |
| 93974 | ATPIF1 | GSM5353226_PA_PR5196-2_Pool_1_2_3_S54_L002 | Human | Prostate | Tumor | 6.72e-08 | 6.22e-01 | 0.159 |
| 93974 | ATPIF1 | GSM5353227_PA_PR5199-193K_Pool_1_2_3_S55_L002 | Human | Prostate | Tumor | 5.40e-10 | 4.45e-01 | 0.1602 |
| 93974 | ATPIF1 | GSM5353232_PA_PR5249_T1_S3_L001 | Human | Prostate | Tumor | 1.73e-03 | 5.53e-01 | 0.1439 |
| 93974 | ATPIF1 | GSM5353236_PA_PR5251_T1_S7_L001 | Human | Prostate | Tumor | 5.70e-04 | 2.96e-01 | 0.1608 |
| 93974 | ATPIF1 | GSM5353237_PA_PR5251_T2_S8_L001 | Human | Prostate | Tumor | 1.86e-05 | 4.38e-01 | 0.1622 |
| 93974 | ATPIF1 | GSM5353240_PA_PR5254_T1_S15_L001 | Human | Prostate | Tumor | 3.69e-25 | 7.17e-01 | 0.1575 |
| 93974 | ATPIF1 | GSM5353243_PA_PR5261_T1_S23_L002 | Human | Prostate | Tumor | 6.74e-10 | 4.48e-01 | 0.1545 |
| 93974 | ATPIF1 | GSM5353244_PA_PR5261_T2_S24_L002 | Human | Prostate | Tumor | 2.34e-07 | 3.69e-01 | 0.1569 |
| 93974 | ATPIF1 | P1_S1_AK | Human | Skin | AK | 7.41e-14 | -3.30e-01 | -0.3399 |
| 93974 | ATPIF1 | P2_S3_AK | Human | Skin | AK | 1.65e-13 | -3.30e-01 | -0.3287 |
| 93974 | ATPIF1 | P2_S4_SCCIS | Human | Skin | SCCIS | 1.65e-13 | -3.30e-01 | -0.3043 |
| 93974 | ATPIF1 | P3_S6_AK | Human | Skin | AK | 3.32e-14 | -3.30e-01 | -0.3256 |
| Page: 1 2 3 4 5 6 7 8 9 10 11 12 13 |
| Tissue | Expression Dynamics | Abbreviation |
| Colorectum (GSE201348) |  | FAP: Familial adenomatous polyposis |
| CRC: Colorectal cancer | ||
| Colorectum (HTA11) | 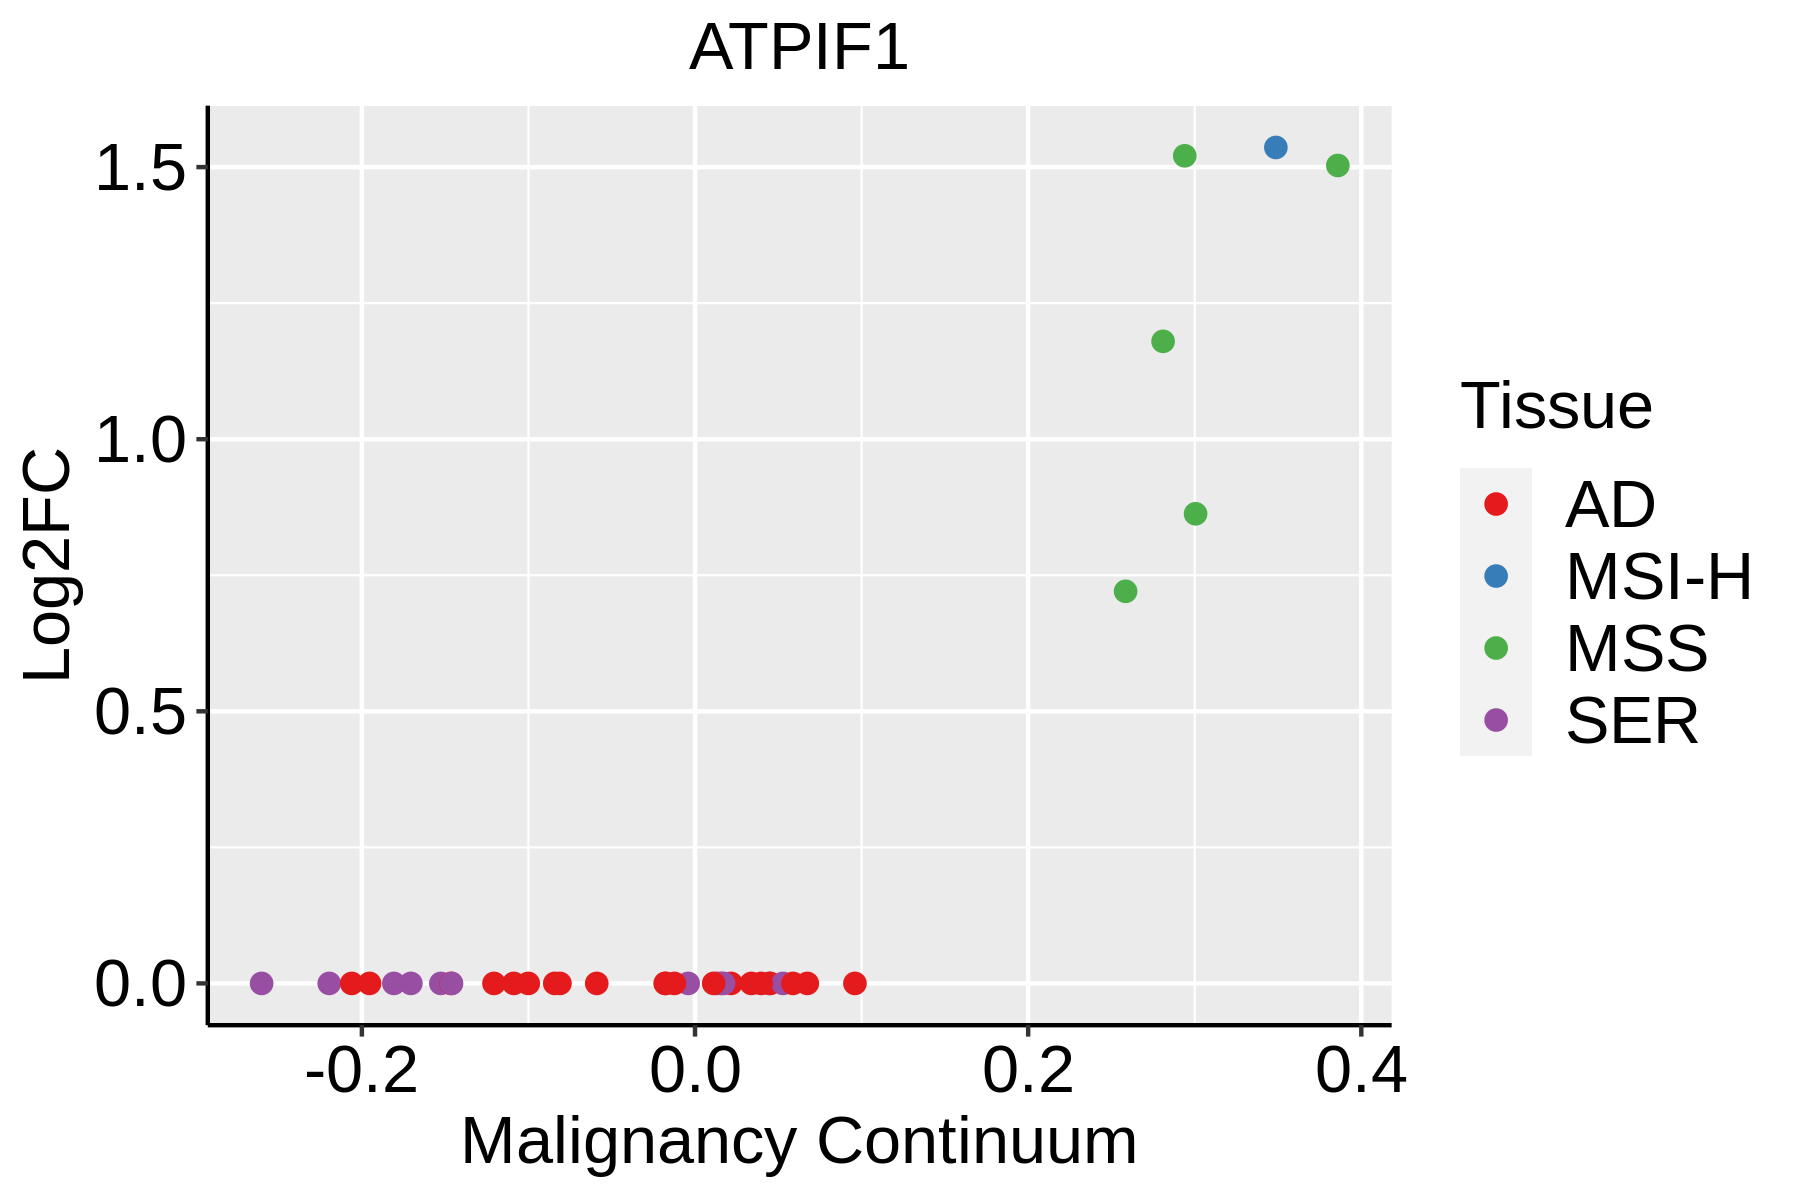 | AD: Adenomas |
| SER: Sessile serrated lesions | ||
| MSI-H: Microsatellite-high colorectal cancer | ||
| MSS: Microsatellite stable colorectal cancer | ||
| Endometrium |  | AEH: Atypical endometrial hyperplasia |
| EEC: Endometrioid Cancer | ||
| Esophagus |  | ESCC: Esophageal squamous cell carcinoma |
| HGIN: High-grade intraepithelial neoplasias | ||
| LGIN: Low-grade intraepithelial neoplasias | ||
| GC | 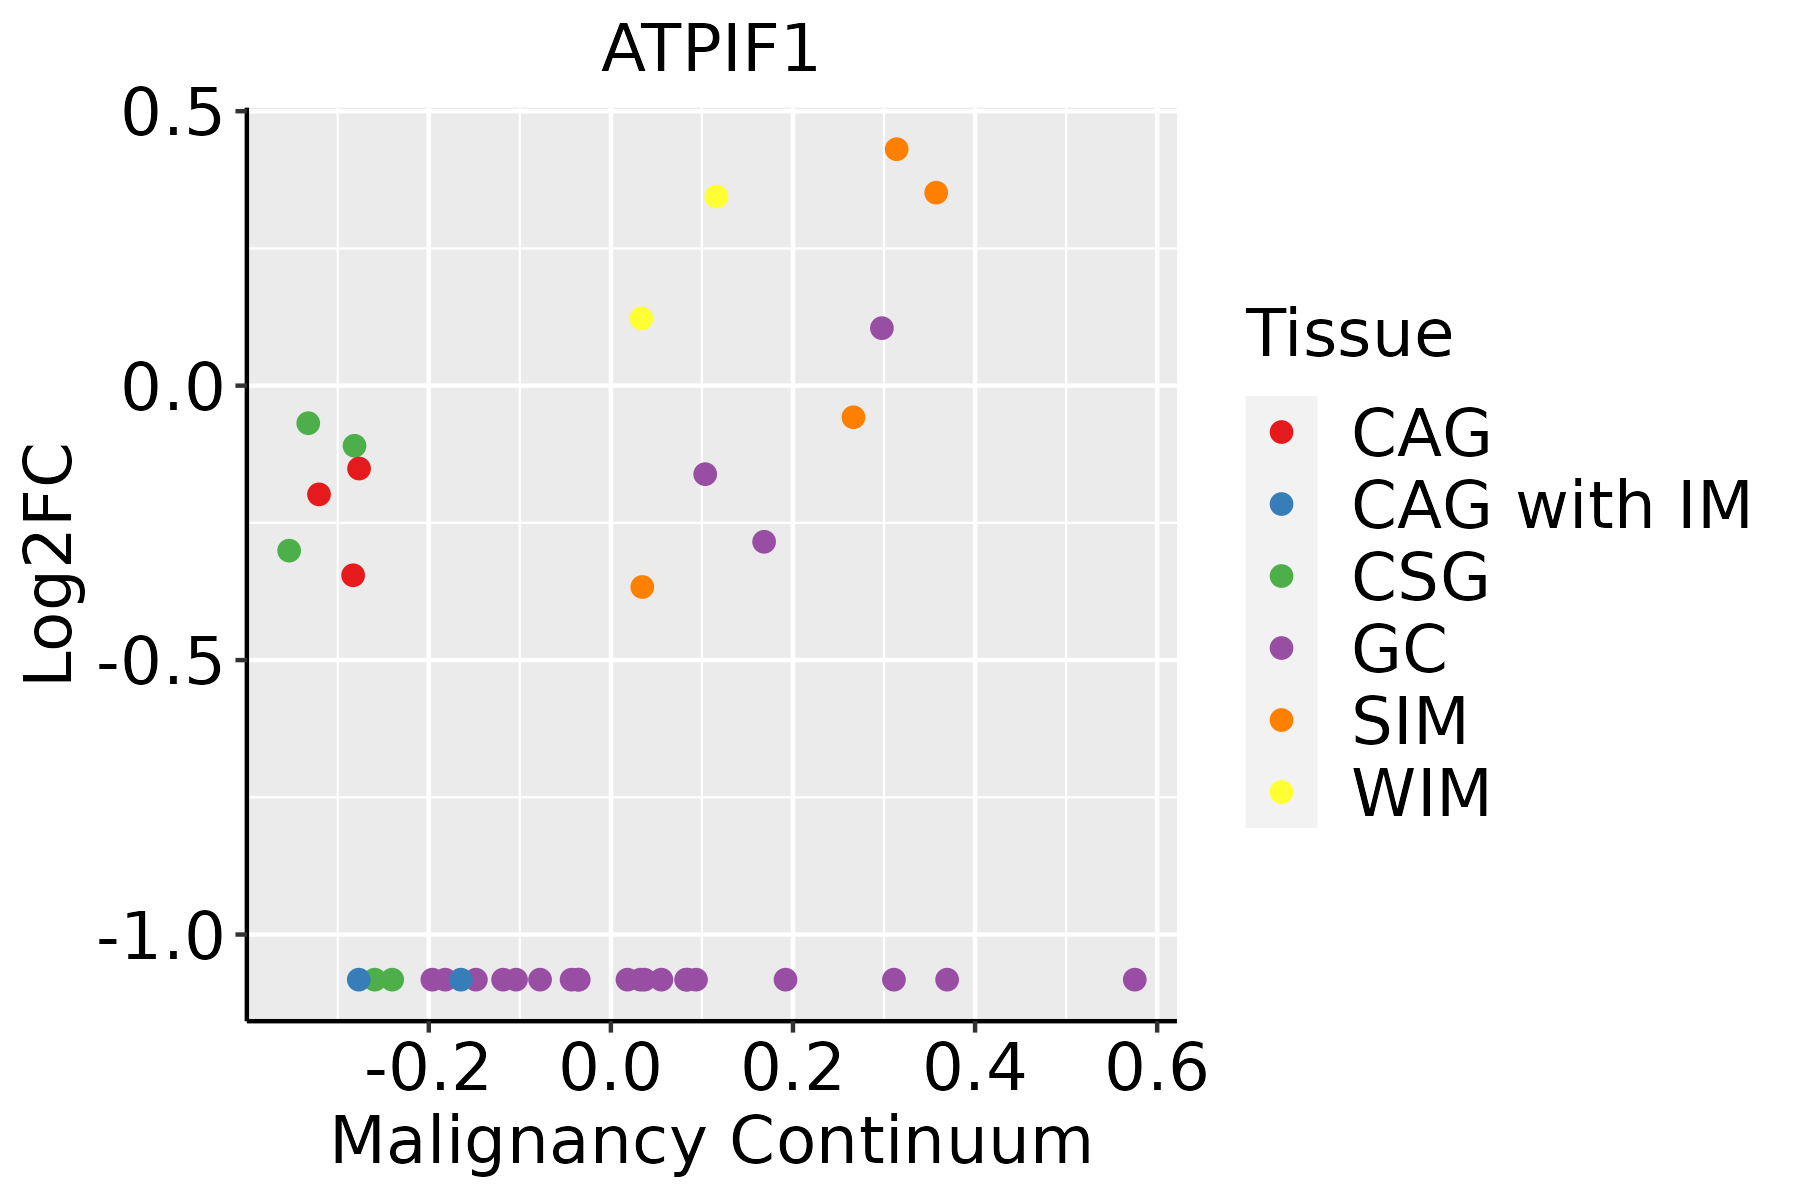 | CAG: Chronic atrophic gastritis |
| CAG with IM: Chronic atrophic gastritis with intestinal metaplasia | ||
| CSG: Chronic superficial gastritis | ||
| GC: Gastric cancer | ||
| SIM: Severe intestinal metaplasia | ||
| WIM: Wild intestinal metaplasia | ||
| Liver | 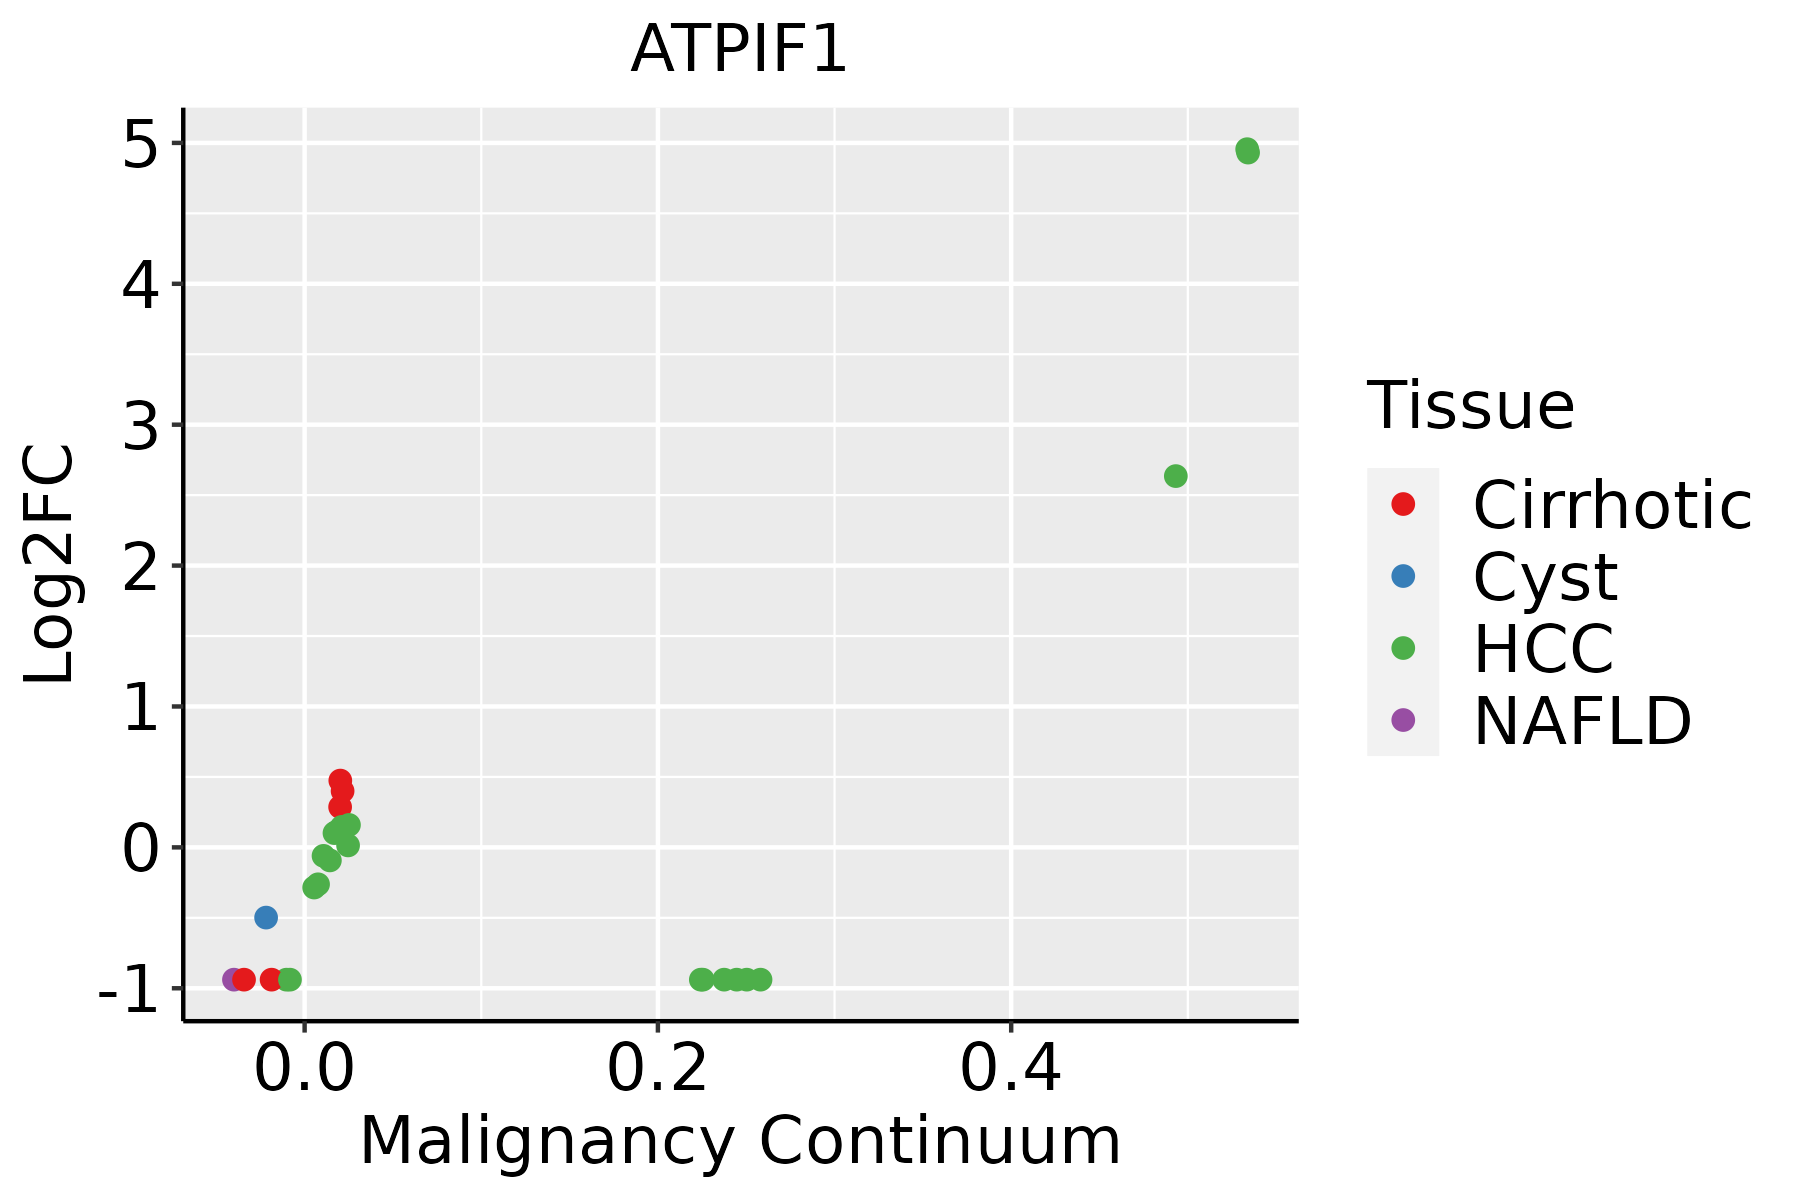 | HCC: Hepatocellular carcinoma |
| NAFLD: Non-alcoholic fatty liver disease | ||
| Lung | 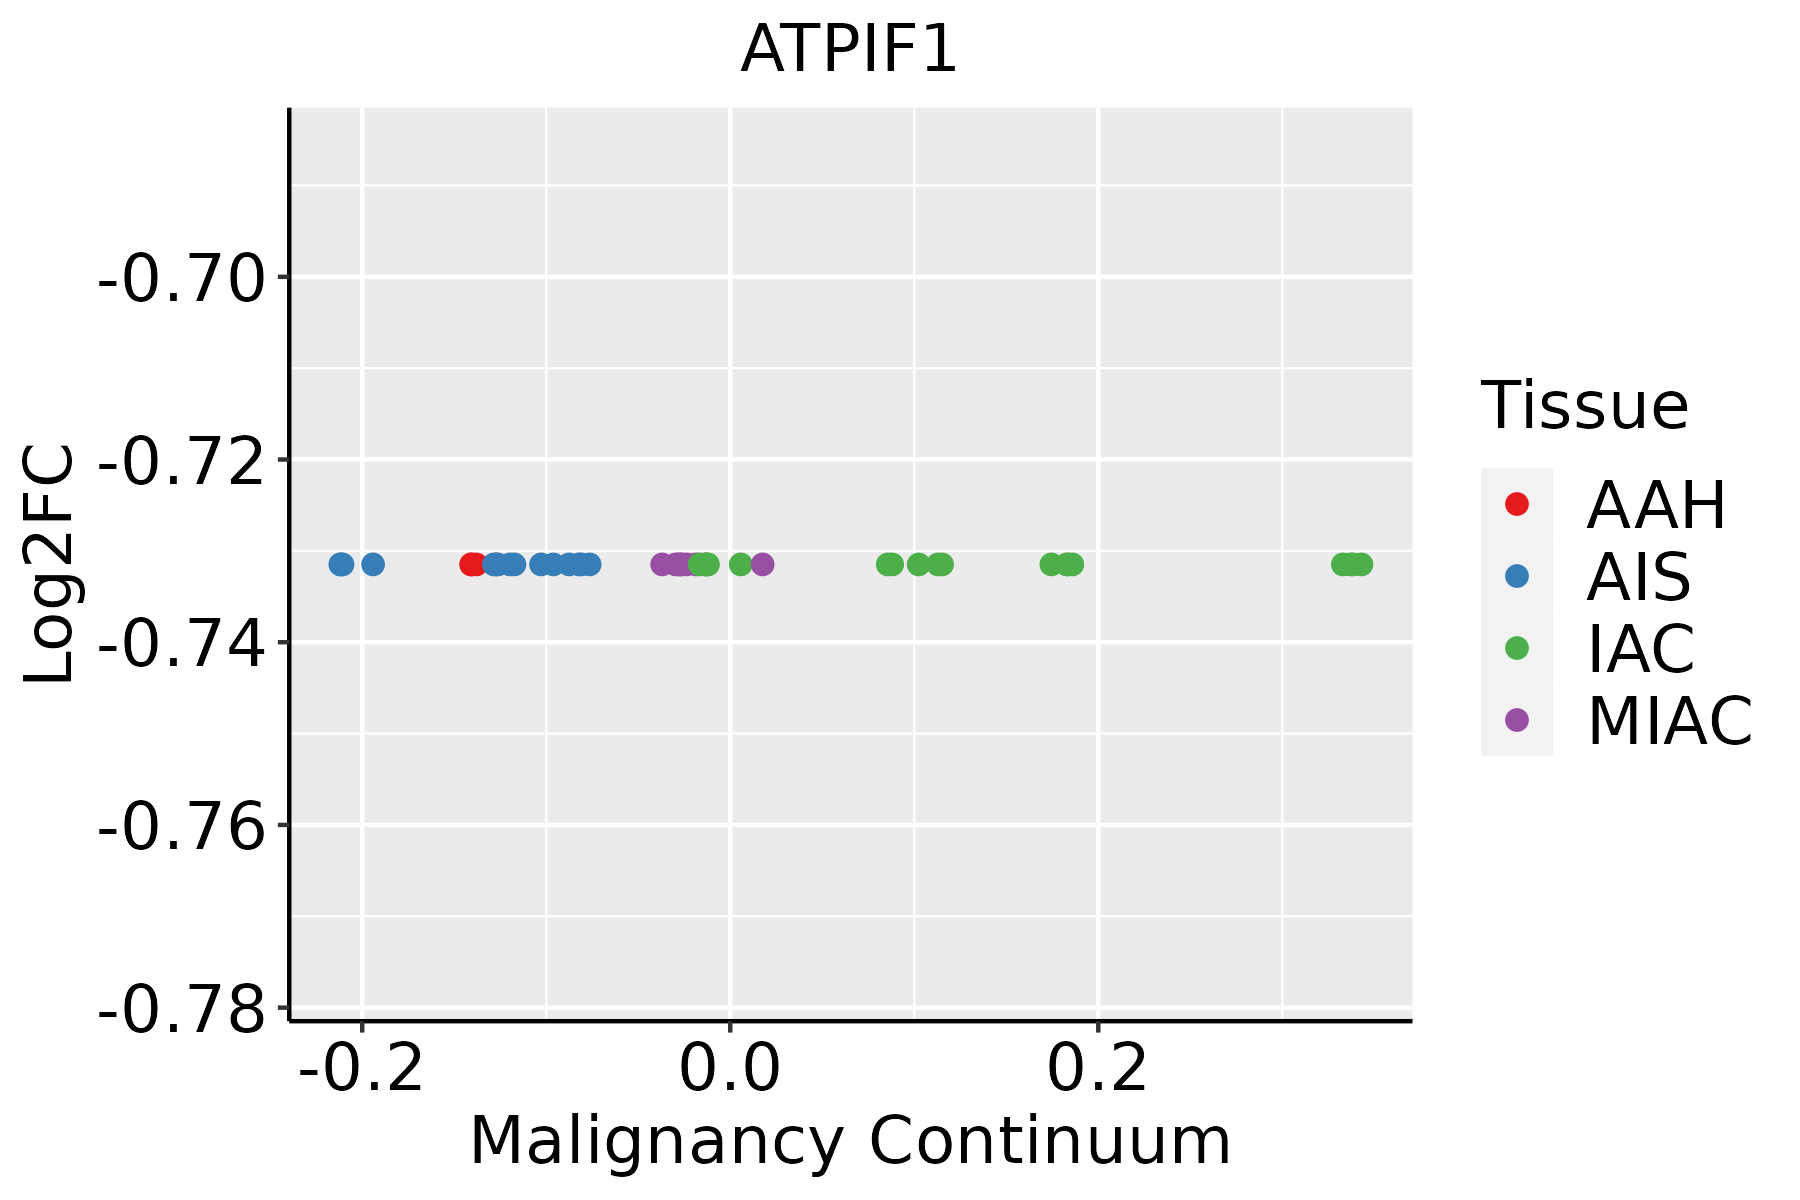 | AAH: Atypical adenomatous hyperplasia |
| AIS: Adenocarcinoma in situ | ||
| IAC: Invasive lung adenocarcinoma | ||
| MIA: Minimally invasive adenocarcinoma | ||
| Oral Cavity | 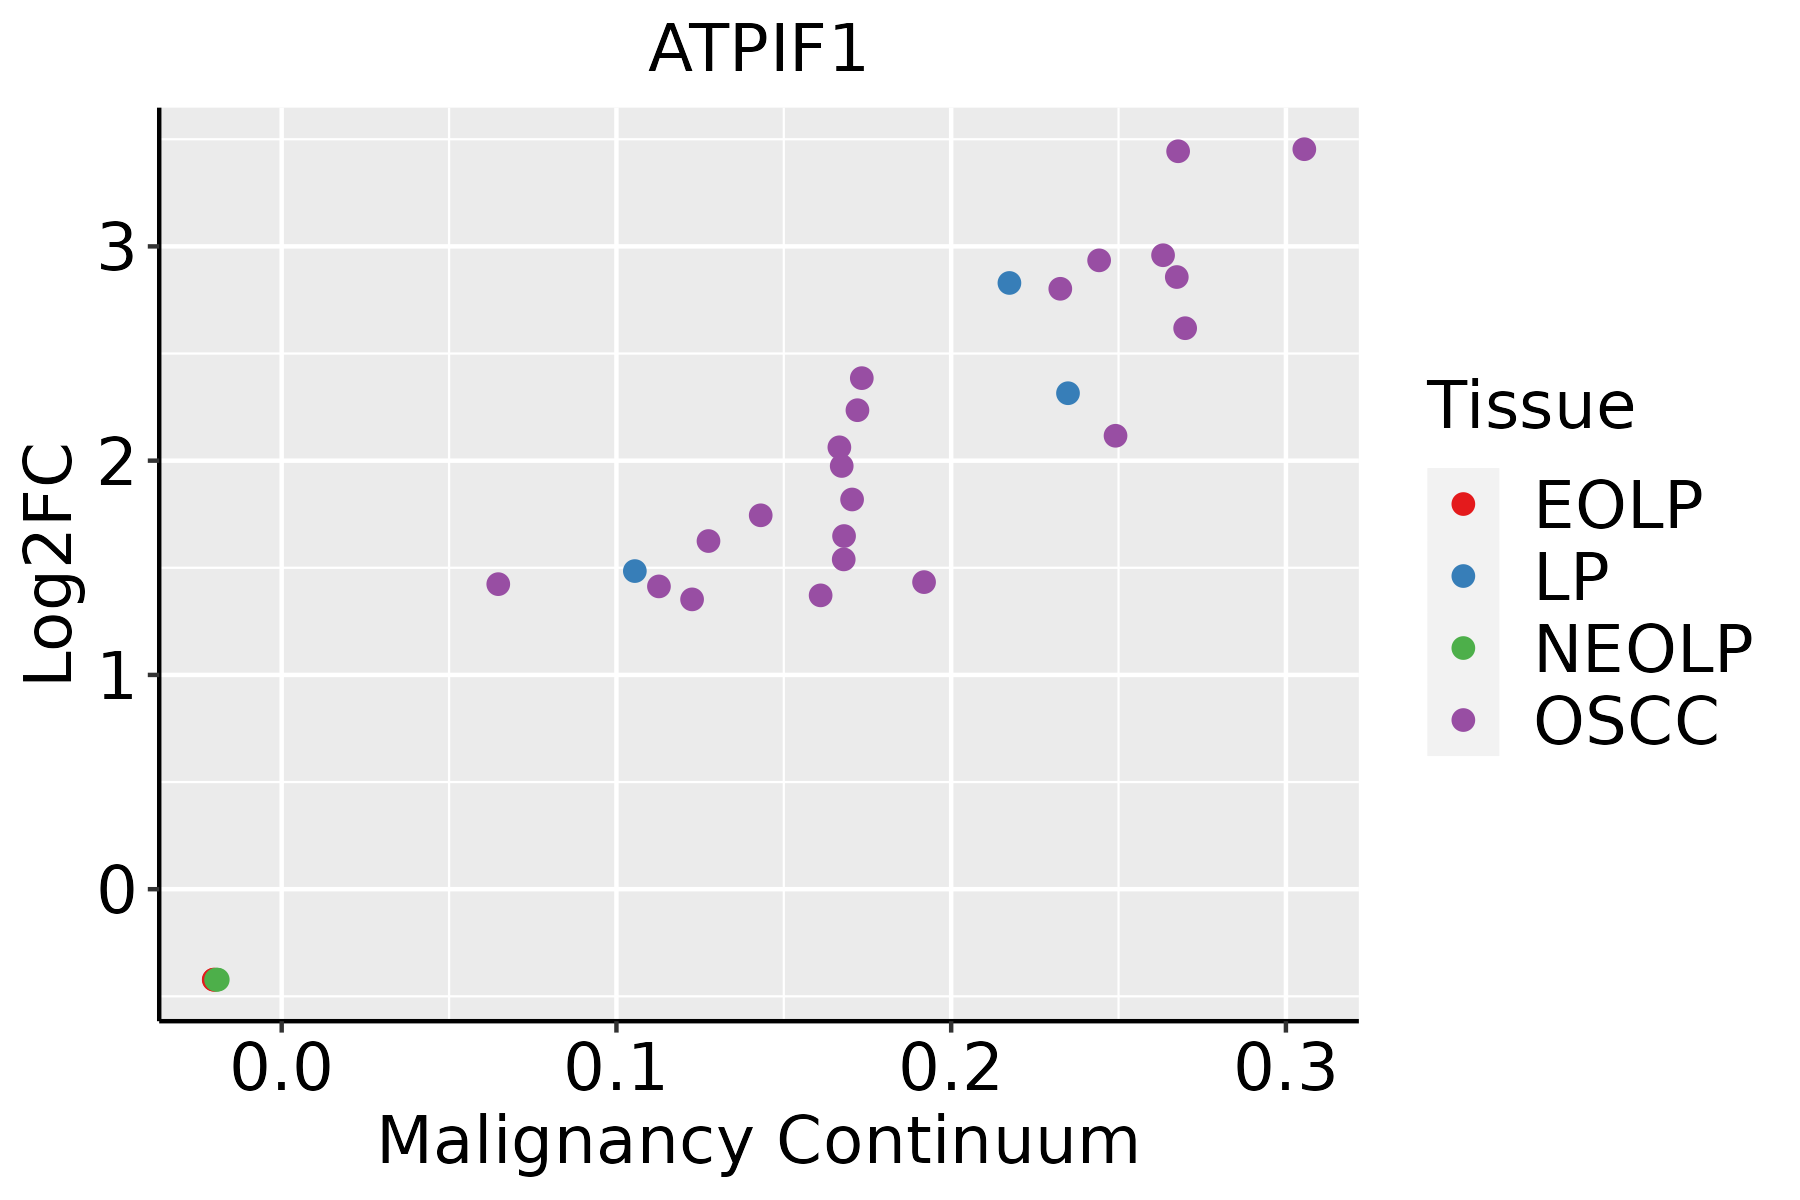 | EOLP: Erosive Oral lichen planus |
| LP: leukoplakia | ||
| NEOLP: Non-erosive oral lichen planus | ||
| OSCC: Oral squamous cell carcinoma | ||
| Prostate | 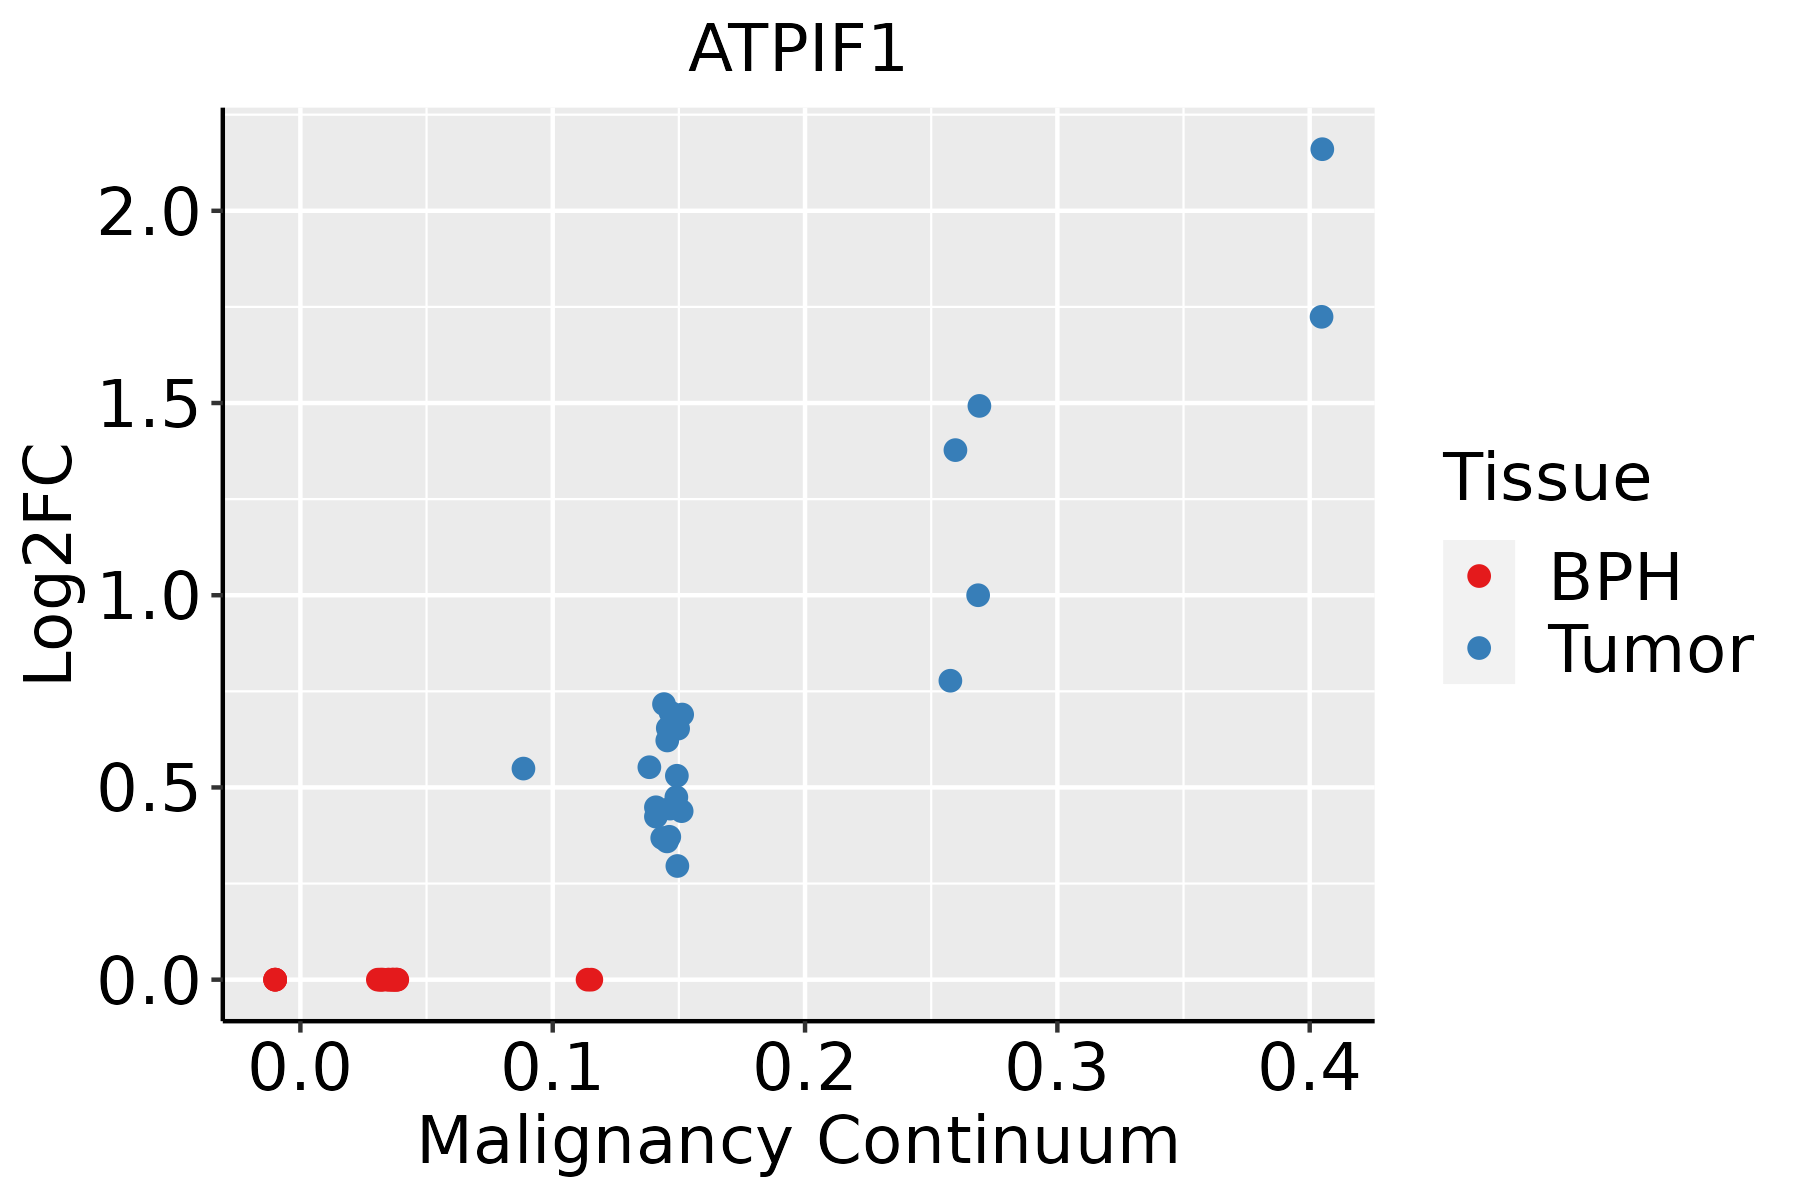 | BPH: Benign Prostatic Hyperplasia |
| Skin |  | AK: Actinic keratosis |
| cSCC: Cutaneous squamous cell carcinoma | ||
| SCCIS:squamous cell carcinoma in situ | ||
| Thyroid |  | ATC: Anaplastic thyroid cancer |
| HT: Hashimoto's thyroiditis | ||
| PTC: Papillary thyroid cancer |
| ∗log2FC in expression of this searched gene in stem-like cells from each diseased tissue sample relative to stem-like cells in normal samples in each tissue plotted against the malignancy continuum. Samples are colored based on if they are from different disease stage. |
Top |
Malignant transformation related pathway analysis |
| Find out the enriched GO biological processes and KEGG pathways involved in transition from healthy to precancer to cancer |
| Tissue | Disease Stage | Enriched GO biological Processes |
| Colorectum | AD |  |
| Colorectum | SER |  |
| Colorectum | MSS |  |
| Colorectum | MSI-H |  |
| Colorectum | FAP |  |
| ∗Top 15 enriched GO BP terms are showed in the bar plot of each disease state in each tissue. Each row represents a significant GO biological process which is colored according to the -log10(p.adjust). |
| Page: 1 2 3 4 5 6 7 8 9 |
| GO ID | Tissue | Disease Stage | Description | Gene Ratio | Bg Ratio | pvalue | p.adjust | Count |
| Page: 1 |
| Pathway ID | Tissue | Disease Stage | Description | Gene Ratio | Bg Ratio | pvalue | p.adjust | qvalue | Count |
| Page: 1 |
Top |
Cell-cell communication analysis |
| Identification of potential cell-cell interactions between two cell types and their ligand-receptor pairs for different disease states |
| Ligand | Receptor | LRpair | Pathway | Tissue | Disease Stage |
| Page: 1 |
Top |
Single-cell gene regulatory network inference analysis |
| Find out the significant the regulons (TFs) and the target genes of each regulon across cell types for different disease states |
| TF | Cell Type | Tissue | Disease Stage | Target Gene | RSS | Regulon Activity |
| ∗The dot plots of a searched regulon are shown for all cell subpopulations in each disease state of each tissue based on the regulon specific score inferred using pySCENIC and by calculating the average expression. |
| Page: 1 |
Top |
Somatic mutation of malignant transformation related genes |
| Annotation of somatic variants for genes involved in malignant transformation |
| Hugo Symbol | Variant Class | Variant Classification | dbSNP RS | HGVSc | HGVSp | HGVSp Short | SWISSPROT | BIOTYPE | SIFT | PolyPhen | Tumor Sample Barcode | Tissue | Histology | Sex | Age | Stage | Therapy Types | Drugs | Outcome |
| ATPIF1 | SNV | Missense_Mutation | novel | c.5N>G | p.Ala2Gly | p.A2G | Q9UII2 | protein_coding | deleterious(0.01) | probably_damaging(0.998) | TCGA-A2-A3Y0-01 | Breast | breast invasive carcinoma | Female | <65 | I/II | Chemotherapy | adriamycin | CR |
| ATPIF1 | insertion | Frame_Shift_Ins | novel | c.129_130insTCTATCTATATGGATTTACCTATTCT | p.Gly44SerfsTer36 | p.G44Sfs*36 | Q9UII2 | protein_coding | TCGA-BH-A0HX-01 | Breast | breast invasive carcinoma | Female | <65 | I/II | Chemotherapy | adrimycin | SD | ||
| ATPIF1 | SNV | Missense_Mutation | c.124N>A | p.Glu42Lys | p.E42K | Q9UII2 | protein_coding | deleterious(0) | benign(0.432) | TCGA-IR-A3LH-01 | Cervix | cervical & endocervical cancer | Female | <65 | I/II | Chemotherapy | cisplatin | CR | |
| ATPIF1 | SNV | Missense_Mutation | c.160G>A | p.Glu54Lys | p.E54K | Q9UII2 | protein_coding | deleterious(0) | probably_damaging(0.974) | TCGA-IR-A3LL-01 | Cervix | cervical & endocervical cancer | Female | <65 | I/II | Chemotherapy | cisplatin | CR | |
| ATPIF1 | SNV | Missense_Mutation | c.136G>T | p.Ala46Ser | p.A46S | Q9UII2 | protein_coding | tolerated(0.11) | benign(0.312) | TCGA-B5-A11E-01 | Endometrium | uterine corpus endometrioid carcinoma | Female | <65 | I/II | Unknown | Unknown | SD | |
| ATPIF1 | SNV | Missense_Mutation | rs374584642 | c.280N>T | p.Arg94Cys | p.R94C | Q9UII2 | protein_coding | deleterious(0) | probably_damaging(0.968) | TCGA-D1-A103-01 | Endometrium | uterine corpus endometrioid carcinoma | Female | >=65 | I/II | Unknown | Unknown | SD |
| ATPIF1 | SNV | Missense_Mutation | rs754730947 | c.244N>C | p.Lys82Gln | p.K82Q | Q9UII2 | protein_coding | tolerated(0.21) | benign(0.081) | TCGA-44-2659-01 | Lung | lung adenocarcinoma | Female | >=65 | I/II | Chemotherapy | alimta | PD |
| ATPIF1 | SNV | Missense_Mutation | rs780836240 | c.246N>T | p.Lys82Asn | p.K82N | Q9UII2 | protein_coding | tolerated(0.06) | benign(0.343) | TCGA-44-2659-01 | Lung | lung adenocarcinoma | Female | >=65 | I/II | Chemotherapy | alimta | PD |
| ATPIF1 | SNV | Missense_Mutation | novel | c.243N>A | p.His81Gln | p.H81Q | Q9UII2 | protein_coding | deleterious(0.03) | probably_damaging(0.953) | TCGA-21-1082-01 | Lung | lung squamous cell carcinoma | Male | <65 | I/II | Unknown | Unknown | SD |
| ATPIF1 | SNV | Missense_Mutation | c.142G>C | p.Gly48Arg | p.G48R | Q9UII2 | protein_coding | deleterious(0) | probably_damaging(0.985) | TCGA-CG-4469-01 | Stomach | stomach adenocarcinoma | Male | >=65 | III/IV | Chemotherapy | cisplatin | SD |
| Page: 1 |
Top |
Related drugs of malignant transformation related genes |
| Identification of chemicals and drugs interact with genes involved in malignant transfromation |
| (DGIdb 4.0) |
| Entrez ID | Symbol | Category | Interaction Types | Drug Claim Name | Drug Name | PMIDs |
| Page: 1 |

Copyright 2023-Present -The University of Texas Health Science Center at Houston |