| Entrez ID | Symbol | Replicates | Species | Organ | Tissue | Adj P-value | Log2FC | Malignancy |
| 93974 | ATP5IF1 | Dong_P3 | Human | Prostate | Tumor | 2.34e-16 | -5.82e-01 | 0.0278 |
| 93974 | ATP5IF1 | Dong_P4 | Human | Prostate | Tumor | 1.26e-04 | -5.82e-01 | 0.0292 |
| 93974 | ATP5IF1 | Dong_P5 | Human | Prostate | Tumor | 3.21e-26 | 5.57e-01 | 0.053 |
| 93974 | ATP5IF1 | Dong_P6 | Human | Prostate | Tumor | 6.90e-09 | 5.40e-01 | 0.0371 |
| 93974 | ATP5IF1 | P7 | Human | Prostate | Tumor | 3.06e-05 | -5.82e-01 | -0.1025 |
| 93974 | ATP5IF1 | P9 | Human | Prostate | Tumor | 2.35e-11 | -5.82e-01 | -0.0285 |
| 93974 | ATP5IF1 | P10 | Human | Prostate | Tumor | 1.16e-12 | -5.82e-01 | -0.0902 |
| 93974 | ATP5IF1 | GSM5353221_PA_PB2A_Pool_1_3_S25_L001 | Human | Prostate | Tumor | 2.55e-09 | -5.82e-01 | 0.1633 |
| 93974 | ATP5IF1 | GSM5353222_PA_PB2B_Pool_1_3_S52_L002 | Human | Prostate | Tumor | 8.39e-14 | -5.82e-01 | 0.1608 |
| 93974 | ATP5IF1 | GSM5353223_PA_PB2B_Pool_2_S26_L001 | Human | Prostate | Tumor | 1.28e-07 | -5.82e-01 | 0.1604 |
| 93974 | ATP5IF1 | GSM5353224_PA_PR5186_Pool_1_2_3_S27_L001 | Human | Prostate | Tumor | 2.46e-08 | -5.82e-01 | 0.1621 |
| 93974 | ATP5IF1 | GSM5353225_PA_PR5196-1_Pool_1_2_3_S53_L002 | Human | Prostate | Tumor | 1.60e-03 | -5.82e-01 | 0.1619 |
| 93974 | ATP5IF1 | GSM5353227_PA_PR5199-193K_Pool_1_2_3_S55_L002 | Human | Prostate | Tumor | 7.15e-10 | -5.82e-01 | 0.1602 |
| 93974 | ATP5IF1 | GSM5353236_PA_PR5251_T1_S7_L001 | Human | Prostate | Tumor | 5.34e-04 | -5.82e-01 | 0.1608 |
| 93974 | ATP5IF1 | GSM5353240_PA_PR5254_T1_S15_L001 | Human | Prostate | Tumor | 4.03e-16 | -5.82e-01 | 0.1575 |
| 93974 | ATP5IF1 | GSM5353243_PA_PR5261_T1_S23_L002 | Human | Prostate | Tumor | 7.22e-18 | -5.82e-01 | 0.1545 |
| 93974 | ATP5IF1 | GSM5353244_PA_PR5261_T2_S24_L002 | Human | Prostate | Tumor | 2.00e-13 | -5.82e-01 | 0.1569 |
| 93974 | ATP5IF1 | P1_S1_AK | Human | Skin | AK | 1.88e-11 | 3.44e-01 | -0.3399 |
| 93974 | ATP5IF1 | P2_S3_AK | Human | Skin | AK | 3.08e-18 | 4.23e-01 | -0.3287 |
| 93974 | ATP5IF1 | P2_S4_SCCIS | Human | Skin | SCCIS | 1.86e-05 | 3.63e-01 | -0.3043 |
| Tissue | Expression Dynamics | Abbreviation |
| Breast | 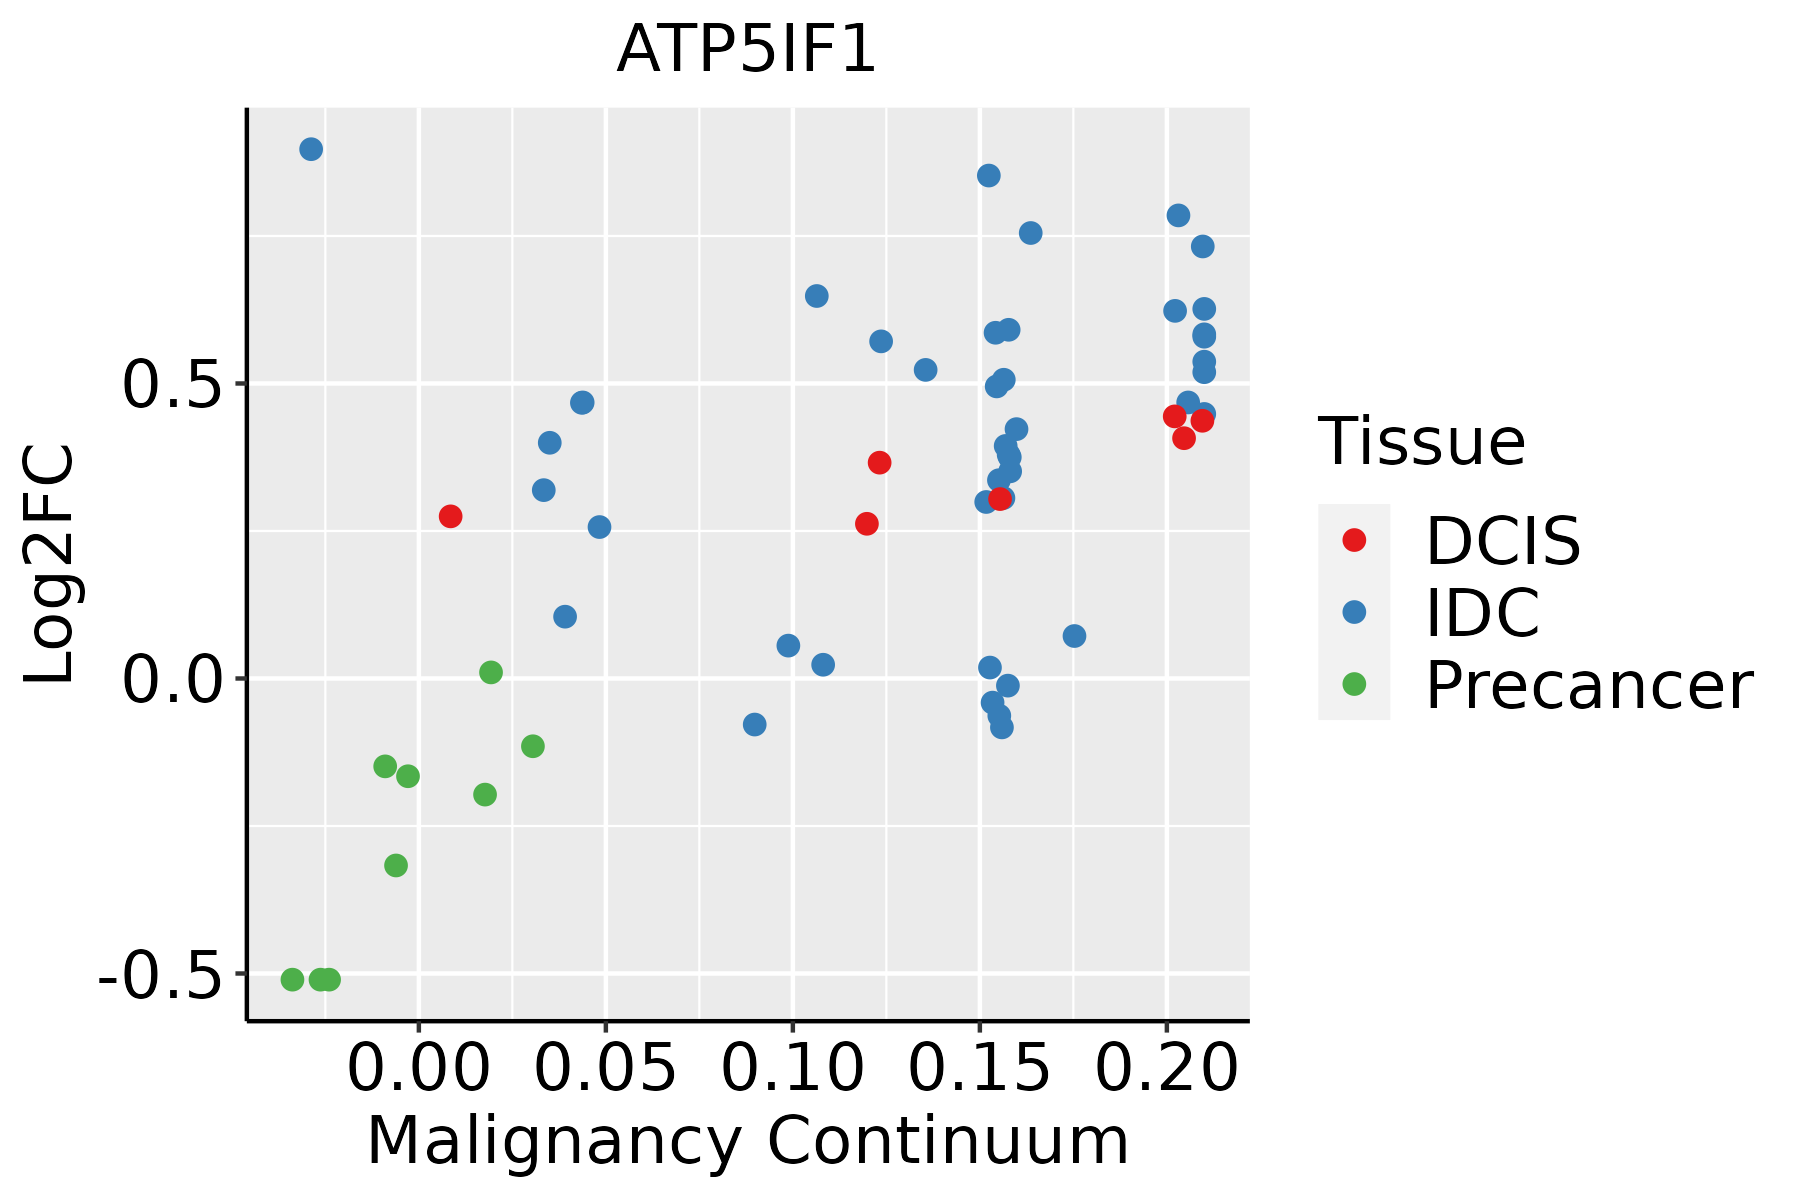 | IDC: Invasive ductal carcinoma |
| DCIS: Ductal carcinoma in situ |
| Precancer(BRCA1-mut): Precancerous lesion from BRCA1 mutation carriers |
| Cervix | 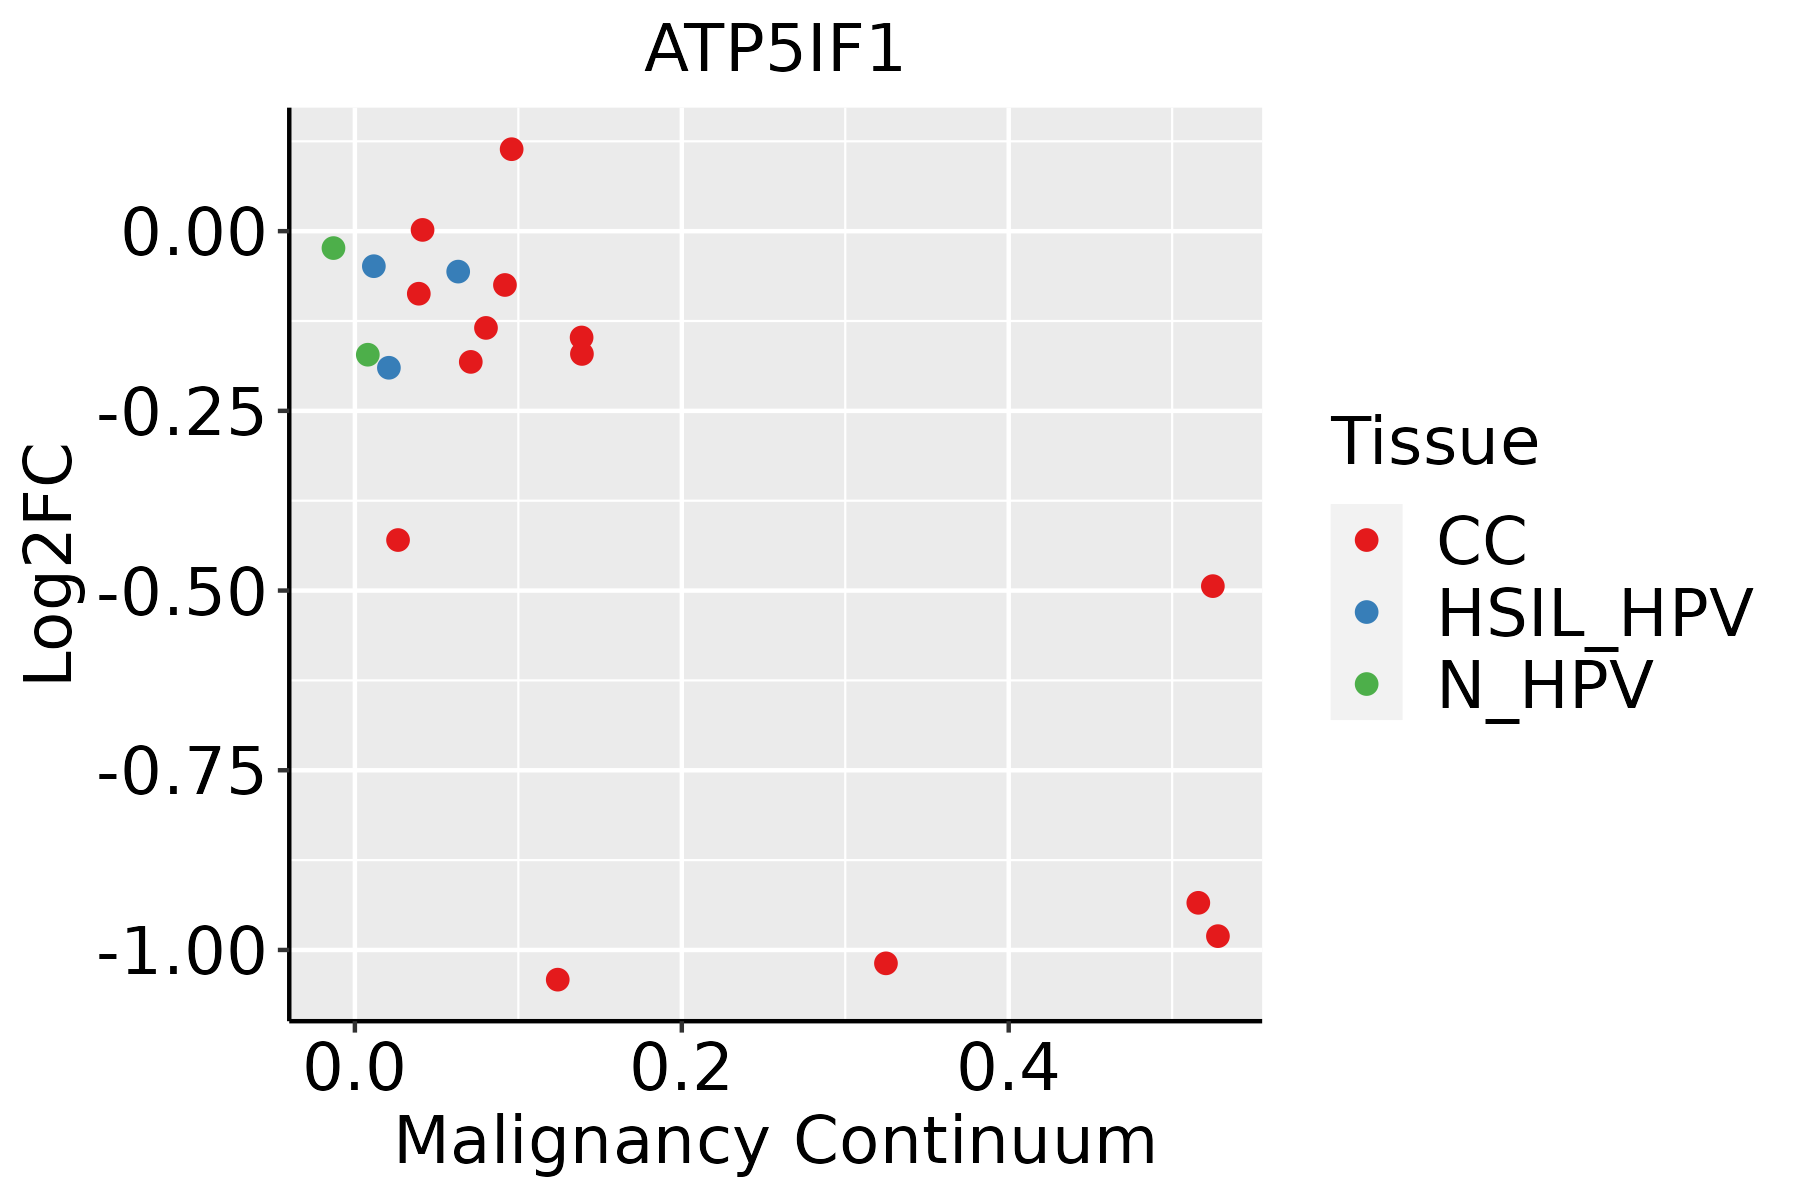 | CC: Cervix cancer |
| HSIL_HPV: HPV-infected high-grade squamous intraepithelial lesions |
| N_HPV: HPV-infected normal cervix |
| Colorectum (GSE201348) |  | FAP: Familial adenomatous polyposis |
| CRC: Colorectal cancer |
| Colorectum (HTA11) |  | AD: Adenomas |
| SER: Sessile serrated lesions |
| MSI-H: Microsatellite-high colorectal cancer |
| MSS: Microsatellite stable colorectal cancer |
| Endometrium |  | AEH: Atypical endometrial hyperplasia |
| EEC: Endometrioid Cancer |
| Esophagus | 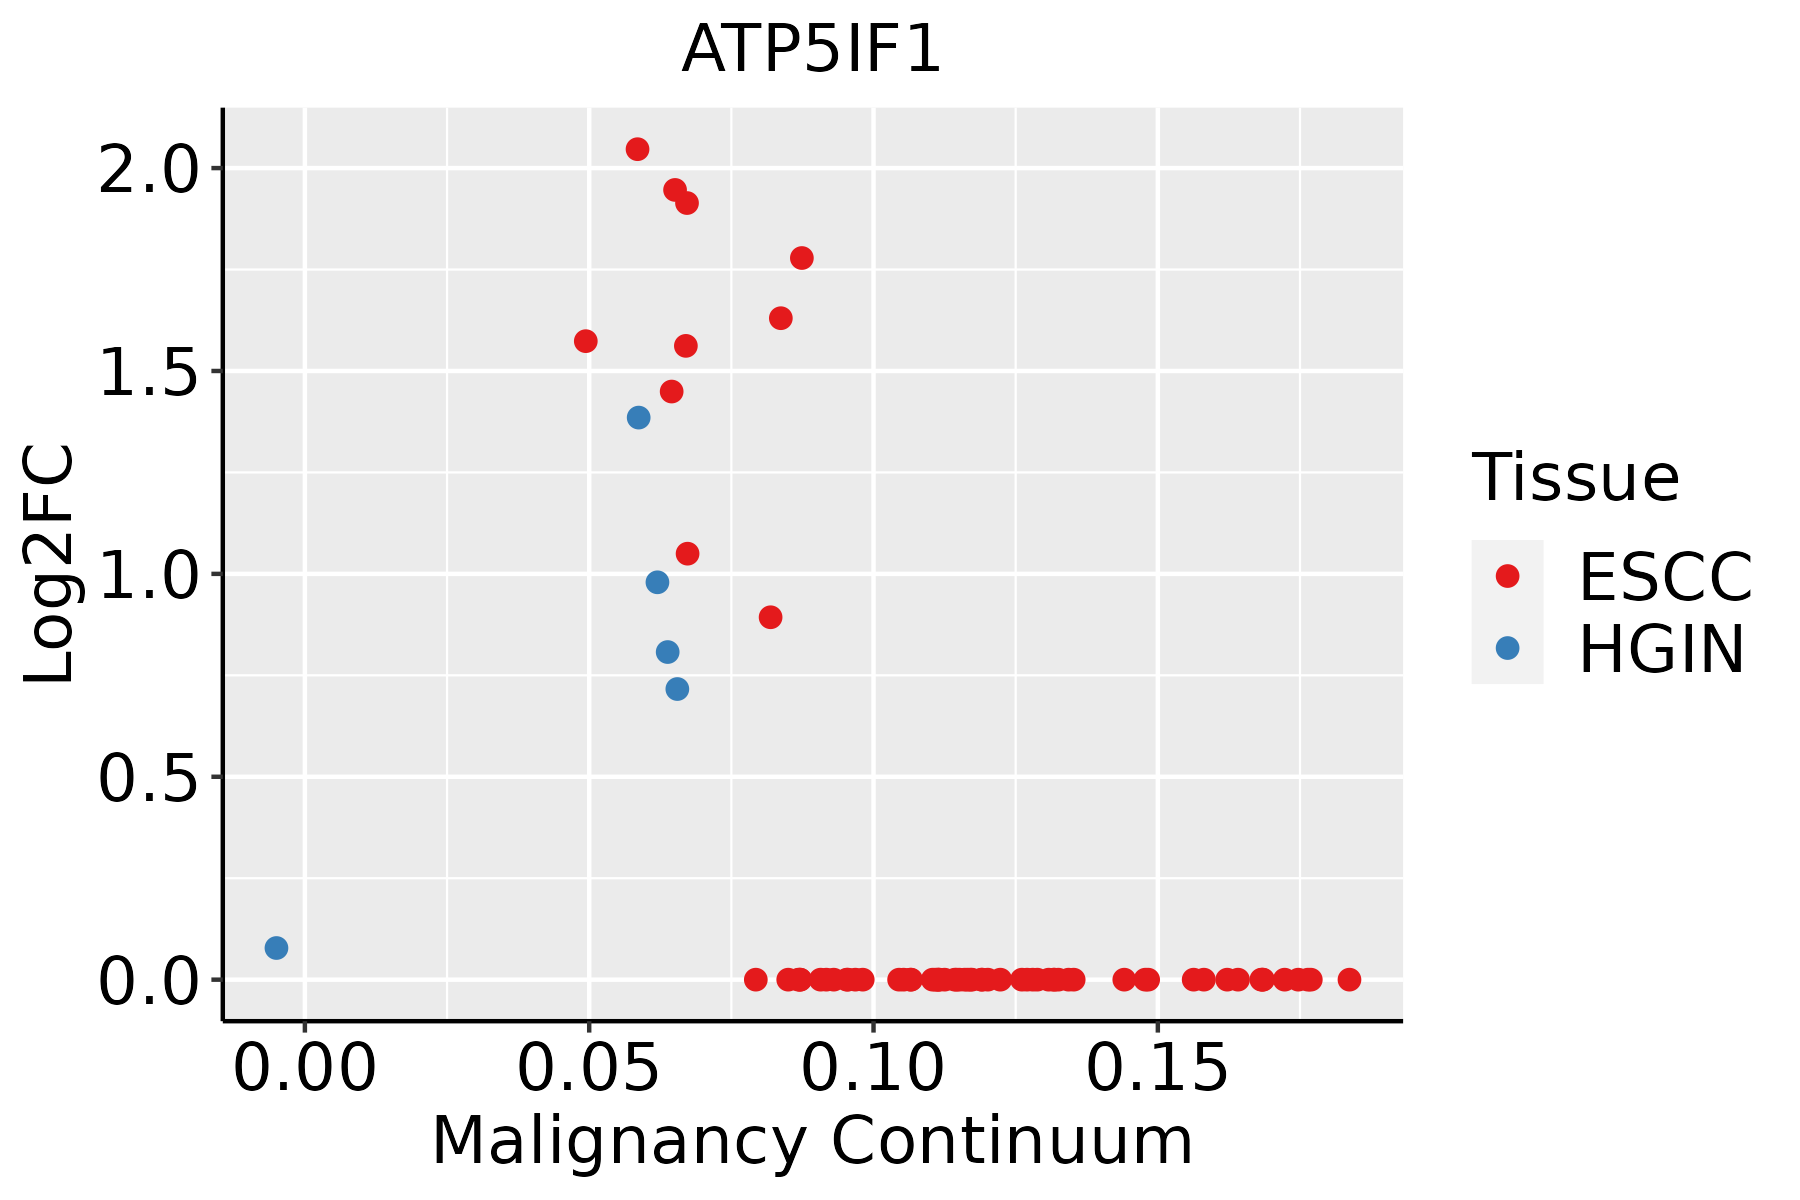 | ESCC: Esophageal squamous cell carcinoma |
| HGIN: High-grade intraepithelial neoplasias |
| LGIN: Low-grade intraepithelial neoplasias |
| GC |  | CAG: Chronic atrophic gastritis |
| CAG with IM: Chronic atrophic gastritis with intestinal metaplasia |
| CSG: Chronic superficial gastritis |
| GC: Gastric cancer |
| SIM: Severe intestinal metaplasia |
| WIM: Wild intestinal metaplasia |
| Liver | 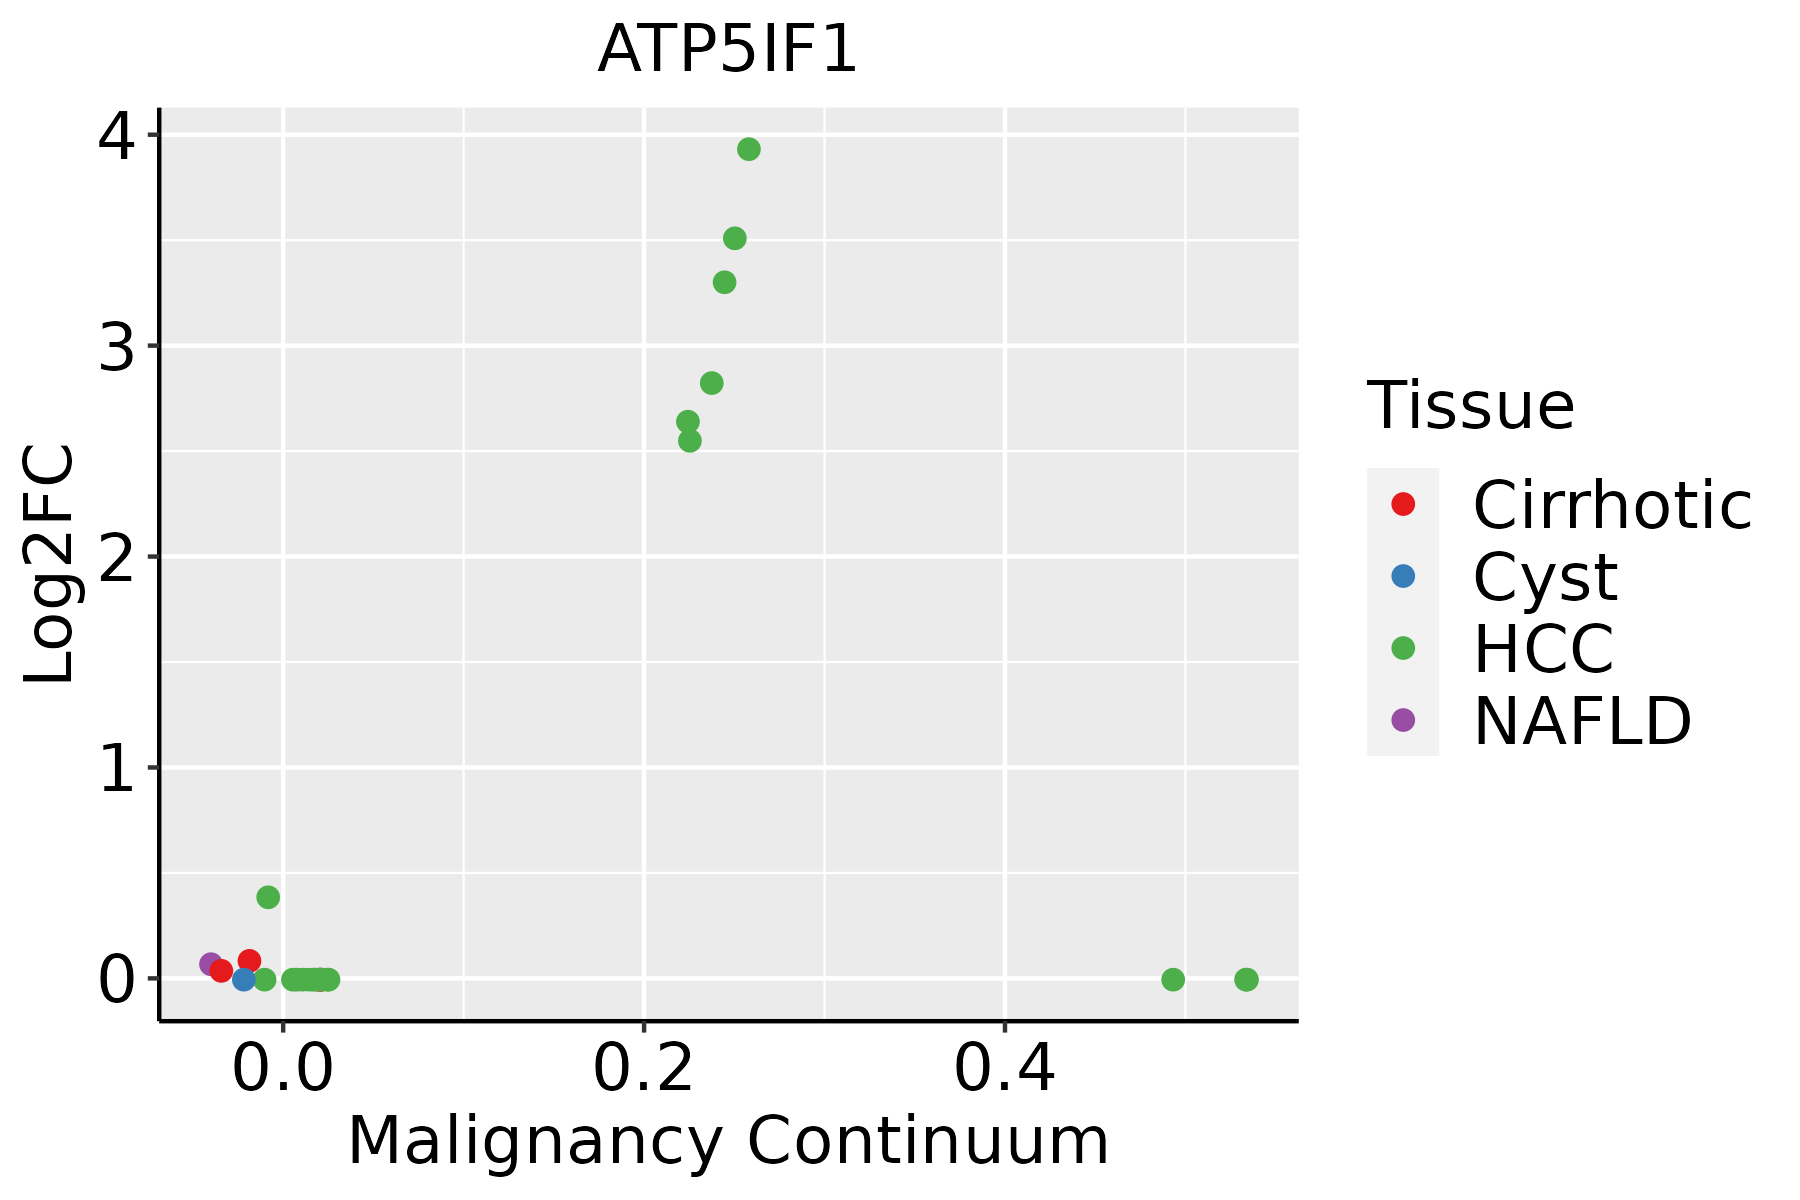 | HCC: Hepatocellular carcinoma |
| NAFLD: Non-alcoholic fatty liver disease |
| Lung | 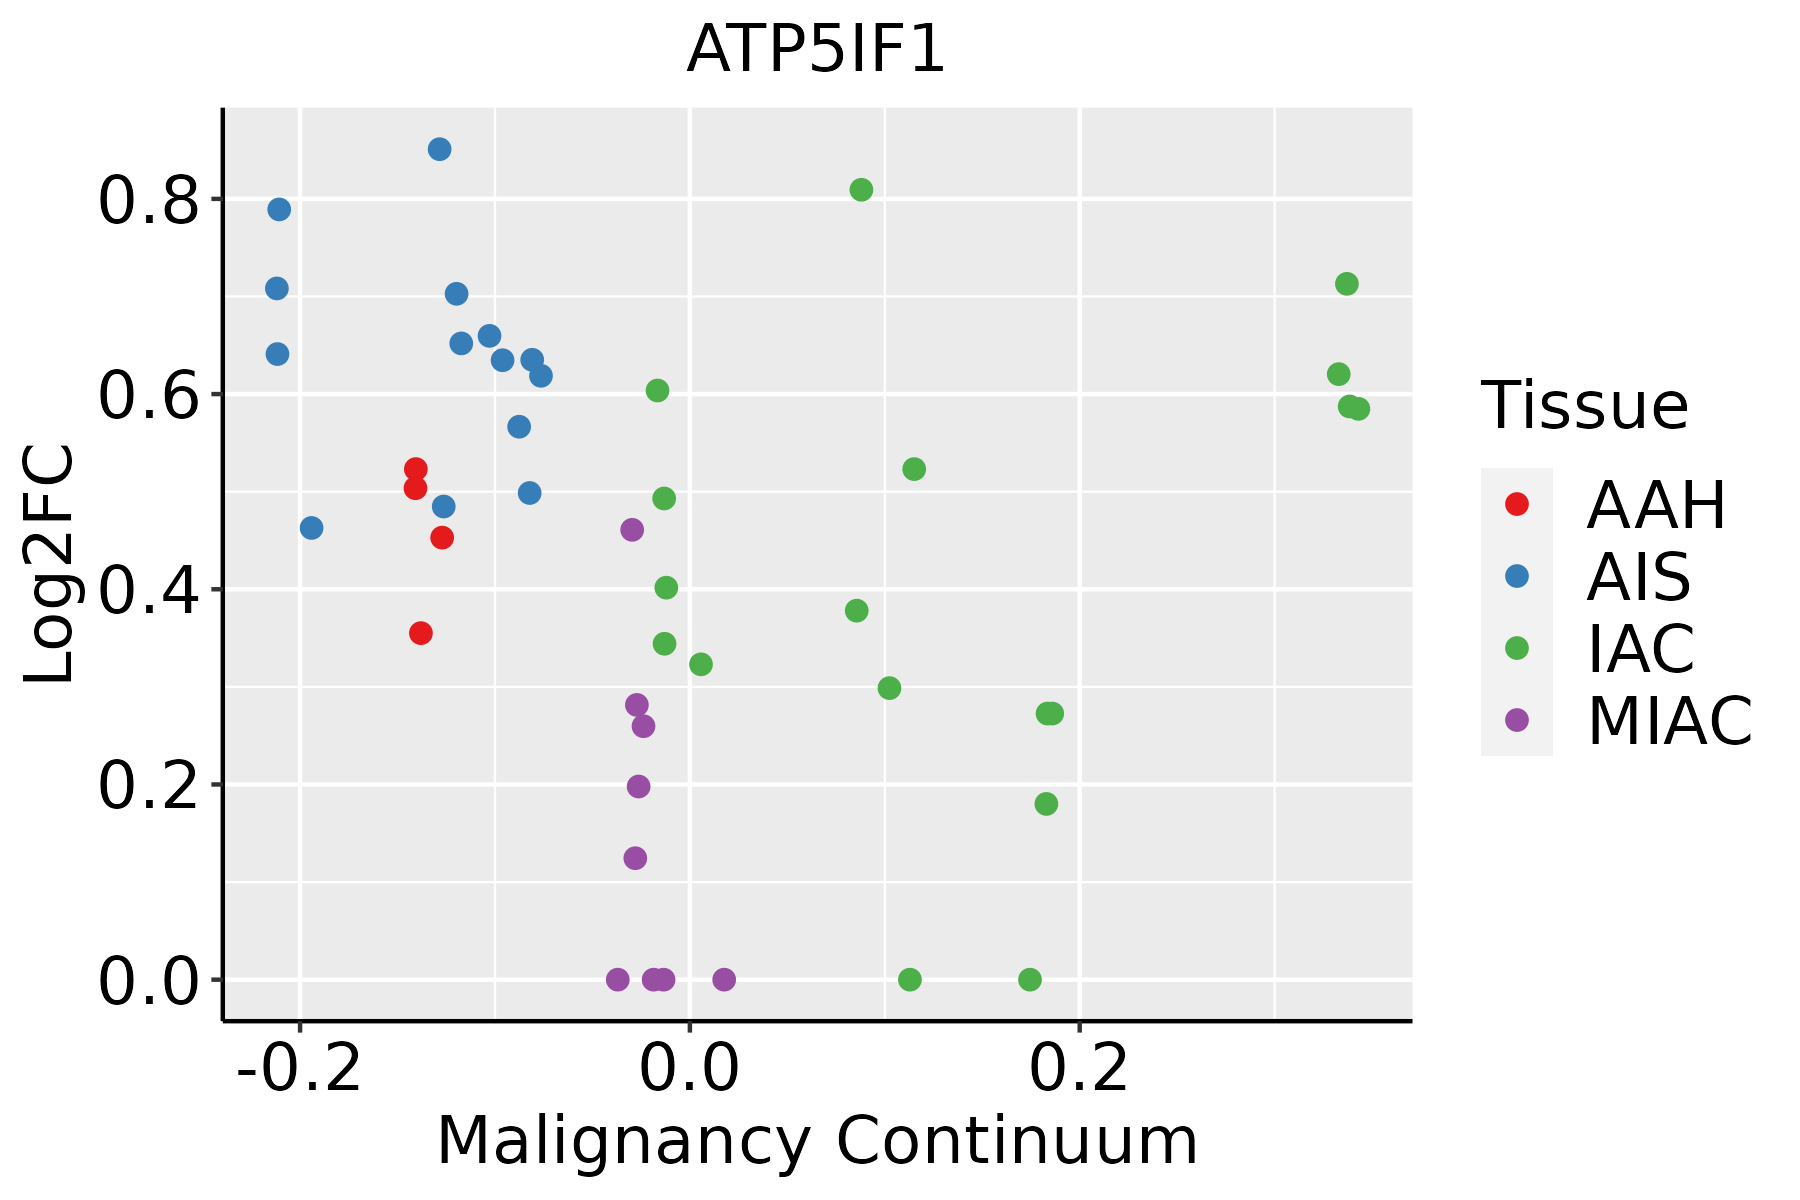 | AAH: Atypical adenomatous hyperplasia |
| AIS: Adenocarcinoma in situ |
| IAC: Invasive lung adenocarcinoma |
| MIA: Minimally invasive adenocarcinoma |
| Prostate |  | BPH: Benign Prostatic Hyperplasia |
| Skin | 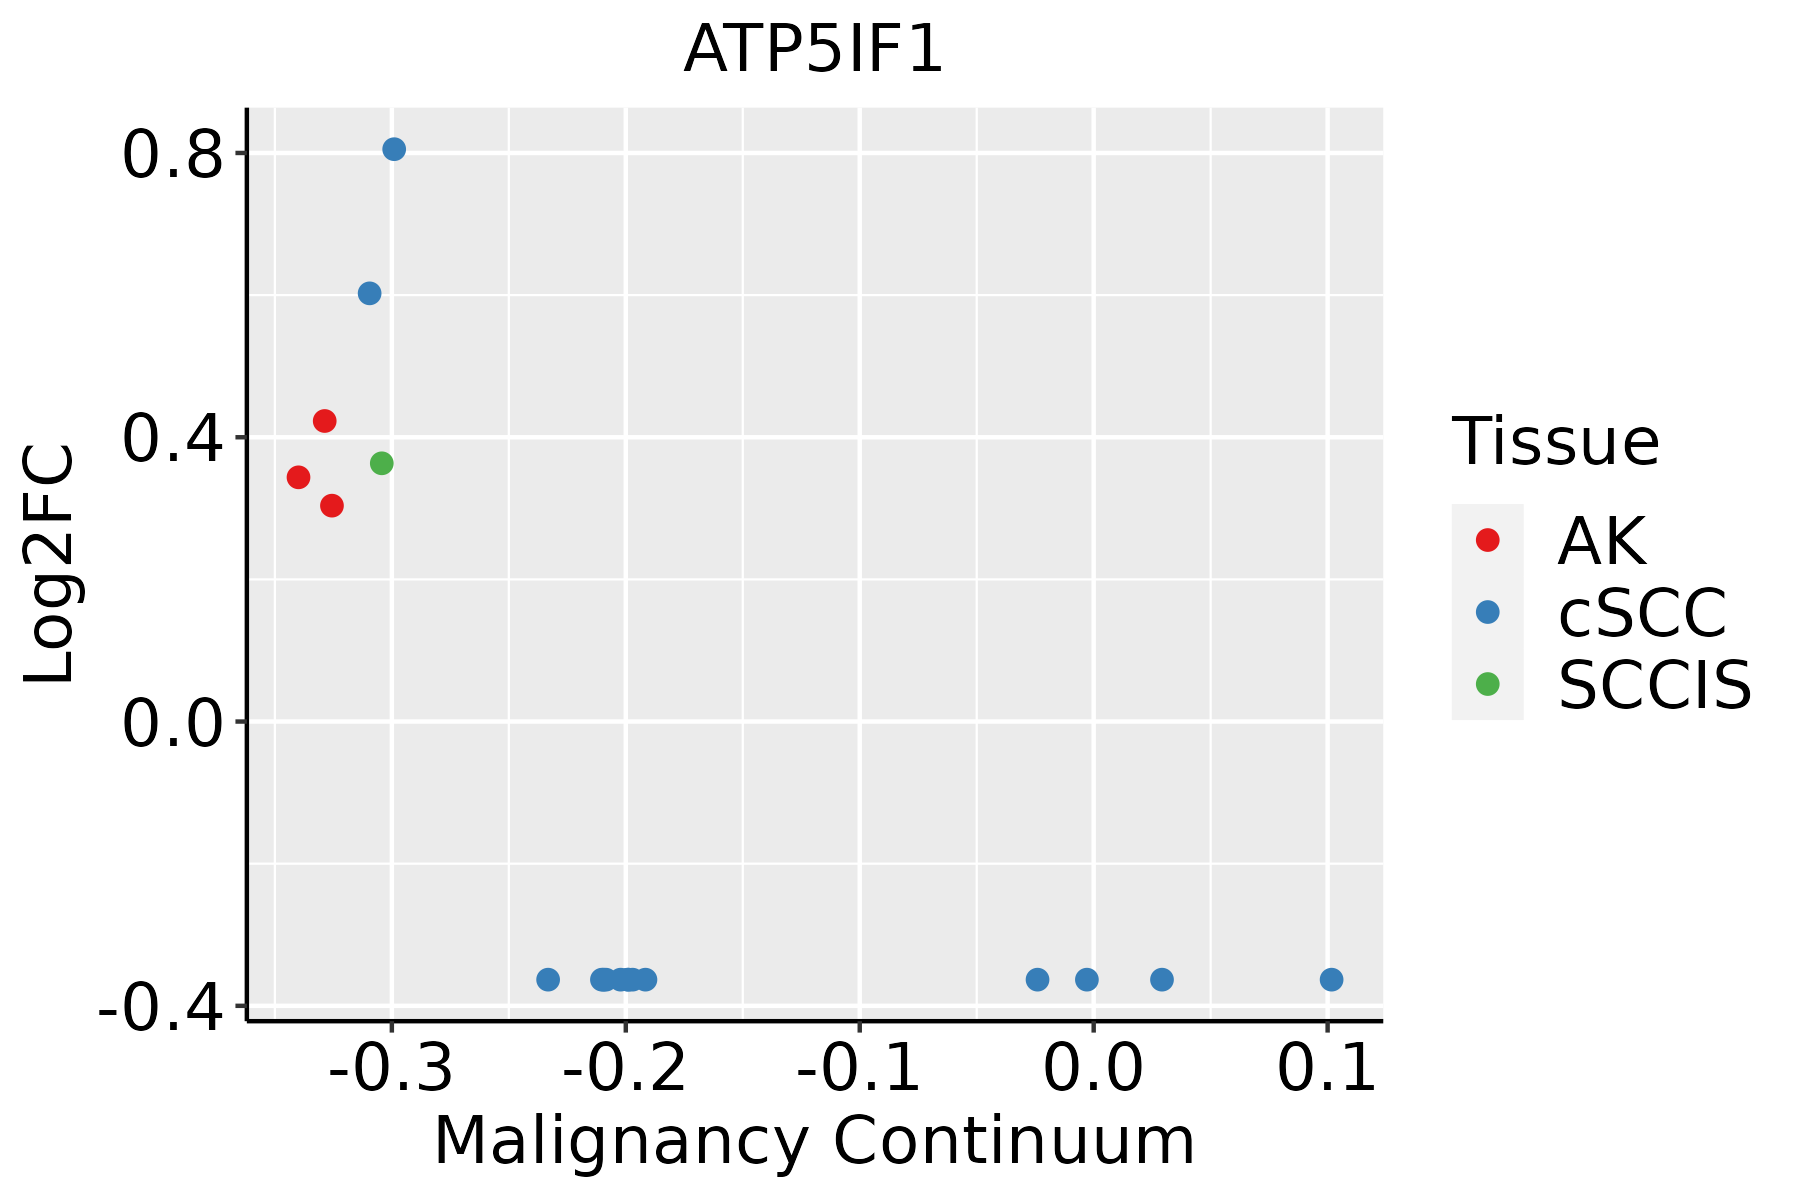 | AK: Actinic keratosis |
| cSCC: Cutaneous squamous cell carcinoma |
| SCCIS:squamous cell carcinoma in situ |
| Thyroid | 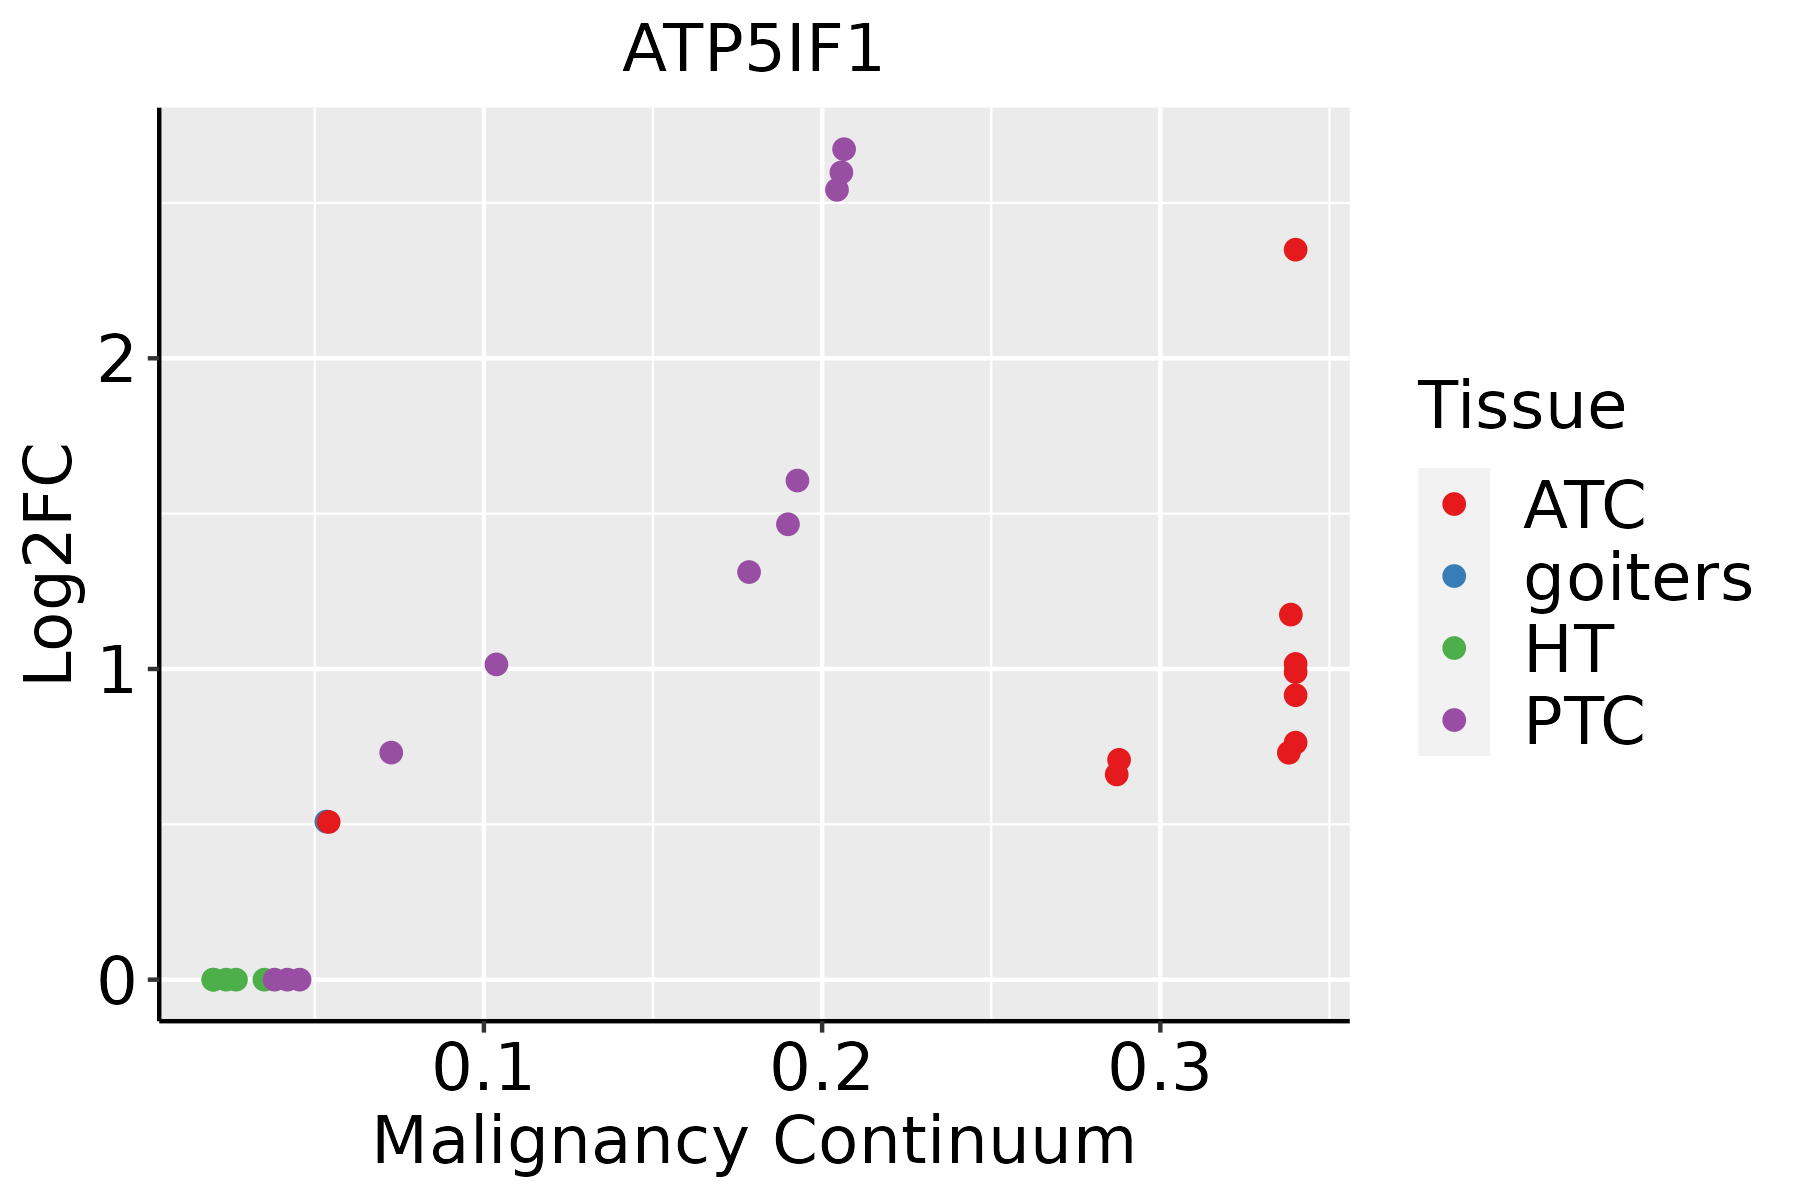 | ATC: Anaplastic thyroid cancer |
| HT: Hashimoto's thyroiditis |
| PTC: Papillary thyroid cancer |
| GO ID | Tissue | Disease Stage | Description | Gene Ratio | Bg Ratio | pvalue | p.adjust | Count |
| GO:00460349 | Breast | Precancer | ATP metabolic process | 82/1080 | 277/18723 | 1.94e-36 | 5.19e-33 | 82 |
| GO:00060918 | Breast | Precancer | generation of precursor metabolites and energy | 94/1080 | 490/18723 | 1.54e-25 | 1.64e-22 | 94 |
| GO:00068398 | Breast | Precancer | mitochondrial transport | 45/1080 | 254/18723 | 1.37e-11 | 1.88e-09 | 45 |
| GO:00458629 | Breast | Precancer | positive regulation of proteolysis | 51/1080 | 372/18723 | 7.77e-09 | 5.70e-07 | 51 |
| GO:00086378 | Breast | Precancer | apoptotic mitochondrial changes | 23/1080 | 107/18723 | 3.44e-08 | 2.12e-06 | 23 |
| GO:00513468 | Breast | Precancer | negative regulation of hydrolase activity | 50/1080 | 379/18723 | 3.85e-08 | 2.34e-06 | 50 |
| GO:00518816 | Breast | Precancer | regulation of mitochondrial membrane potential | 18/1080 | 74/18723 | 1.45e-07 | 7.82e-06 | 18 |
| GO:00022629 | Breast | Precancer | myeloid cell homeostasis | 27/1080 | 157/18723 | 3.10e-07 | 1.49e-05 | 27 |
| GO:19033629 | Breast | Precancer | regulation of cellular protein catabolic process | 36/1080 | 255/18723 | 6.03e-07 | 2.55e-05 | 36 |
| GO:00341019 | Breast | Precancer | erythrocyte homeostasis | 23/1080 | 129/18723 | 1.20e-06 | 4.60e-05 | 23 |
| GO:00421769 | Breast | Precancer | regulation of protein catabolic process | 47/1080 | 391/18723 | 1.50e-06 | 5.58e-05 | 47 |
| GO:00300999 | Breast | Precancer | myeloid cell differentiation | 45/1080 | 381/18723 | 4.00e-06 | 1.25e-04 | 45 |
| GO:19030509 | Breast | Precancer | regulation of proteolysis involved in cellular protein catabolic process | 31/1080 | 221/18723 | 4.10e-06 | 1.27e-04 | 31 |
| GO:00705858 | Breast | Precancer | protein localization to mitochondrion | 21/1080 | 125/18723 | 9.07e-06 | 2.42e-04 | 21 |
| GO:00070066 | Breast | Precancer | mitochondrial membrane organization | 20/1080 | 116/18723 | 9.88e-06 | 2.61e-04 | 20 |
| GO:00726558 | Breast | Precancer | establishment of protein localization to mitochondrion | 20/1080 | 120/18723 | 1.66e-05 | 4.03e-04 | 20 |
| GO:00905595 | Breast | Precancer | regulation of membrane permeability | 15/1080 | 78/18723 | 3.35e-05 | 7.29e-04 | 15 |
| GO:00725938 | Breast | Precancer | reactive oxygen species metabolic process | 30/1080 | 239/18723 | 5.13e-05 | 1.07e-03 | 30 |
| GO:00469025 | Breast | Precancer | regulation of mitochondrial membrane permeability | 13/1080 | 63/18723 | 5.13e-05 | 1.07e-03 | 13 |
| GO:00506736 | Breast | Precancer | epithelial cell proliferation | 46/1080 | 437/18723 | 6.02e-05 | 1.23e-03 | 46 |


