
|
|||||
|
 | |
| |
| |
| |
| |
| |
|
Gene: AP2M1 |
Gene summary for AP2M1 |
| Gene information | Species | Human | Gene symbol | AP2M1 | Gene ID | 1173 |
| Gene name | adaptor related protein complex 2 subunit mu 1 | |
| Gene Alias | AP50 | |
| Cytomap | 3q27.1 | |
| Gene Type | protein-coding | GO ID | GO:0002090 | UniProtAcc | Q96CW1 |
Top |
Malignant transformation analysis |
| Identification of the aberrant gene expression in precancerous and cancerous lesions by comparing the gene expression of stem-like cells in diseased tissues with normal stem cells |
| Entrez ID | Symbol | Replicates | Species | Organ | Tissue | Adj P-value | Log2FC | Malignancy |
| 1173 | AP2M1 | S43 | Human | Liver | Cirrhotic | 1.59e-10 | -3.15e-01 | -0.0187 |
| 1173 | AP2M1 | HCC1_Meng | Human | Liver | HCC | 6.80e-78 | 2.99e-01 | 0.0246 |
| 1173 | AP2M1 | HCC2_Meng | Human | Liver | HCC | 8.23e-43 | 2.16e-01 | 0.0107 |
| 1173 | AP2M1 | cirrhotic1 | Human | Liver | Cirrhotic | 2.88e-19 | 2.72e-01 | 0.0202 |
| 1173 | AP2M1 | cirrhotic2 | Human | Liver | Cirrhotic | 1.25e-21 | 3.19e-01 | 0.0201 |
| 1173 | AP2M1 | cirrhotic3 | Human | Liver | Cirrhotic | 8.75e-15 | 1.63e-01 | 0.0215 |
| 1173 | AP2M1 | HCC1 | Human | Liver | HCC | 1.48e-07 | 4.96e+00 | 0.5336 |
| 1173 | AP2M1 | HCC2 | Human | Liver | HCC | 3.07e-26 | 5.13e+00 | 0.5341 |
| 1173 | AP2M1 | Pt13.a | Human | Liver | HCC | 1.27e-04 | 2.62e-01 | 0.021 |
| 1173 | AP2M1 | Pt13.b | Human | Liver | HCC | 3.93e-33 | 4.90e-01 | 0.0251 |
| 1173 | AP2M1 | Pt14.a | Human | Liver | HCC | 1.82e-03 | 2.11e-01 | 0.0169 |
| 1173 | AP2M1 | Pt14.b | Human | Liver | HCC | 1.01e-11 | 4.58e-01 | 0.018 |
| 1173 | AP2M1 | S014 | Human | Liver | HCC | 3.21e-44 | 2.06e+00 | 0.2254 |
| 1173 | AP2M1 | S015 | Human | Liver | HCC | 3.02e-32 | 2.46e+00 | 0.2375 |
| 1173 | AP2M1 | S016 | Human | Liver | HCC | 3.09e-47 | 2.19e+00 | 0.2243 |
| 1173 | AP2M1 | S027 | Human | Liver | HCC | 1.67e-14 | 1.72e+00 | 0.2446 |
| 1173 | AP2M1 | S028 | Human | Liver | HCC | 2.96e-26 | 1.86e+00 | 0.2503 |
| 1173 | AP2M1 | S029 | Human | Liver | HCC | 1.23e-29 | 2.09e+00 | 0.2581 |
| 1173 | AP2M1 | C04 | Human | Oral cavity | OSCC | 5.42e-45 | 3.14e+00 | 0.2633 |
| 1173 | AP2M1 | C21 | Human | Oral cavity | OSCC | 1.39e-76 | 3.70e+00 | 0.2678 |
| Page: 1 2 3 4 5 6 7 8 9 10 11 12 |
| Tissue | Expression Dynamics | Abbreviation |
| Breast |  | IDC: Invasive ductal carcinoma |
| DCIS: Ductal carcinoma in situ | ||
| Precancer(BRCA1-mut): Precancerous lesion from BRCA1 mutation carriers | ||
| Cervix | 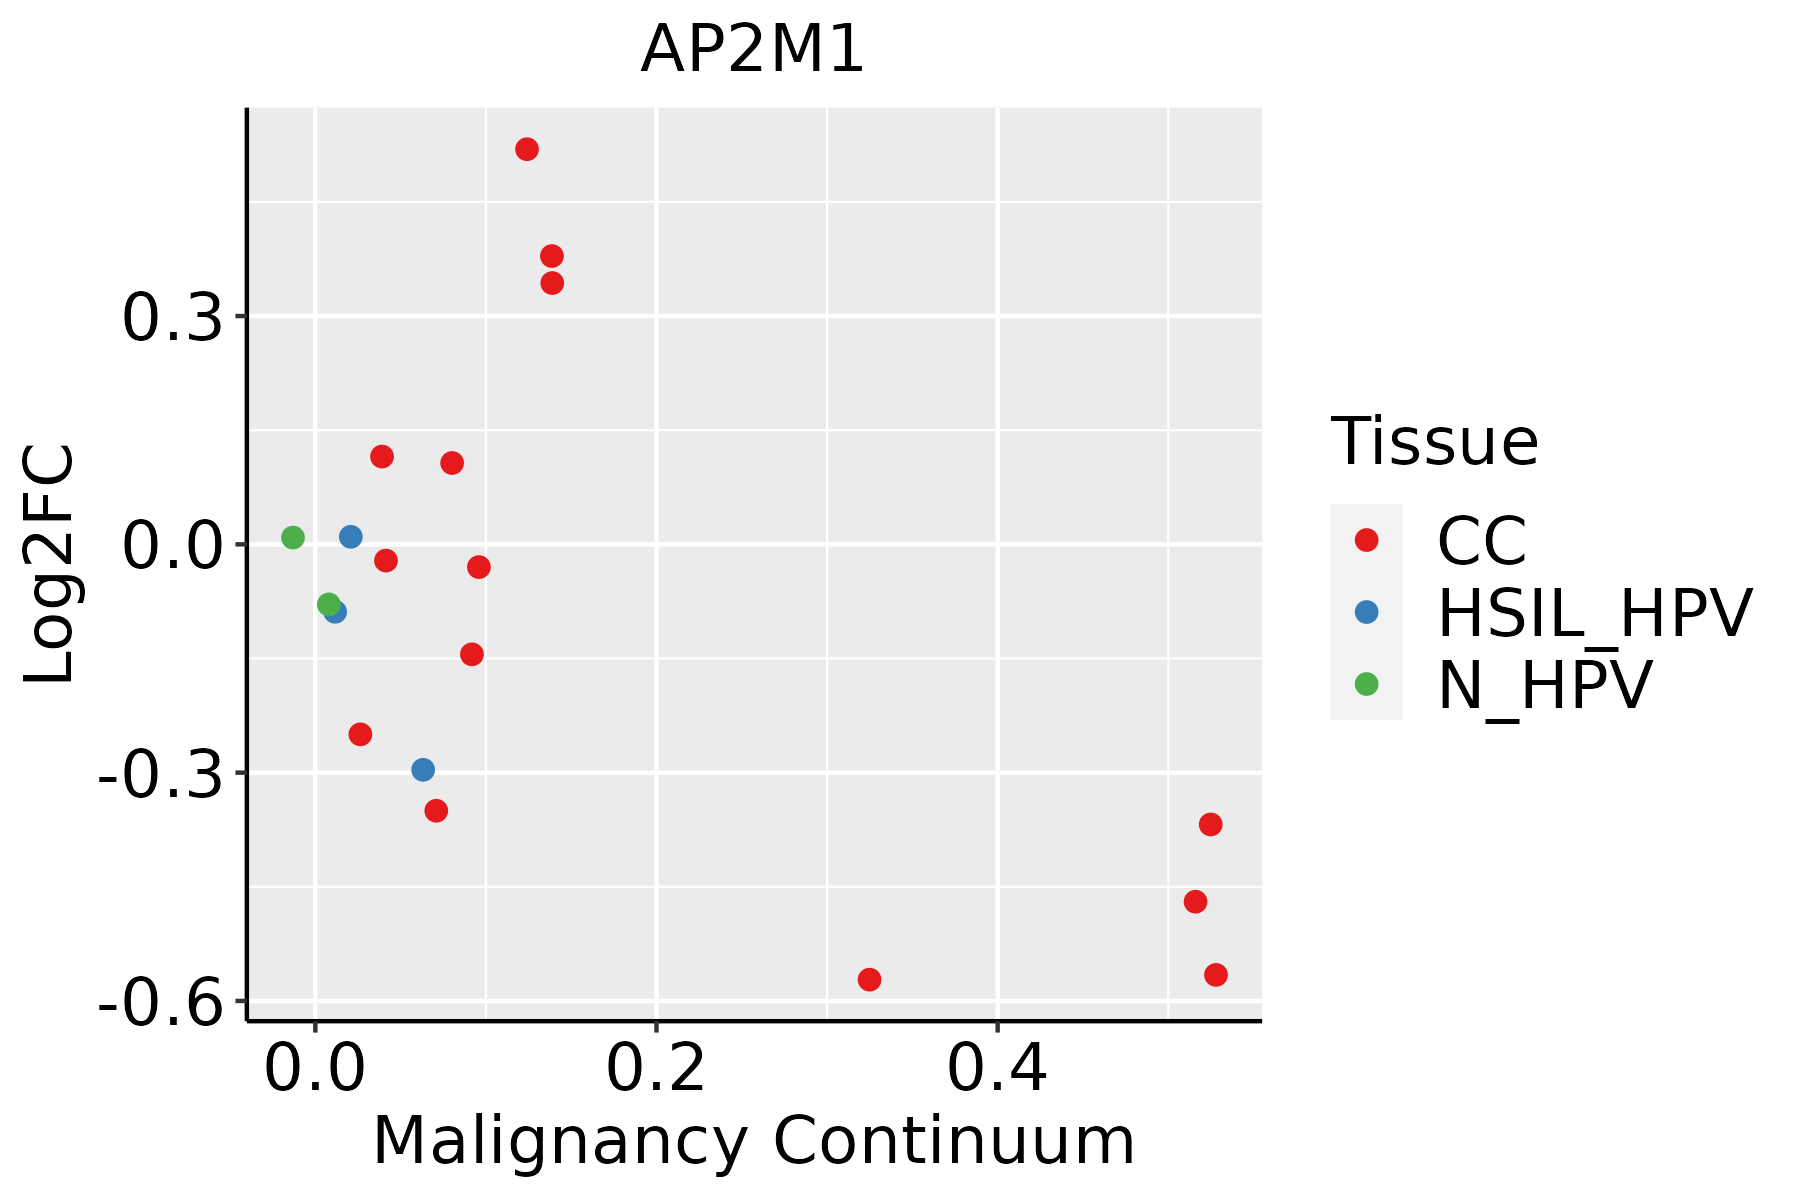 | CC: Cervix cancer |
| HSIL_HPV: HPV-infected high-grade squamous intraepithelial lesions | ||
| N_HPV: HPV-infected normal cervix | ||
| Colorectum (GSE201348) |  | FAP: Familial adenomatous polyposis |
| CRC: Colorectal cancer | ||
| Colorectum (HTA11) |  | AD: Adenomas |
| SER: Sessile serrated lesions | ||
| MSI-H: Microsatellite-high colorectal cancer | ||
| MSS: Microsatellite stable colorectal cancer | ||
| Endometrium | 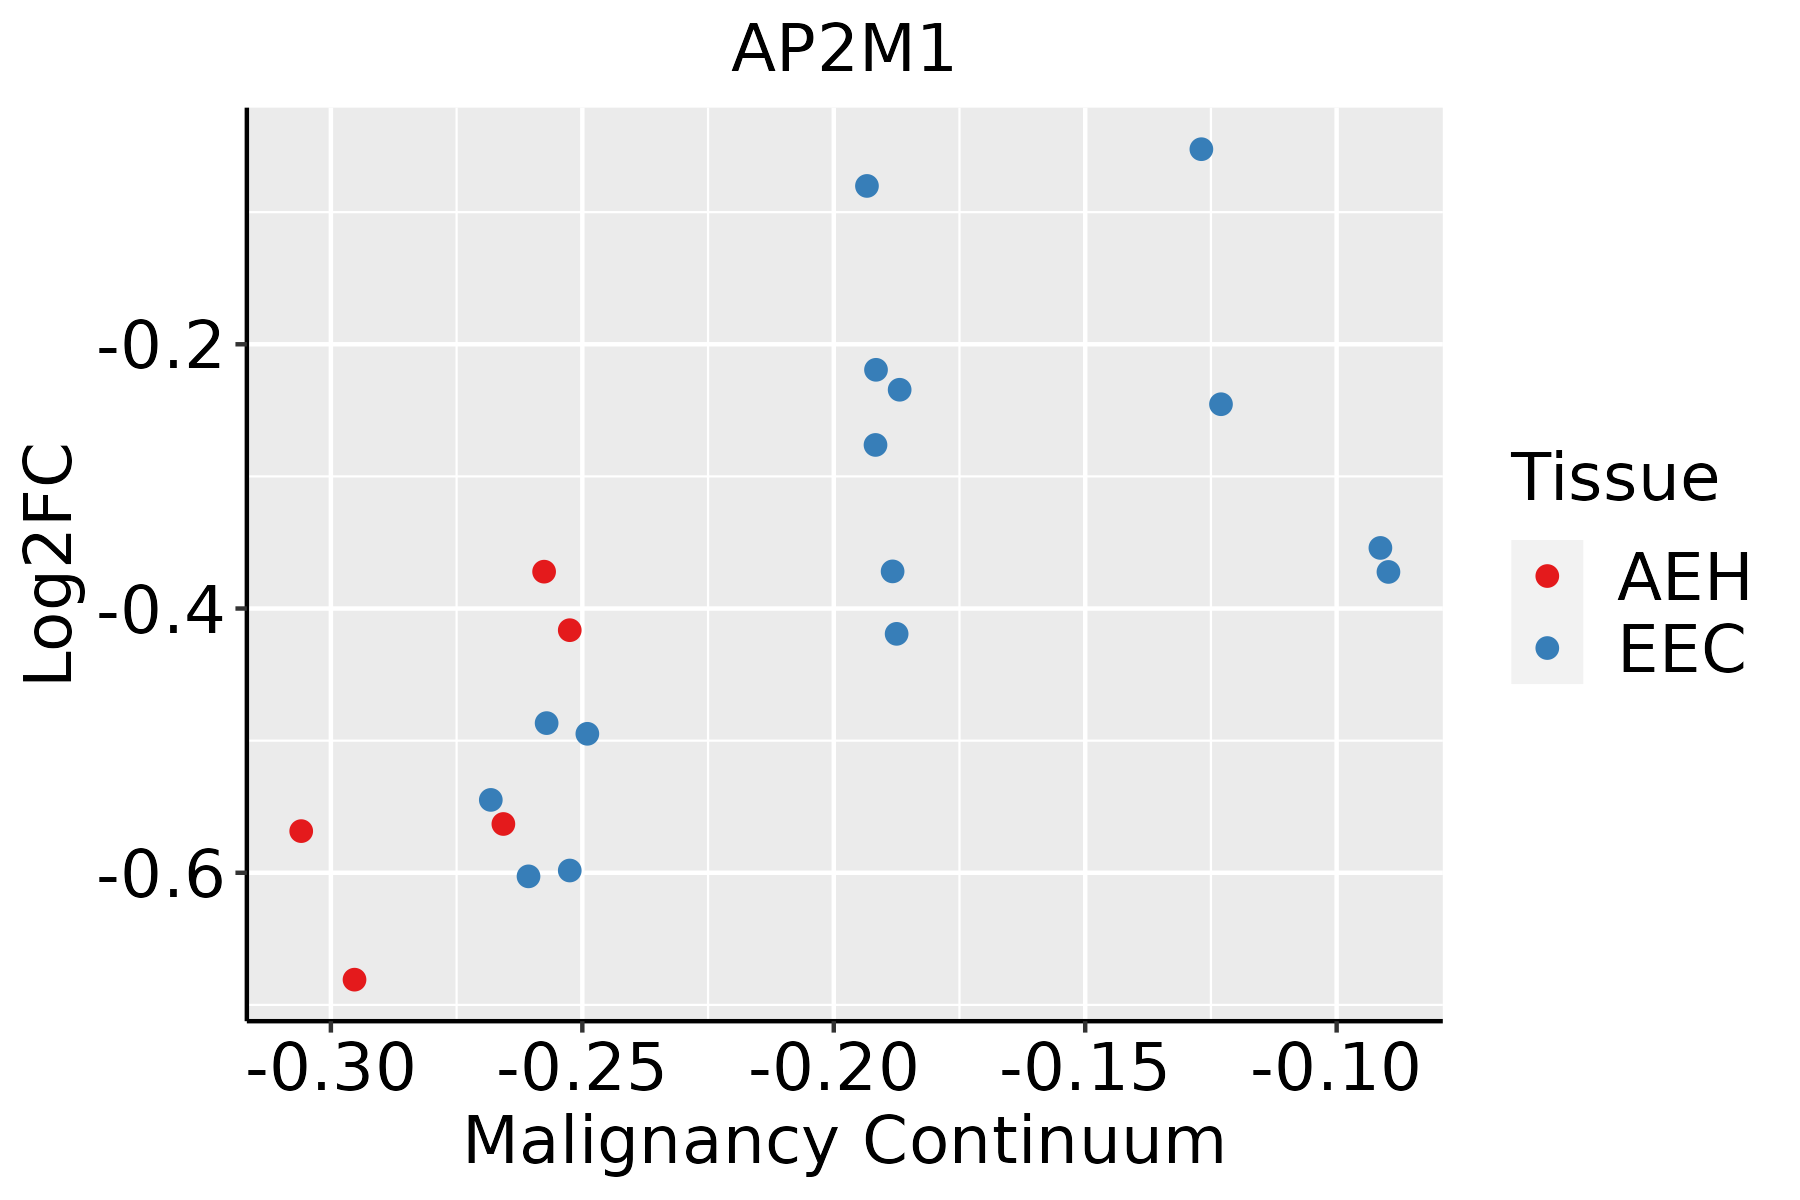 | AEH: Atypical endometrial hyperplasia |
| EEC: Endometrioid Cancer | ||
| Esophagus | 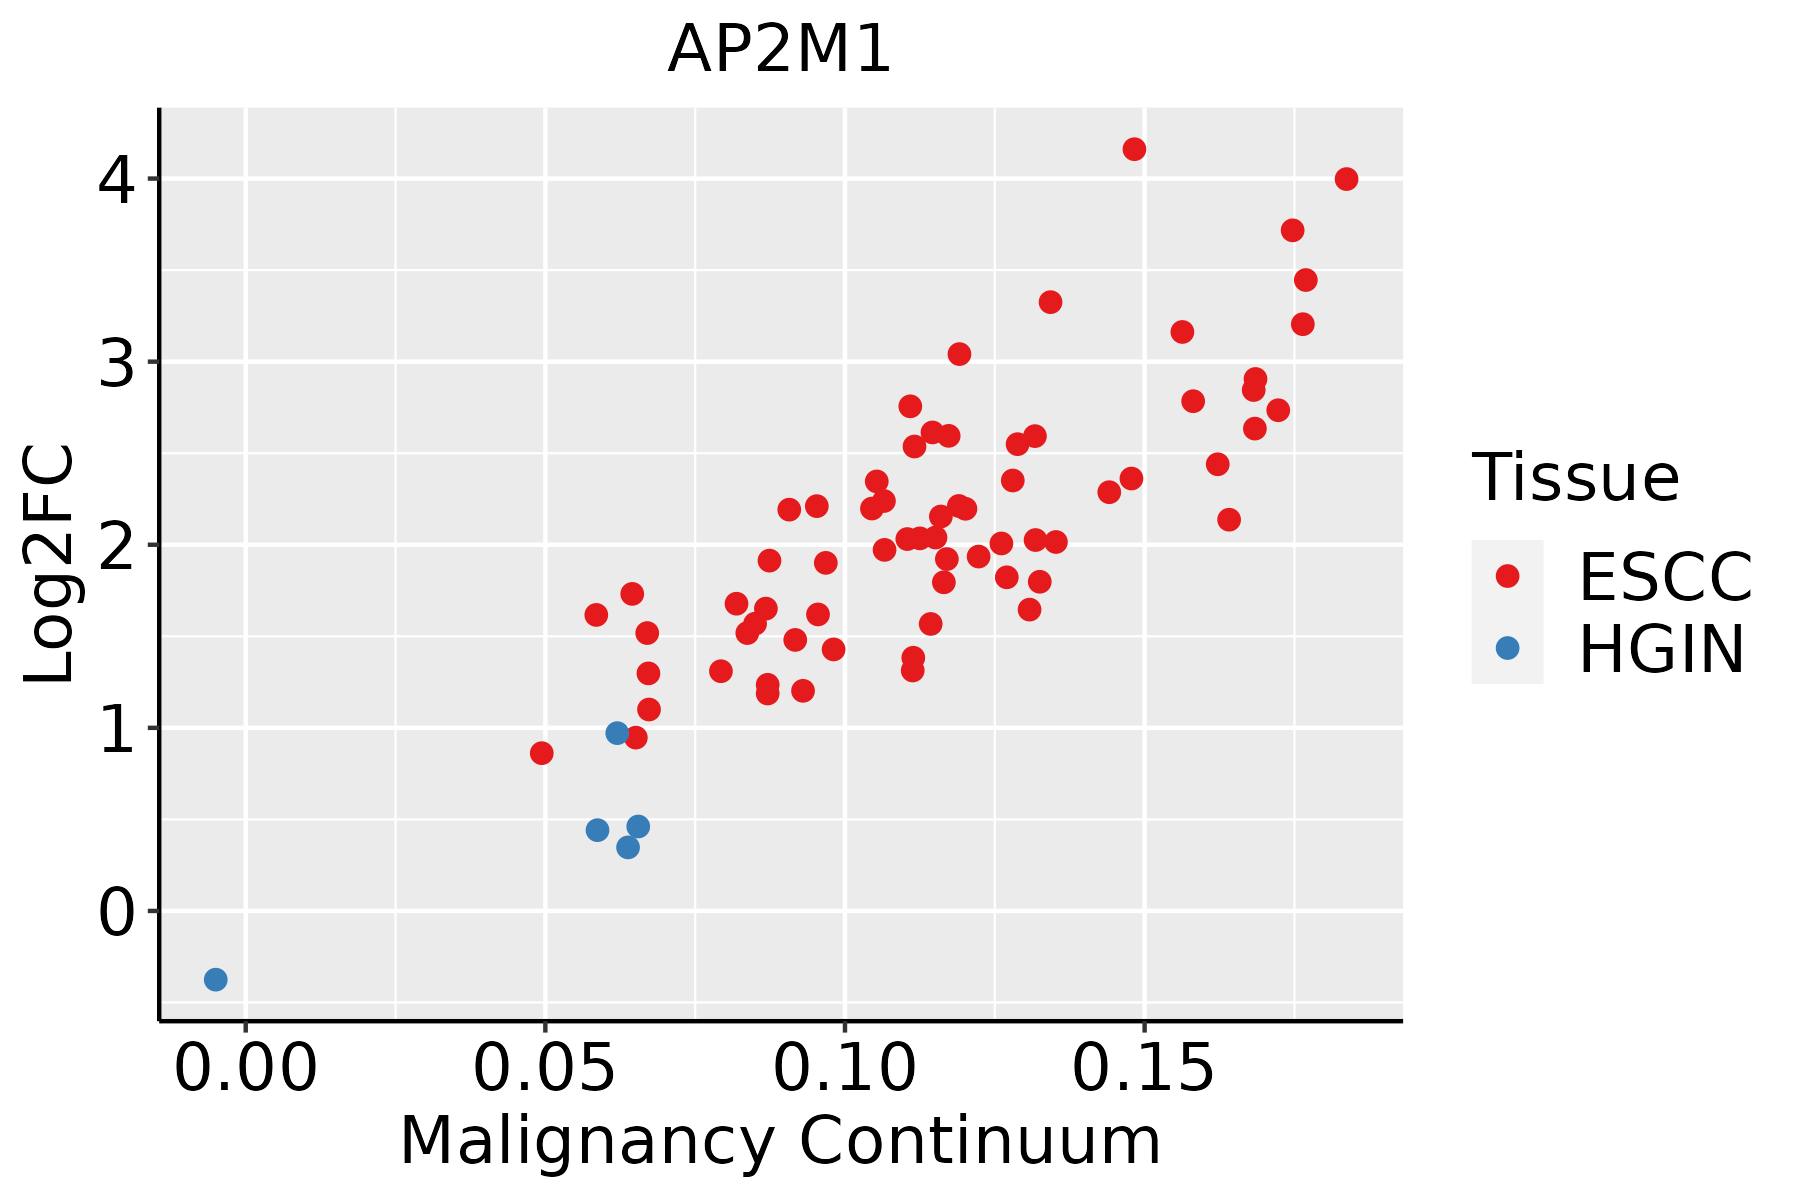 | ESCC: Esophageal squamous cell carcinoma |
| HGIN: High-grade intraepithelial neoplasias | ||
| LGIN: Low-grade intraepithelial neoplasias | ||
| Liver | 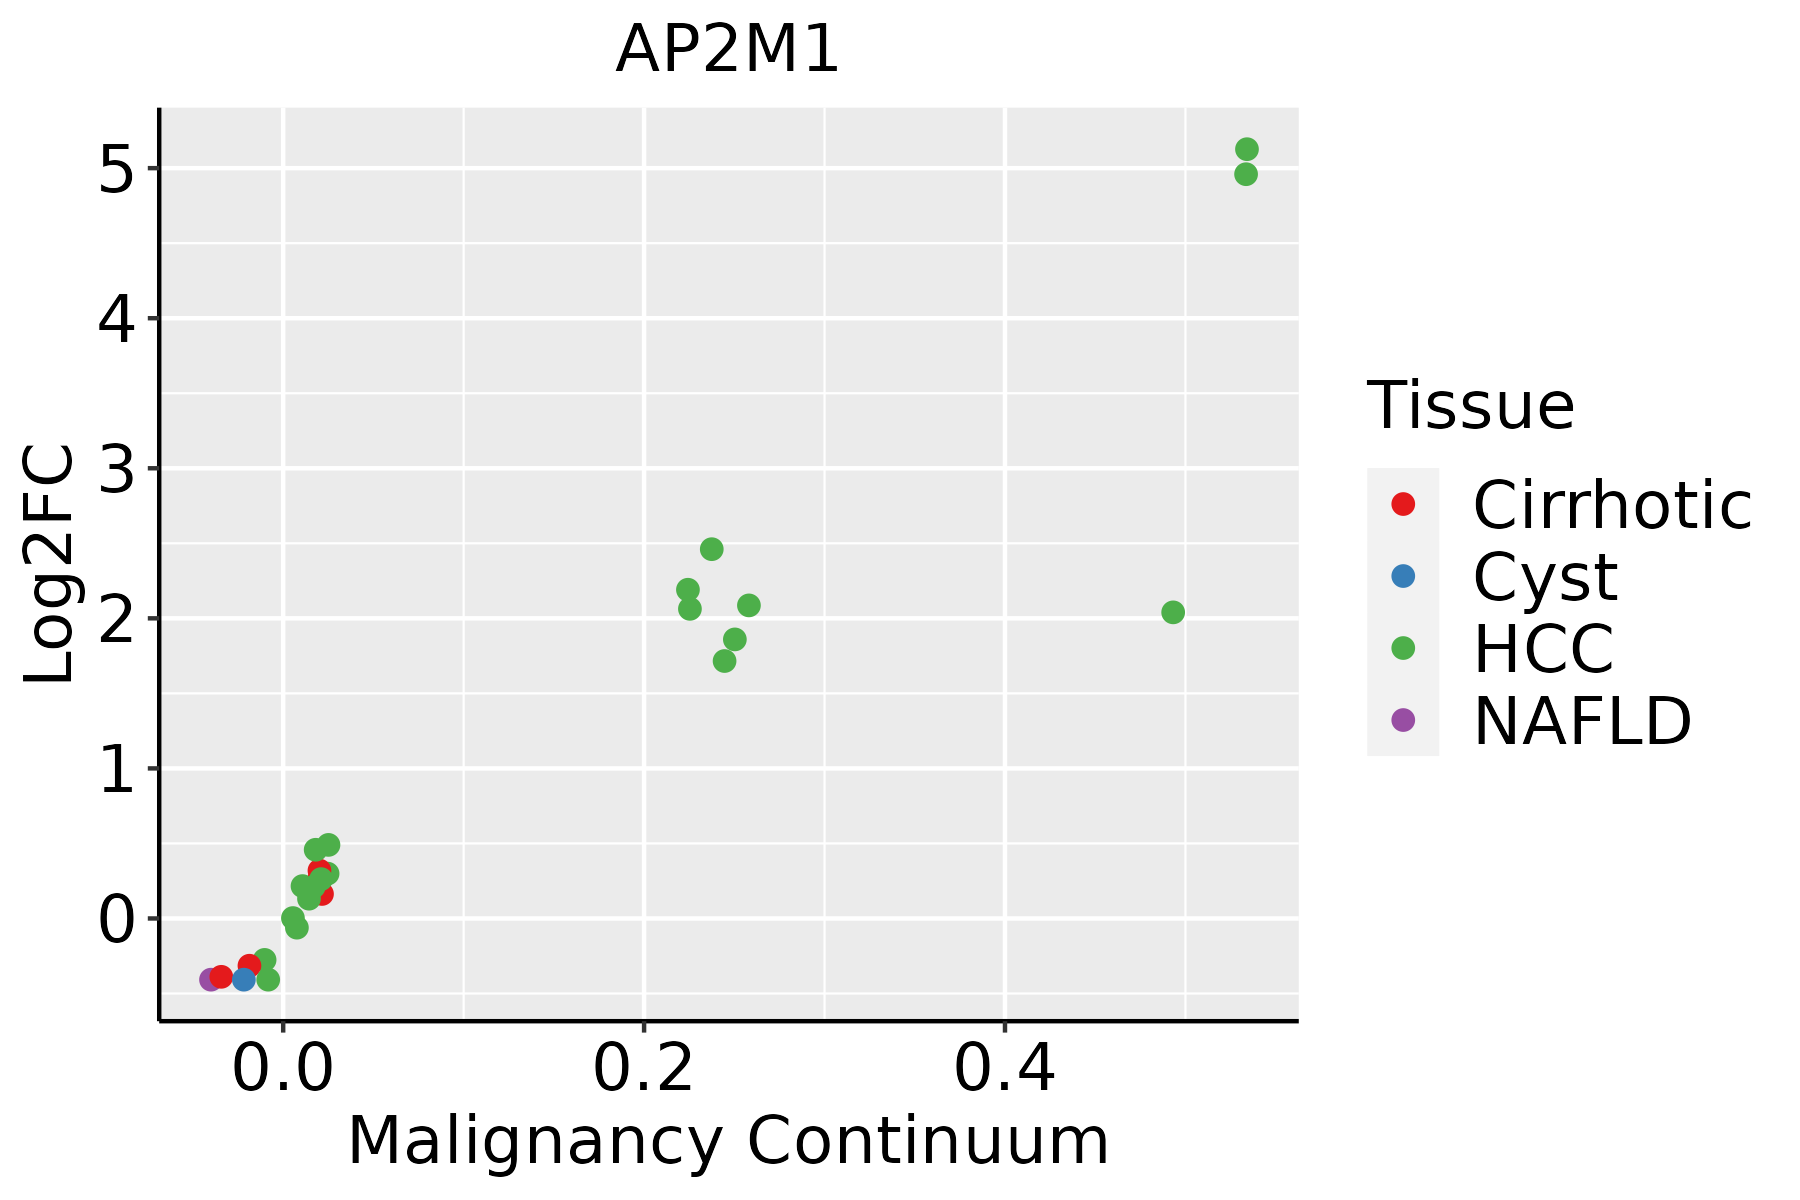 | HCC: Hepatocellular carcinoma |
| NAFLD: Non-alcoholic fatty liver disease | ||
| Oral Cavity |  | EOLP: Erosive Oral lichen planus |
| LP: leukoplakia | ||
| NEOLP: Non-erosive oral lichen planus | ||
| OSCC: Oral squamous cell carcinoma | ||
| Prostate | 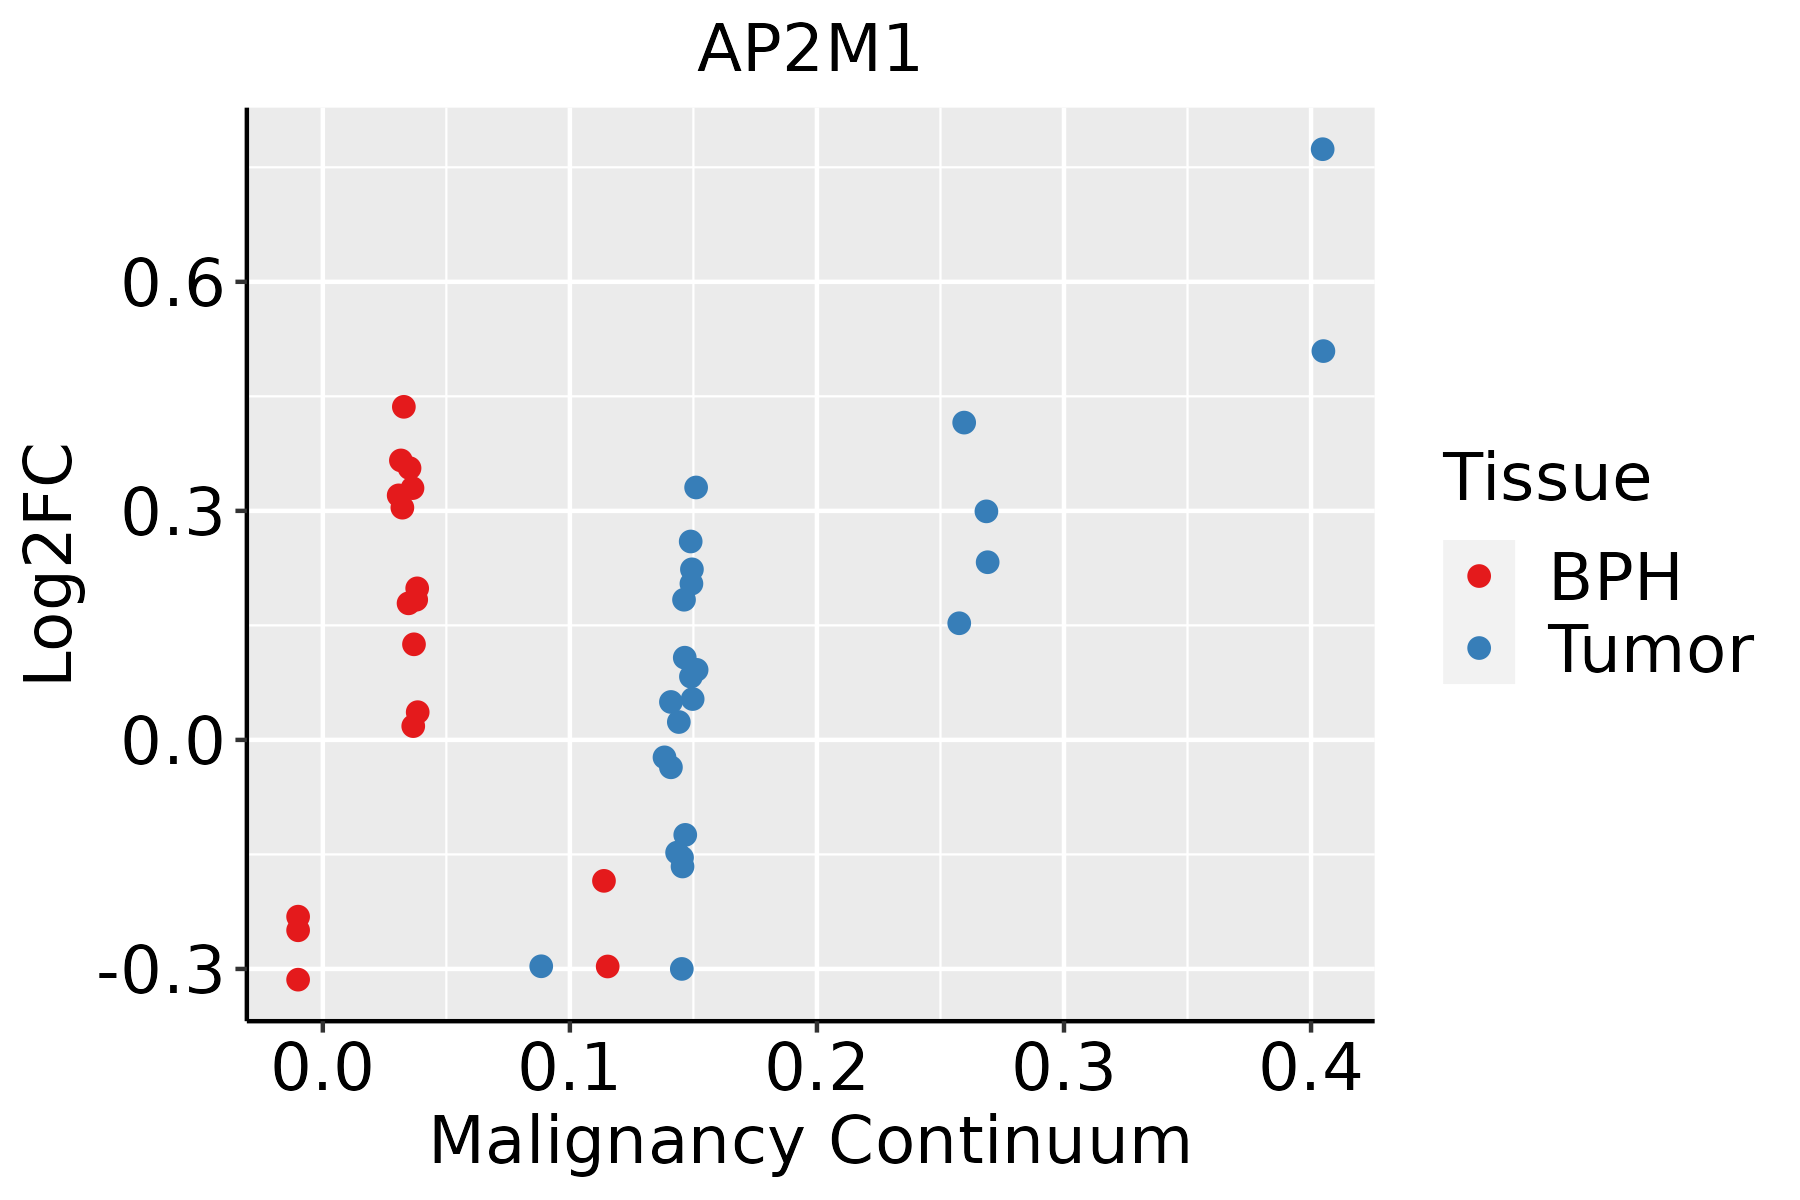 | BPH: Benign Prostatic Hyperplasia |
| Skin |  | AK: Actinic keratosis |
| cSCC: Cutaneous squamous cell carcinoma | ||
| SCCIS:squamous cell carcinoma in situ | ||
| Thyroid |  | ATC: Anaplastic thyroid cancer |
| HT: Hashimoto's thyroiditis | ||
| PTC: Papillary thyroid cancer |
| ∗log2FC in expression of this searched gene in stem-like cells from each diseased tissue sample relative to stem-like cells in normal samples in each tissue plotted against the malignancy continuum. Samples are colored based on if they are from different disease stage. |
Top |
Malignant transformation related pathway analysis |
| Find out the enriched GO biological processes and KEGG pathways involved in transition from healthy to precancer to cancer |
| Tissue | Disease Stage | Enriched GO biological Processes |
| Colorectum | AD |  |
| Colorectum | SER |  |
| Colorectum | MSS |  |
| Colorectum | MSI-H |  |
| Colorectum | FAP |  |
| ∗Top 15 enriched GO BP terms are showed in the bar plot of each disease state in each tissue. Each row represents a significant GO biological process which is colored according to the -log10(p.adjust). |
| Page: 1 2 3 4 5 6 7 8 9 |
| GO ID | Tissue | Disease Stage | Description | Gene Ratio | Bg Ratio | pvalue | p.adjust | Count |
| GO:00069009 | Breast | Precancer | vesicle budding from membrane | 12/1080 | 61/18723 | 1.61e-04 | 2.69e-03 | 12 |
| GO:00068986 | Breast | Precancer | receptor-mediated endocytosis | 27/1080 | 244/18723 | 9.01e-04 | 1.03e-02 | 27 |
| GO:00458076 | Breast | Precancer | positive regulation of endocytosis | 14/1080 | 100/18723 | 1.77e-03 | 1.74e-02 | 14 |
| GO:00316235 | Breast | Precancer | receptor internalization | 15/1080 | 113/18723 | 2.11e-03 | 2.00e-02 | 15 |
| GO:00482606 | Breast | Precancer | positive regulation of receptor-mediated endocytosis | 9/1080 | 52/18723 | 2.67e-03 | 2.36e-02 | 9 |
| GO:19043757 | Breast | Precancer | regulation of protein localization to cell periphery | 15/1080 | 125/18723 | 5.58e-03 | 4.07e-02 | 15 |
| GO:19054757 | Breast | Precancer | regulation of protein localization to membrane | 19/1080 | 175/18723 | 5.98e-03 | 4.22e-02 | 19 |
| GO:19030767 | Breast | Precancer | regulation of protein localization to plasma membrane | 13/1080 | 104/18723 | 6.79e-03 | 4.65e-02 | 13 |
| GO:190547513 | Breast | IDC | regulation of protein localization to membrane | 28/1434 | 175/18723 | 1.56e-04 | 2.71e-03 | 28 |
| GO:000689813 | Breast | IDC | receptor-mediated endocytosis | 35/1434 | 244/18723 | 2.38e-04 | 3.75e-03 | 35 |
| GO:004580713 | Breast | IDC | positive regulation of endocytosis | 18/1434 | 100/18723 | 5.40e-04 | 6.96e-03 | 18 |
| GO:003162311 | Breast | IDC | receptor internalization | 19/1434 | 113/18723 | 9.17e-04 | 1.05e-02 | 19 |
| GO:000690014 | Breast | IDC | vesicle budding from membrane | 12/1434 | 61/18723 | 2.01e-03 | 1.90e-02 | 12 |
| GO:190307613 | Breast | IDC | regulation of protein localization to plasma membrane | 17/1434 | 104/18723 | 2.28e-03 | 2.09e-02 | 17 |
| GO:00325358 | Breast | IDC | regulation of cellular component size | 45/1434 | 383/18723 | 2.72e-03 | 2.41e-02 | 45 |
| GO:190437513 | Breast | IDC | regulation of protein localization to cell periphery | 19/1434 | 125/18723 | 3.06e-03 | 2.60e-02 | 19 |
| GO:00431126 | Breast | IDC | receptor metabolic process | 23/1434 | 166/18723 | 4.04e-03 | 3.25e-02 | 23 |
| GO:004826013 | Breast | IDC | positive regulation of receptor-mediated endocytosis | 10/1434 | 52/18723 | 5.49e-03 | 4.03e-02 | 10 |
| GO:00301007 | Breast | IDC | regulation of endocytosis | 27/1434 | 211/18723 | 5.92e-03 | 4.26e-02 | 27 |
| GO:00726599 | Breast | IDC | protein localization to plasma membrane | 34/1434 | 284/18723 | 6.33e-03 | 4.47e-02 | 34 |
| Page: 1 2 3 4 5 6 7 8 9 10 11 12 13 14 15 16 17 18 |
| Pathway ID | Tissue | Disease Stage | Description | Gene Ratio | Bg Ratio | pvalue | p.adjust | qvalue | Count |
| hsa0501616 | Breast | Precancer | Huntington disease | 98/684 | 306/8465 | 2.85e-35 | 2.25e-33 | 1.72e-33 | 98 |
| hsa0496110 | Breast | Precancer | Endocrine and other factor-regulated calcium reabsorption | 11/684 | 53/8465 | 2.92e-03 | 1.81e-02 | 1.39e-02 | 11 |
| hsa0501617 | Breast | Precancer | Huntington disease | 98/684 | 306/8465 | 2.85e-35 | 2.25e-33 | 1.72e-33 | 98 |
| hsa0496111 | Breast | Precancer | Endocrine and other factor-regulated calcium reabsorption | 11/684 | 53/8465 | 2.92e-03 | 1.81e-02 | 1.39e-02 | 11 |
| hsa0501643 | Breast | DCIS | Huntington disease | 101/846 | 306/8465 | 1.54e-29 | 1.24e-27 | 9.13e-28 | 101 |
| hsa0496141 | Breast | DCIS | Endocrine and other factor-regulated calcium reabsorption | 12/846 | 53/8465 | 5.17e-03 | 2.69e-02 | 1.98e-02 | 12 |
| hsa0414416 | Breast | DCIS | Endocytosis | 37/846 | 251/8465 | 9.92e-03 | 4.40e-02 | 3.24e-02 | 37 |
| hsa0501653 | Breast | DCIS | Huntington disease | 101/846 | 306/8465 | 1.54e-29 | 1.24e-27 | 9.13e-28 | 101 |
| hsa0496151 | Breast | DCIS | Endocrine and other factor-regulated calcium reabsorption | 12/846 | 53/8465 | 5.17e-03 | 2.69e-02 | 1.98e-02 | 12 |
| hsa0414417 | Breast | DCIS | Endocytosis | 37/846 | 251/8465 | 9.92e-03 | 4.40e-02 | 3.24e-02 | 37 |
| hsa0501624 | Cervix | HSIL_HPV | Huntington disease | 38/459 | 306/8465 | 1.21e-06 | 2.54e-05 | 2.05e-05 | 38 |
| hsa0501634 | Cervix | HSIL_HPV | Huntington disease | 38/459 | 306/8465 | 1.21e-06 | 2.54e-05 | 2.05e-05 | 38 |
| hsa05016 | Colorectum | AD | Huntington disease | 147/2092 | 306/8465 | 1.93e-19 | 9.26e-18 | 5.91e-18 | 147 |
| hsa04144 | Colorectum | AD | Endocytosis | 111/2092 | 251/8465 | 5.95e-12 | 1.42e-10 | 9.08e-11 | 111 |
| hsa04961 | Colorectum | AD | Endocrine and other factor-regulated calcium reabsorption | 24/2092 | 53/8465 | 8.49e-04 | 5.93e-03 | 3.78e-03 | 24 |
| hsa050161 | Colorectum | AD | Huntington disease | 147/2092 | 306/8465 | 1.93e-19 | 9.26e-18 | 5.91e-18 | 147 |
| hsa041441 | Colorectum | AD | Endocytosis | 111/2092 | 251/8465 | 5.95e-12 | 1.42e-10 | 9.08e-11 | 111 |
| hsa049611 | Colorectum | AD | Endocrine and other factor-regulated calcium reabsorption | 24/2092 | 53/8465 | 8.49e-04 | 5.93e-03 | 3.78e-03 | 24 |
| hsa050162 | Colorectum | SER | Huntington disease | 127/1580 | 306/8465 | 3.29e-21 | 1.37e-19 | 9.92e-20 | 127 |
| hsa041442 | Colorectum | SER | Endocytosis | 81/1580 | 251/8465 | 1.14e-07 | 2.36e-06 | 1.71e-06 | 81 |
| Page: 1 2 3 4 |
Top |
Cell-cell communication analysis |
| Identification of potential cell-cell interactions between two cell types and their ligand-receptor pairs for different disease states |
| Ligand | Receptor | LRpair | Pathway | Tissue | Disease Stage |
| Page: 1 |
Top |
Single-cell gene regulatory network inference analysis |
| Find out the significant the regulons (TFs) and the target genes of each regulon across cell types for different disease states |
| TF | Cell Type | Tissue | Disease Stage | Target Gene | RSS | Regulon Activity |
| ∗The dot plots of a searched regulon are shown for all cell subpopulations in each disease state of each tissue based on the regulon specific score inferred using pySCENIC and by calculating the average expression. |
| Page: 1 |
Top |
Somatic mutation of malignant transformation related genes |
| Annotation of somatic variants for genes involved in malignant transformation |
| Hugo Symbol | Variant Class | Variant Classification | dbSNP RS | HGVSc | HGVSp | HGVSp Short | SWISSPROT | BIOTYPE | SIFT | PolyPhen | Tumor Sample Barcode | Tissue | Histology | Sex | Age | Stage | Therapy Types | Drugs | Outcome |
| AP2M1 | SNV | Missense_Mutation | novel | c.164N>T | p.Asp55Val | p.D55V | protein_coding | deleterious(0) | possibly_damaging(0.885) | TCGA-BH-A0EE-01 | Breast | breast invasive carcinoma | Female | >=65 | I/II | Chemotherapy | docetaxel | SD | |
| AP2M1 | SNV | Missense_Mutation | c.409N>A | p.Leu137Met | p.L137M | protein_coding | deleterious(0.04) | possibly_damaging(0.607) | TCGA-E2-A14R-01 | Breast | breast invasive carcinoma | Female | <65 | I/II | Chemotherapy | doxorubicin | PD | ||
| AP2M1 | insertion | In_Frame_Ins | novel | c.162_163insCCTCACTTTATTAAGGTTACATCAGCCTTAATA | p.Val54_Asp55insProHisPheIleLysValThrSerAlaLeuIle | p.V54_D55insPHFIKVTSALI | protein_coding | TCGA-BH-A0EE-01 | Breast | breast invasive carcinoma | Female | >=65 | I/II | Chemotherapy | docetaxel | SD | |||
| AP2M1 | SNV | Missense_Mutation | novel | c.1355G>A | p.Arg452His | p.R452H | protein_coding | deleterious(0) | benign(0.223) | TCGA-2W-A8YY-01 | Cervix | cervical & endocervical cancer | Female | <65 | I/II | Chemotherapy | cisplatin | CR | |
| AP2M1 | SNV | Missense_Mutation | novel | c.986N>T | p.Lys329Met | p.K329M | protein_coding | deleterious(0.02) | probably_damaging(0.971) | TCGA-C5-A2LZ-01 | Cervix | cervical & endocervical cancer | Female | >=65 | III/IV | Unknown | Unknown | PD | |
| AP2M1 | SNV | Missense_Mutation | c.457G>A | p.Ala153Thr | p.A153T | protein_coding | tolerated(0.76) | benign(0) | TCGA-VS-A8QA-01 | Cervix | cervical & endocervical cancer | Female | <65 | I/II | Unknown | Unknown | SD | ||
| AP2M1 | SNV | Missense_Mutation | c.902G>A | p.Arg301Lys | p.R301K | protein_coding | tolerated(0.54) | benign(0.014) | TCGA-AA-3672-01 | Colorectum | colon adenocarcinoma | Female | >=65 | III/IV | Unknown | Unknown | SD | ||
| AP2M1 | SNV | Missense_Mutation | c.908N>A | p.Arg303His | p.R303H | protein_coding | deleterious(0.02) | possibly_damaging(0.545) | TCGA-AA-3715-01 | Colorectum | colon adenocarcinoma | Male | >=65 | I/II | Unknown | Unknown | PD | ||
| AP2M1 | SNV | Missense_Mutation | novel | c.625N>T | p.Leu209Phe | p.L209F | protein_coding | deleterious(0) | probably_damaging(0.999) | TCGA-AA-3877-01 | Colorectum | colon adenocarcinoma | Female | >=65 | I/II | Unknown | Unknown | SD | |
| AP2M1 | SNV | Missense_Mutation | c.431N>A | p.Gly144Asp | p.G144D | protein_coding | deleterious(0) | probably_damaging(1) | TCGA-AA-A01R-01 | Colorectum | colon adenocarcinoma | Male | <65 | III/IV | Chemotherapy | 5-fluorouracil | PD |
| Page: 1 2 3 4 5 |
Top |
Related drugs of malignant transformation related genes |
| Identification of chemicals and drugs interact with genes involved in malignant transfromation |
| (DGIdb 4.0) |
| Entrez ID | Symbol | Category | Interaction Types | Drug Claim Name | Drug Name | PMIDs |
| Page: 1 |

Copyright 2023-Present -The University of Texas Health Science Center at Houston |