
|
|||||
|
 | |
| |
| |
| |
| |
| |
|
Gene: ABLIM1 |
Gene summary for ABLIM1 |
| Gene information | Species | Human | Gene symbol | ABLIM1 | Gene ID | 3983 |
| Gene name | actin binding LIM protein 1 | |
| Gene Alias | ABLIM | |
| Cytomap | 10q25.3 | |
| Gene Type | protein-coding | GO ID | GO:0003008 | UniProtAcc | O14639 |
Top |
Malignant transformation analysis |
| Identification of the aberrant gene expression in precancerous and cancerous lesions by comparing the gene expression of stem-like cells in diseased tissues with normal stem cells |
| Entrez ID | Symbol | Replicates | Species | Organ | Tissue | Adj P-value | Log2FC | Malignancy |
| 3983 | ABLIM1 | GSM5353227_PA_PR5199-193K_Pool_1_2_3_S55_L002 | Human | Prostate | Tumor | 6.78e-05 | 4.35e-01 | 0.1602 |
| 3983 | ABLIM1 | GSM5353236_PA_PR5251_T1_S7_L001 | Human | Prostate | Tumor | 1.61e-07 | 7.08e-01 | 0.1608 |
| 3983 | ABLIM1 | GSM5353237_PA_PR5251_T2_S8_L001 | Human | Prostate | Tumor | 1.09e-02 | 5.99e-01 | 0.1622 |
| 3983 | ABLIM1 | GSM5353240_PA_PR5254_T1_S15_L001 | Human | Prostate | Tumor | 2.10e-06 | 4.31e-01 | 0.1575 |
| 3983 | ABLIM1 | GSM5353243_PA_PR5261_T1_S23_L002 | Human | Prostate | Tumor | 4.30e-07 | 3.26e-01 | 0.1545 |
| 3983 | ABLIM1 | GSM5353244_PA_PR5261_T2_S24_L002 | Human | Prostate | Tumor | 2.43e-04 | 3.05e-01 | 0.1569 |
| 3983 | ABLIM1 | GSM5353247_PA_PR5269_3_S27_L002 | Human | Prostate | Tumor | 2.58e-03 | 3.69e-01 | 0.1532 |
| 3983 | ABLIM1 | P1_S1_AK | Human | Skin | AK | 9.08e-18 | 6.18e-01 | -0.3399 |
| 3983 | ABLIM1 | P2_S3_AK | Human | Skin | AK | 2.27e-13 | 6.17e-01 | -0.3287 |
| 3983 | ABLIM1 | P2_S4_SCCIS | Human | Skin | SCCIS | 5.90e-10 | 5.01e-01 | -0.3043 |
| 3983 | ABLIM1 | P3_S6_AK | Human | Skin | AK | 1.41e-12 | 5.37e-01 | -0.3256 |
| 3983 | ABLIM1 | P4_S8_cSCC | Human | Skin | cSCC | 8.73e-22 | 5.91e-01 | -0.3095 |
| 3983 | ABLIM1 | P1_cSCC | Human | Skin | cSCC | 3.92e-10 | 5.93e-01 | 0.0292 |
| 3983 | ABLIM1 | P2_cSCC | Human | Skin | cSCC | 8.21e-09 | 3.84e-01 | -0.024 |
| 3983 | ABLIM1 | P4_cSCC | Human | Skin | cSCC | 5.70e-10 | 4.59e-01 | -0.00290000000000005 |
| 3983 | ABLIM1 | P10_cSCC | Human | Skin | cSCC | 2.40e-31 | 1.05e+00 | 0.1017 |
| 3983 | ABLIM1 | Pat01-B | Human | Stomach | GC | 1.08e-21 | 1.30e-01 | 0.5754 |
| 3983 | ABLIM1 | Pat02-B | Human | Stomach | GC | 9.88e-52 | 3.75e-01 | 0.0368 |
| 3983 | ABLIM1 | Pat03-B | Human | Stomach | GC | 2.30e-29 | 2.43e-01 | 0.3693 |
| 3983 | ABLIM1 | Pat04-B | Human | Stomach | GC | 1.16e-34 | 3.71e-01 | -0.1483 |
| Page: 1 2 3 4 5 6 7 8 9 10 11 |
| Tissue | Expression Dynamics | Abbreviation |
| Cervix | 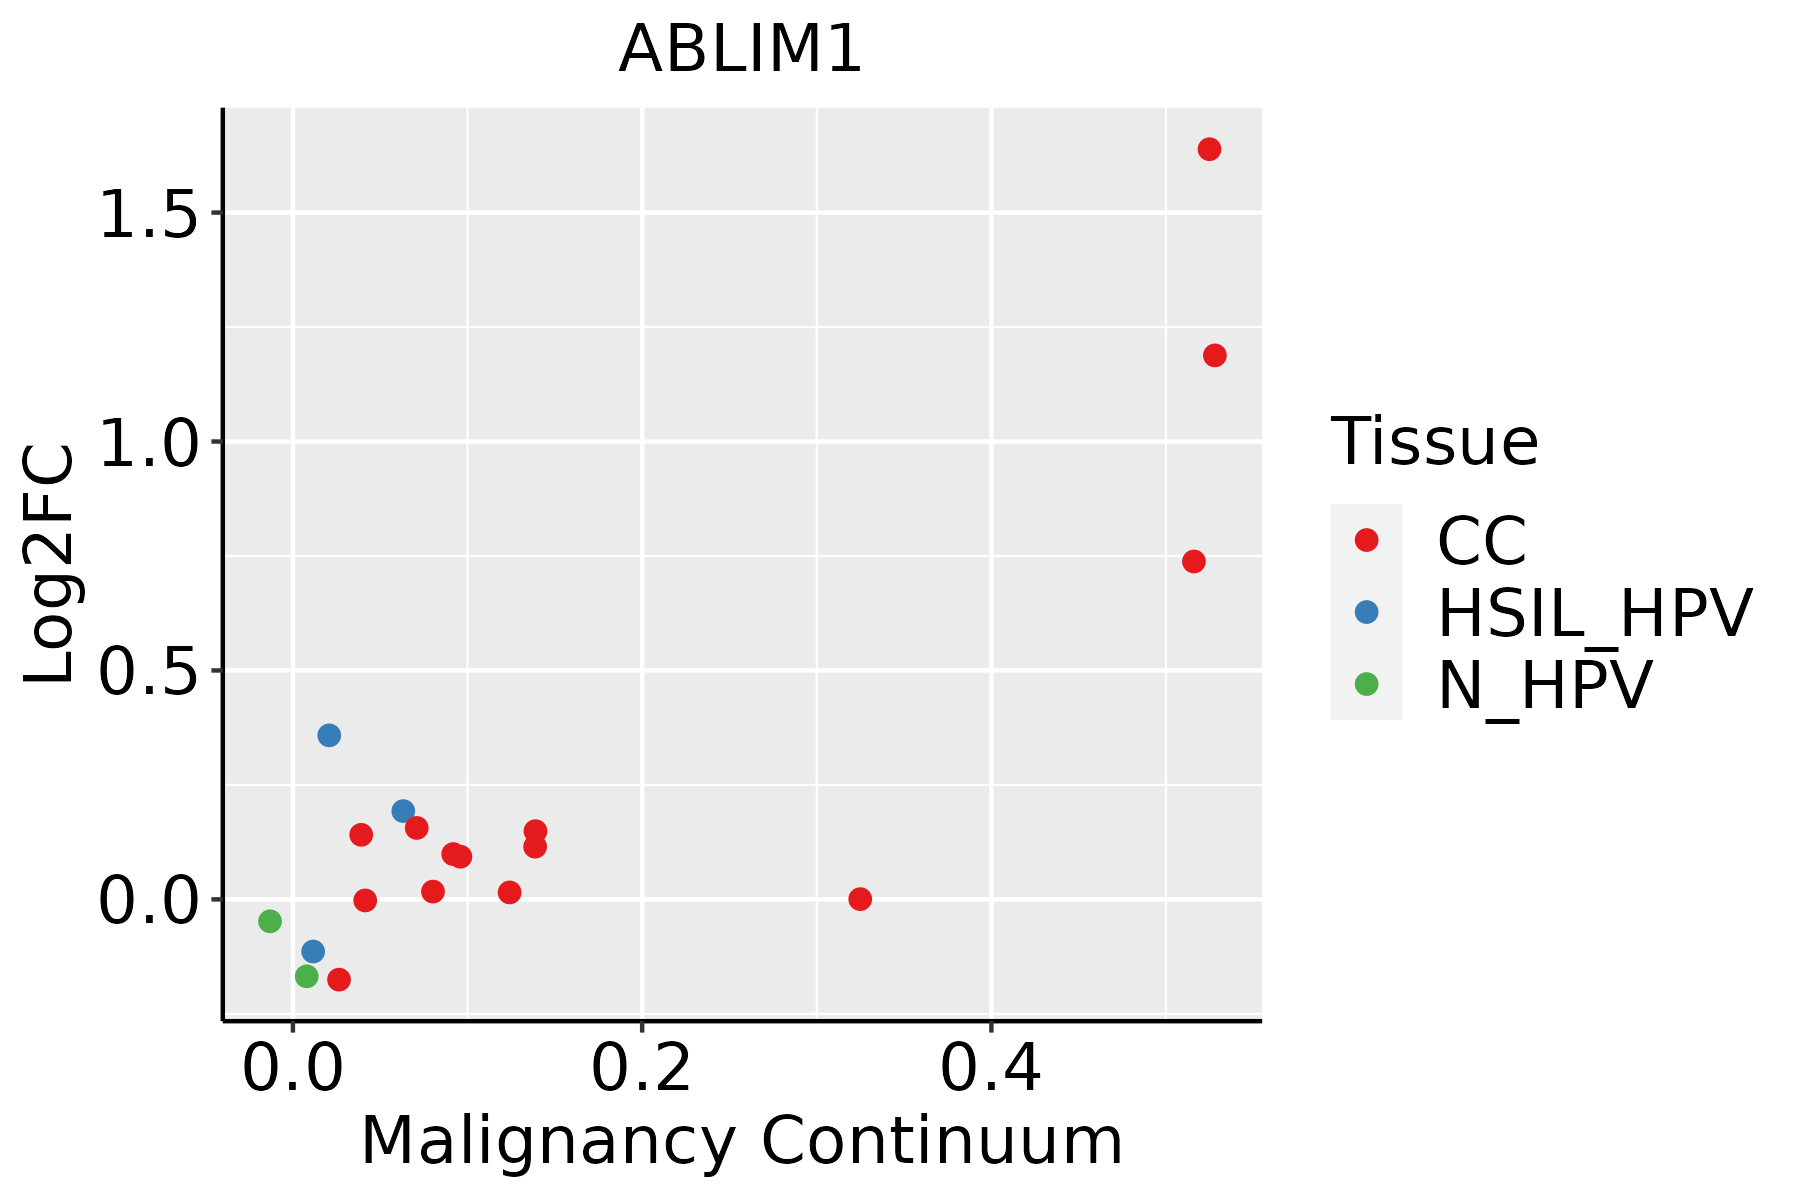 | CC: Cervix cancer |
| HSIL_HPV: HPV-infected high-grade squamous intraepithelial lesions | ||
| N_HPV: HPV-infected normal cervix | ||
| Colorectum (GSE201348) |  | FAP: Familial adenomatous polyposis |
| CRC: Colorectal cancer | ||
| Colorectum (HTA11) |  | AD: Adenomas |
| SER: Sessile serrated lesions | ||
| MSI-H: Microsatellite-high colorectal cancer | ||
| MSS: Microsatellite stable colorectal cancer | ||
| Esophagus | 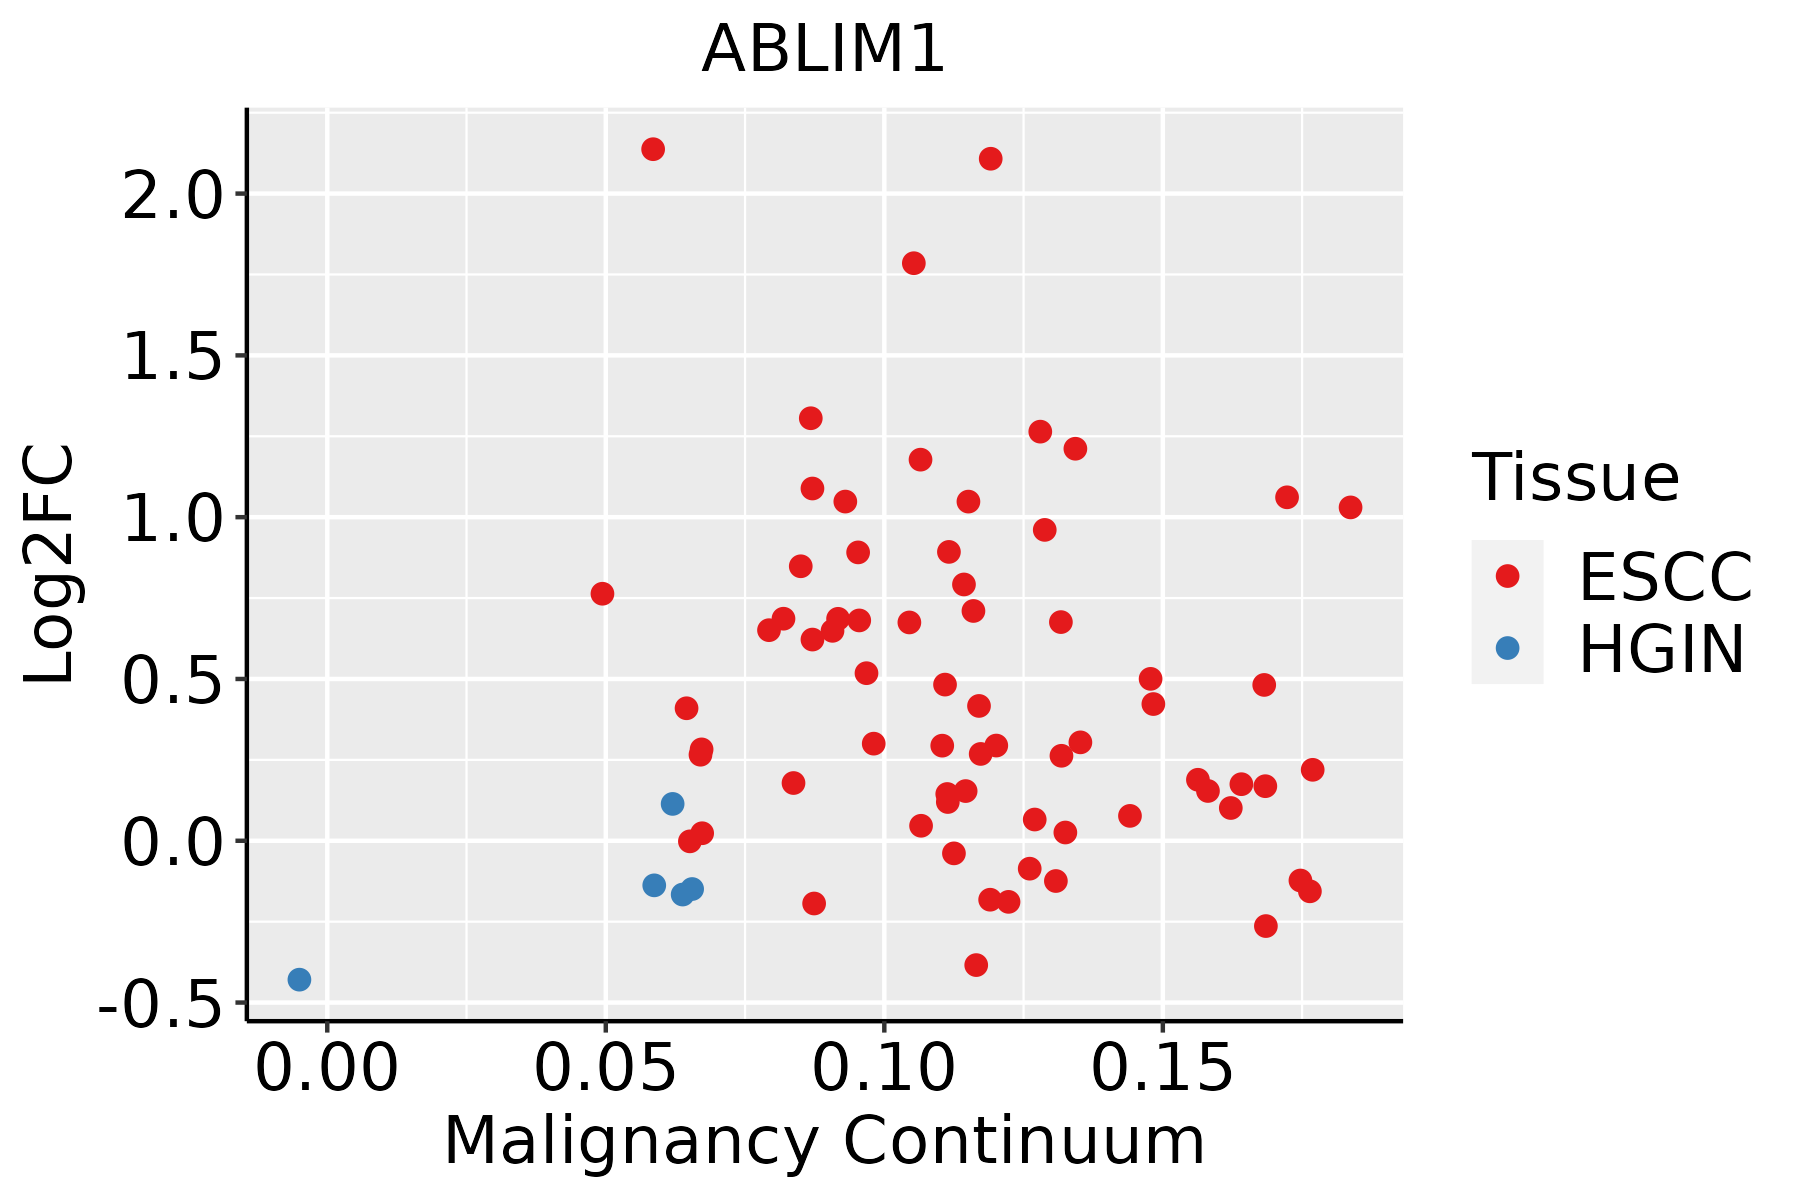 | ESCC: Esophageal squamous cell carcinoma |
| HGIN: High-grade intraepithelial neoplasias | ||
| LGIN: Low-grade intraepithelial neoplasias | ||
| GC |  | CAG: Chronic atrophic gastritis |
| CAG with IM: Chronic atrophic gastritis with intestinal metaplasia | ||
| CSG: Chronic superficial gastritis | ||
| GC: Gastric cancer | ||
| SIM: Severe intestinal metaplasia | ||
| WIM: Wild intestinal metaplasia | ||
| Liver | 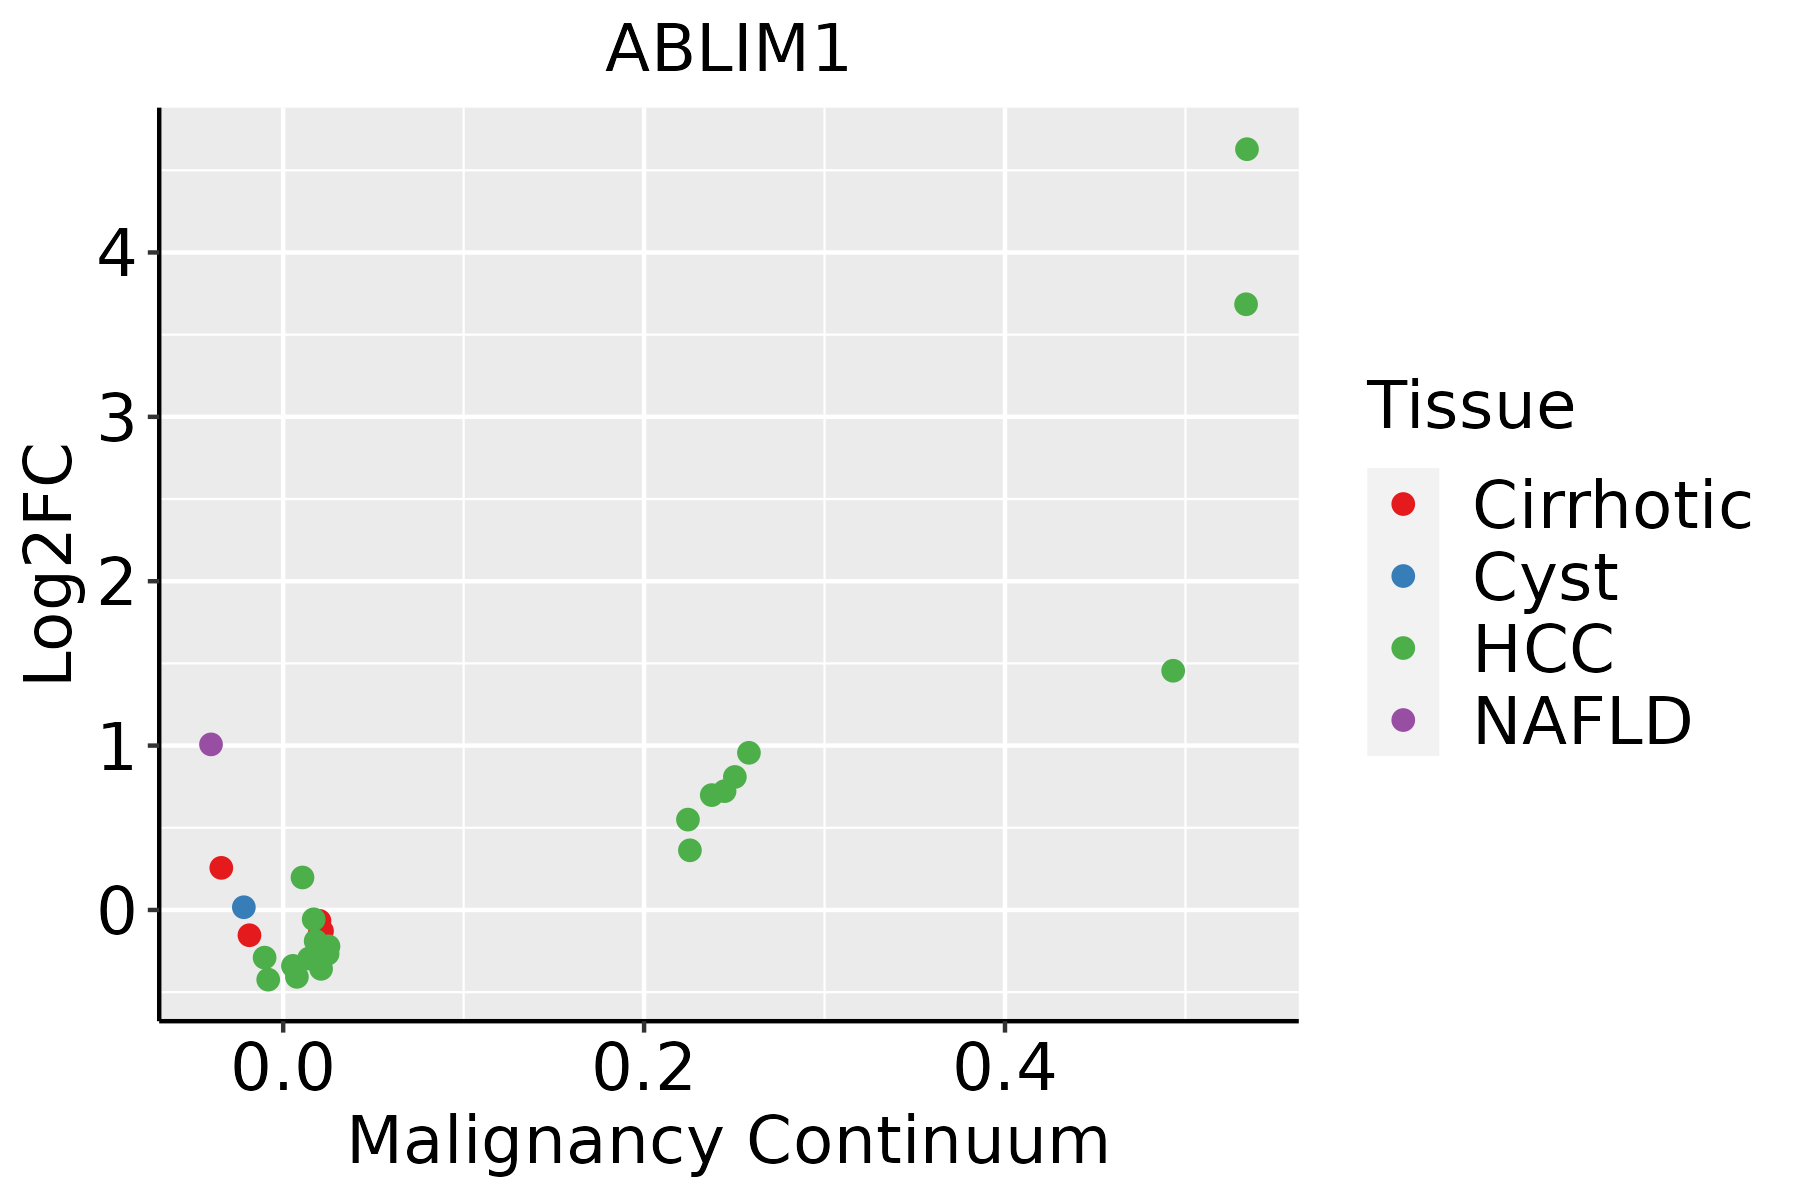 | HCC: Hepatocellular carcinoma |
| NAFLD: Non-alcoholic fatty liver disease | ||
| Lung | 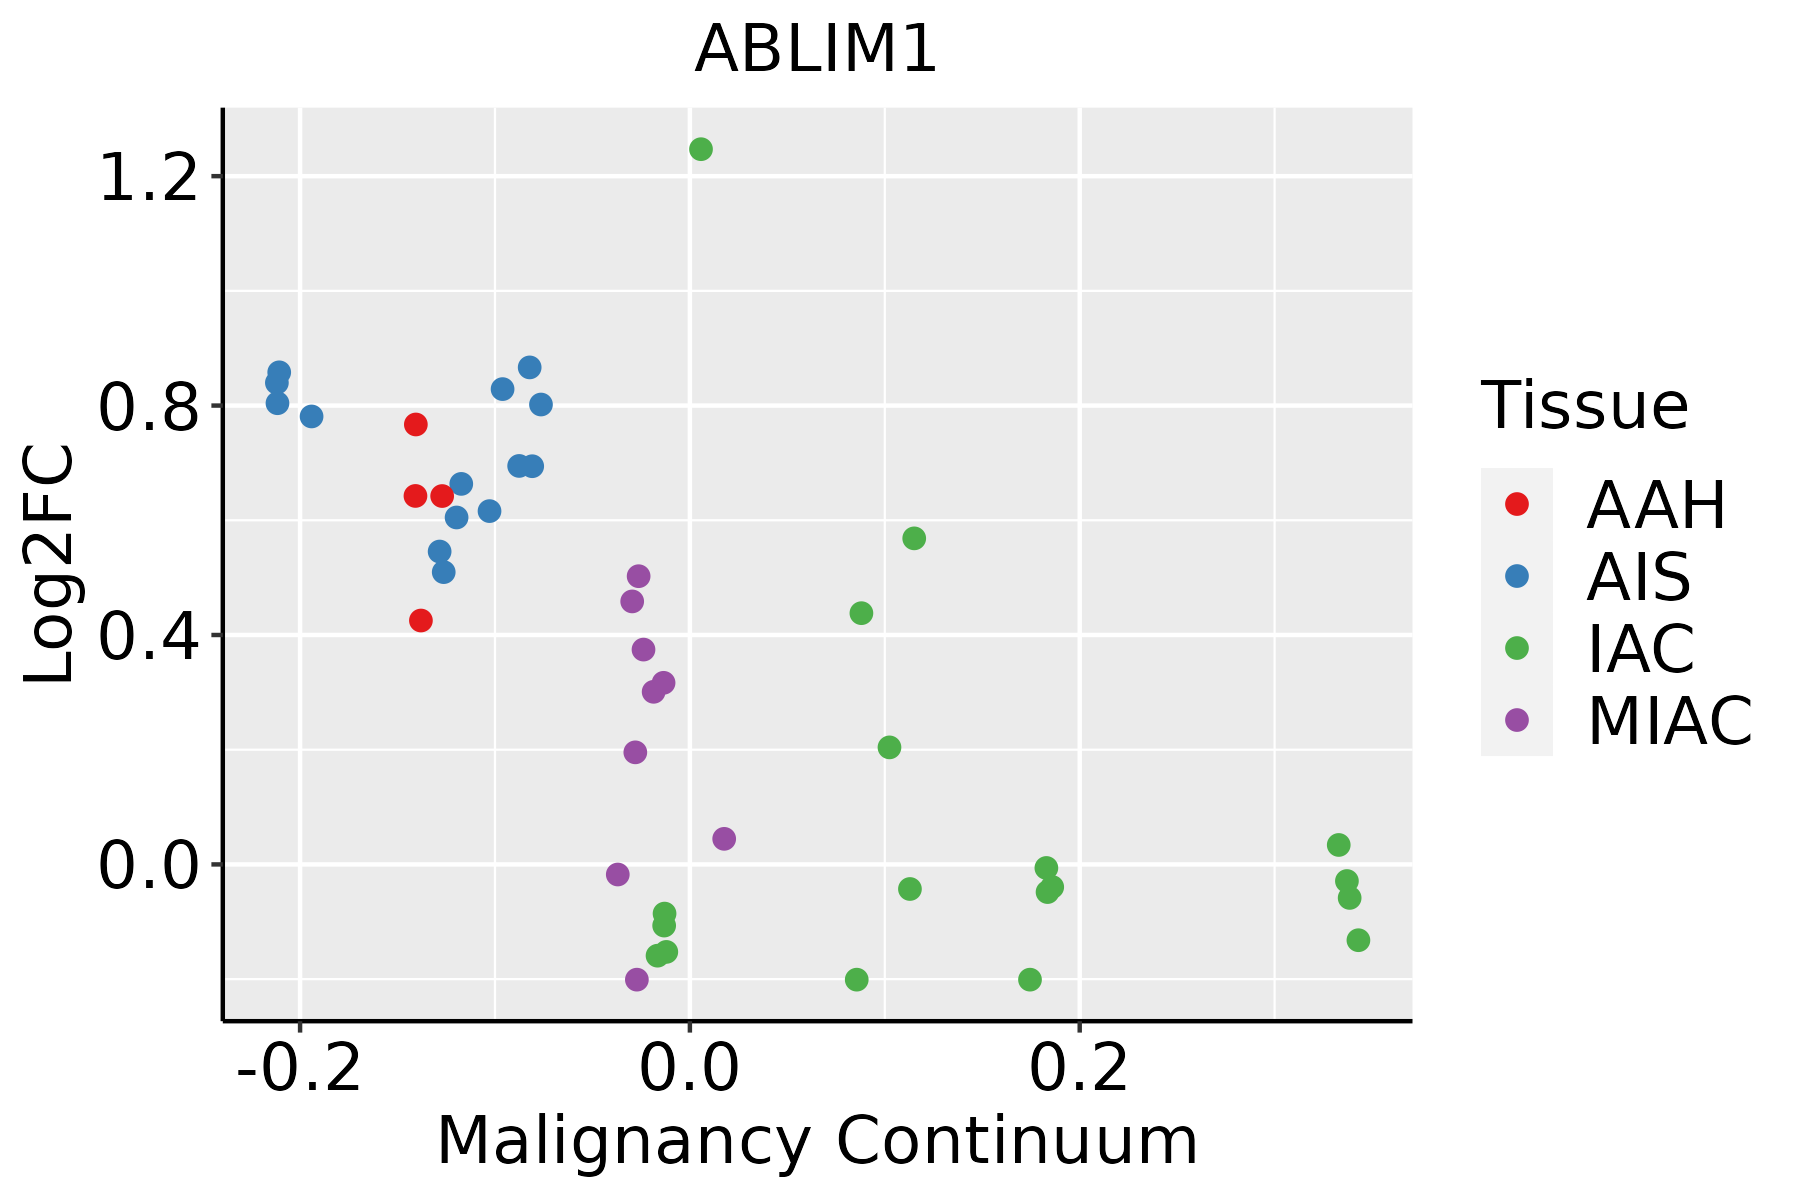 | AAH: Atypical adenomatous hyperplasia |
| AIS: Adenocarcinoma in situ | ||
| IAC: Invasive lung adenocarcinoma | ||
| MIA: Minimally invasive adenocarcinoma | ||
| Oral Cavity | 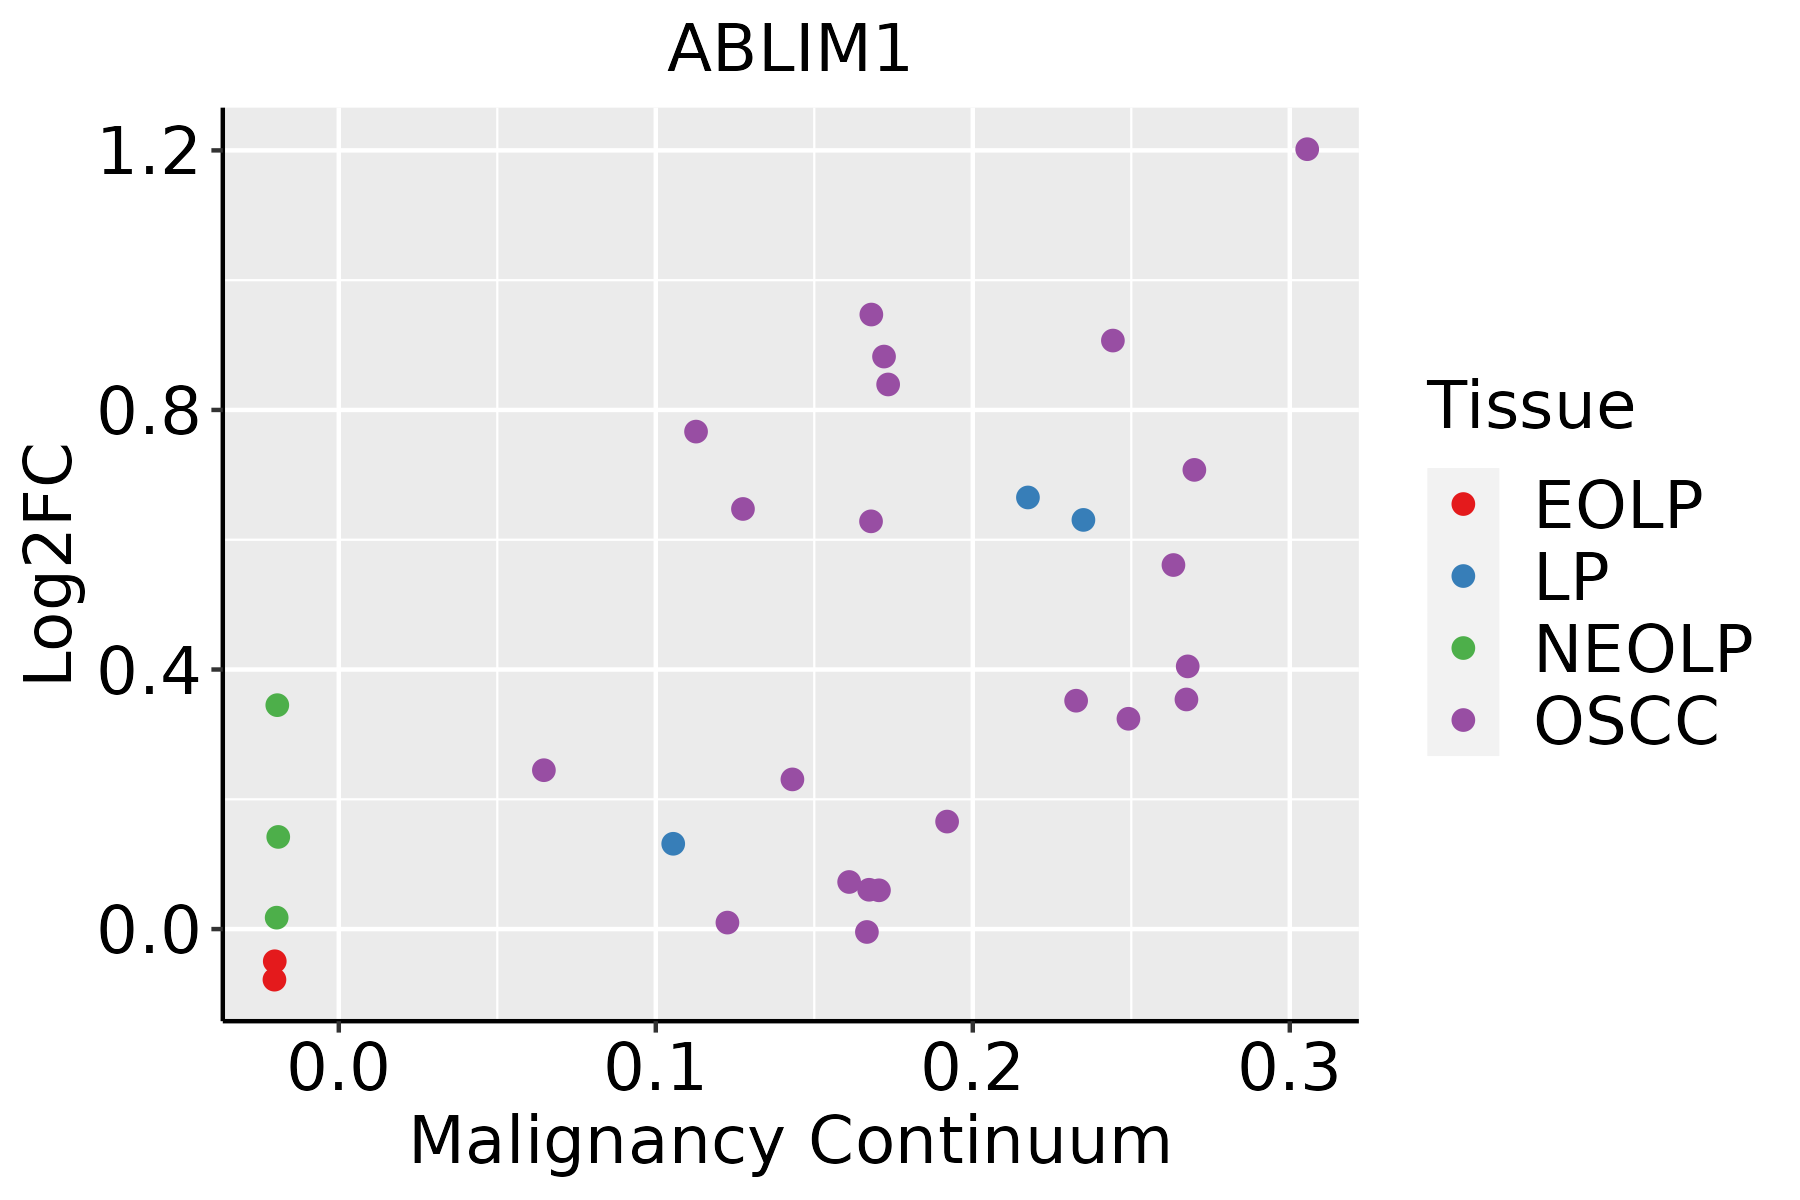 | EOLP: Erosive Oral lichen planus |
| LP: leukoplakia | ||
| NEOLP: Non-erosive oral lichen planus | ||
| OSCC: Oral squamous cell carcinoma | ||
| Prostate |  | BPH: Benign Prostatic Hyperplasia |
| Skin |  | AK: Actinic keratosis |
| cSCC: Cutaneous squamous cell carcinoma | ||
| SCCIS:squamous cell carcinoma in situ | ||
| Thyroid |  | ATC: Anaplastic thyroid cancer |
| HT: Hashimoto's thyroiditis | ||
| PTC: Papillary thyroid cancer |
| ∗log2FC in expression of this searched gene in stem-like cells from each diseased tissue sample relative to stem-like cells in normal samples in each tissue plotted against the malignancy continuum. Samples are colored based on if they are from different disease stage. |
Top |
Malignant transformation related pathway analysis |
| Find out the enriched GO biological processes and KEGG pathways involved in transition from healthy to precancer to cancer |
| Tissue | Disease Stage | Enriched GO biological Processes |
| Colorectum | AD |  |
| Colorectum | SER |  |
| Colorectum | MSS |  |
| Colorectum | MSI-H |  |
| Colorectum | FAP |  |
| ∗Top 15 enriched GO BP terms are showed in the bar plot of each disease state in each tissue. Each row represents a significant GO biological process which is colored according to the -log10(p.adjust). |
| Page: 1 2 3 4 5 6 7 8 9 |
| GO ID | Tissue | Disease Stage | Description | Gene Ratio | Bg Ratio | pvalue | p.adjust | Count |
| GO:00975817 | Cervix | CC | lamellipodium organization | 31/2311 | 90/18723 | 4.57e-08 | 2.76e-06 | 31 |
| GO:00300325 | Cervix | CC | lamellipodium assembly | 26/2311 | 72/18723 | 1.87e-07 | 8.48e-06 | 26 |
| GO:009758112 | Cervix | HSIL_HPV | lamellipodium organization | 10/737 | 90/18723 | 2.81e-03 | 2.66e-02 | 10 |
| GO:0097581 | Colorectum | AD | lamellipodium organization | 35/3918 | 90/18723 | 7.39e-05 | 1.18e-03 | 35 |
| GO:0030032 | Colorectum | AD | lamellipodium assembly | 26/3918 | 72/18723 | 2.12e-03 | 1.68e-02 | 26 |
| GO:00975811 | Colorectum | SER | lamellipodium organization | 24/2897 | 90/18723 | 4.33e-03 | 3.47e-02 | 24 |
| GO:00975812 | Colorectum | MSS | lamellipodium organization | 33/3467 | 90/18723 | 3.70e-05 | 7.09e-04 | 33 |
| GO:00300321 | Colorectum | MSS | lamellipodium assembly | 24/3467 | 72/18723 | 1.91e-03 | 1.66e-02 | 24 |
| GO:00975813 | Colorectum | MSI-H | lamellipodium organization | 15/1319 | 90/18723 | 1.48e-03 | 2.23e-02 | 15 |
| GO:00975814 | Colorectum | FAP | lamellipodium organization | 29/2622 | 90/18723 | 8.11e-06 | 2.40e-04 | 29 |
| GO:00300322 | Colorectum | FAP | lamellipodium assembly | 22/2622 | 72/18723 | 2.31e-04 | 3.25e-03 | 22 |
| GO:00975815 | Colorectum | CRC | lamellipodium organization | 28/2078 | 90/18723 | 2.43e-07 | 2.27e-05 | 28 |
| GO:00300323 | Colorectum | CRC | lamellipodium assembly | 22/2078 | 72/18723 | 6.40e-06 | 2.47e-04 | 22 |
| GO:009758116 | Esophagus | ESCC | lamellipodium organization | 53/8552 | 90/18723 | 7.92e-03 | 2.82e-02 | 53 |
| GO:00975816 | Liver | NAFLD | lamellipodium organization | 22/1882 | 90/18723 | 6.25e-05 | 1.37e-03 | 22 |
| GO:00300324 | Liver | NAFLD | lamellipodium assembly | 18/1882 | 72/18723 | 2.09e-04 | 3.60e-03 | 18 |
| GO:009758111 | Liver | Cirrhotic | lamellipodium organization | 40/4634 | 90/18723 | 3.48e-05 | 4.26e-04 | 40 |
| GO:003003211 | Liver | Cirrhotic | lamellipodium assembly | 30/4634 | 72/18723 | 1.18e-03 | 7.98e-03 | 30 |
| GO:009758121 | Liver | HCC | lamellipodium organization | 58/7958 | 90/18723 | 2.16e-05 | 2.30e-04 | 58 |
| GO:003003221 | Liver | HCC | lamellipodium assembly | 44/7958 | 72/18723 | 1.10e-03 | 6.32e-03 | 44 |
| Page: 1 2 |
| Pathway ID | Tissue | Disease Stage | Description | Gene Ratio | Bg Ratio | pvalue | p.adjust | qvalue | Count |
| hsa04360 | Colorectum | AD | Axon guidance | 61/2092 | 182/8465 | 4.36e-03 | 2.17e-02 | 1.38e-02 | 61 |
| hsa043601 | Colorectum | AD | Axon guidance | 61/2092 | 182/8465 | 4.36e-03 | 2.17e-02 | 1.38e-02 | 61 |
| hsa043602 | Colorectum | MSS | Axon guidance | 54/1875 | 182/8465 | 1.03e-02 | 3.69e-02 | 2.26e-02 | 54 |
| hsa043603 | Colorectum | MSS | Axon guidance | 54/1875 | 182/8465 | 1.03e-02 | 3.69e-02 | 2.26e-02 | 54 |
| hsa043604 | Colorectum | FAP | Axon guidance | 47/1404 | 182/8465 | 9.09e-04 | 5.20e-03 | 3.16e-03 | 47 |
| hsa043605 | Colorectum | FAP | Axon guidance | 47/1404 | 182/8465 | 9.09e-04 | 5.20e-03 | 3.16e-03 | 47 |
| hsa043606 | Colorectum | CRC | Axon guidance | 43/1091 | 182/8465 | 4.38e-05 | 8.70e-04 | 5.90e-04 | 43 |
| hsa043607 | Colorectum | CRC | Axon guidance | 43/1091 | 182/8465 | 4.38e-05 | 8.70e-04 | 5.90e-04 | 43 |
| hsa0436016 | Esophagus | ESCC | Axon guidance | 108/4205 | 182/8465 | 5.13e-03 | 1.30e-02 | 6.67e-03 | 108 |
| hsa0436017 | Esophagus | ESCC | Axon guidance | 108/4205 | 182/8465 | 5.13e-03 | 1.30e-02 | 6.67e-03 | 108 |
| hsa0436021 | Lung | AIS | Axon guidance | 34/961 | 182/8465 | 2.22e-03 | 1.37e-02 | 8.80e-03 | 34 |
| hsa0436031 | Lung | AIS | Axon guidance | 34/961 | 182/8465 | 2.22e-03 | 1.37e-02 | 8.80e-03 | 34 |
| Page: 1 |
Top |
Cell-cell communication analysis |
| Identification of potential cell-cell interactions between two cell types and their ligand-receptor pairs for different disease states |
| Ligand | Receptor | LRpair | Pathway | Tissue | Disease Stage |
| Page: 1 |
Top |
Single-cell gene regulatory network inference analysis |
| Find out the significant the regulons (TFs) and the target genes of each regulon across cell types for different disease states |
| TF | Cell Type | Tissue | Disease Stage | Target Gene | RSS | Regulon Activity |
| ∗The dot plots of a searched regulon are shown for all cell subpopulations in each disease state of each tissue based on the regulon specific score inferred using pySCENIC and by calculating the average expression. |
| Page: 1 |
Top |
Somatic mutation of malignant transformation related genes |
| Annotation of somatic variants for genes involved in malignant transformation |
| Hugo Symbol | Variant Class | Variant Classification | dbSNP RS | HGVSc | HGVSp | HGVSp Short | SWISSPROT | BIOTYPE | SIFT | PolyPhen | Tumor Sample Barcode | Tissue | Histology | Sex | Age | Stage | Therapy Types | Drugs | Outcome |
| ABLIM1 | SNV | Missense_Mutation | novel | c.1864N>C | p.Glu622Gln | p.E622Q | O14639 | protein_coding | deleterious(0.03) | benign(0.313) | TCGA-A2-A0EQ-01 | Breast | breast invasive carcinoma | Female | <65 | I/II | Chemotherapy | adriamycin | SD |
| ABLIM1 | insertion | Frame_Shift_Ins | novel | c.1858_1859insGCCCACACCCTTACCTG | p.Lys620SerfsTer21 | p.K620Sfs*21 | O14639 | protein_coding | TCGA-A8-A06P-01 | Breast | breast invasive carcinoma | Female | <65 | III/IV | Unspecific | SD | |||
| ABLIM1 | insertion | Frame_Shift_Ins | novel | c.1856_1857insTAGAAGTCCACATATTATAACCCCG | p.Leu619PhefsTer42 | p.L619Ffs*42 | O14639 | protein_coding | TCGA-A8-A06P-01 | Breast | breast invasive carcinoma | Female | <65 | III/IV | Unspecific | SD | |||
| ABLIM1 | deletion | Frame_Shift_Del | c.1352_1358delNNNNNNN | p.Thr451ArgfsTer49 | p.T451Rfs*49 | O14639 | protein_coding | TCGA-A8-A09A-01 | Breast | breast invasive carcinoma | Female | <65 | I/II | Hormone Therapy | tamoxiphen | SD | |||
| ABLIM1 | SNV | Missense_Mutation | rs868447773 | c.1387C>T | p.Arg463Cys | p.R463C | O14639 | protein_coding | deleterious(0.01) | possibly_damaging(0.779) | TCGA-VS-A9U7-01 | Cervix | cervical & endocervical cancer | Female | <65 | I/II | Chemotherapy | cisplatin | CR |
| ABLIM1 | SNV | Missense_Mutation | c.1081N>T | p.Gly361Cys | p.G361C | O14639 | protein_coding | deleterious(0) | probably_damaging(0.984) | TCGA-AA-3713-01 | Colorectum | colon adenocarcinoma | Male | >=65 | III/IV | Chemotherapy | 5-fluorouracil | PR | |
| ABLIM1 | SNV | Missense_Mutation | c.521N>A | p.Gly174Asp | p.G174D | O14639 | protein_coding | deleterious(0.03) | probably_damaging(0.954) | TCGA-AA-3713-01 | Colorectum | colon adenocarcinoma | Male | >=65 | III/IV | Chemotherapy | 5-fluorouracil | PR | |
| ABLIM1 | SNV | Missense_Mutation | rs756279625 | c.502N>A | p.Glu168Lys | p.E168K | O14639 | protein_coding | deleterious(0.03) | possibly_damaging(0.7) | TCGA-AA-3715-01 | Colorectum | colon adenocarcinoma | Male | >=65 | I/II | Unknown | Unknown | PD |
| ABLIM1 | SNV | Missense_Mutation | rs202220476 | c.470N>A | p.Arg157His | p.R157H | O14639 | protein_coding | deleterious(0) | possibly_damaging(0.558) | TCGA-AA-3966-01 | Colorectum | colon adenocarcinoma | Female | >=65 | I/II | Unknown | Unknown | SD |
| ABLIM1 | SNV | Missense_Mutation | rs202220476 | c.470G>A | p.Arg157His | p.R157H | O14639 | protein_coding | deleterious(0) | possibly_damaging(0.558) | TCGA-WS-AB45-01 | Colorectum | colon adenocarcinoma | Female | <65 | I/II | Unknown | Unknown | SD |
| Page: 1 2 3 4 5 6 7 8 9 |
Top |
Related drugs of malignant transformation related genes |
| Identification of chemicals and drugs interact with genes involved in malignant transfromation |
| (DGIdb 4.0) |
| Entrez ID | Symbol | Category | Interaction Types | Drug Claim Name | Drug Name | PMIDs |
| Page: 1 |

Copyright 2023-Present -The University of Texas Health Science Center at Houston |