
|
|||||
|
 | |
| |
| |
| |
| |
| |
|
Gene: ZNF428 |
Gene summary for ZNF428 |
| Gene information | Species | Human | Gene symbol | ZNF428 | Gene ID | 126299 |
| Gene name | zinc finger protein 428 | |
| Gene Alias | C19orf37 | |
| Cytomap | 19q13.31 | |
| Gene Type | protein-coding | GO ID | GO:0003674 | UniProtAcc | I6L9C8 |
Top |
Malignant transformation analysis |
| Identification of the aberrant gene expression in precancerous and cancerous lesions by comparing the gene expression of stem-like cells in diseased tissues with normal stem cells |
| Entrez ID | Symbol | Replicates | Species | Organ | Tissue | Adj P-value | Log2FC | Malignancy |
| 126299 | ZNF428 | SYSMH2 | Human | Oral cavity | OSCC | 8.56e-22 | 7.60e-01 | 0.2326 |
| 126299 | ZNF428 | SYSMH3 | Human | Oral cavity | OSCC | 8.30e-20 | 7.69e-01 | 0.2442 |
| 126299 | ZNF428 | SYSMH4 | Human | Oral cavity | OSCC | 3.62e-06 | 1.47e-01 | 0.1226 |
| 126299 | ZNF428 | SYSMH5 | Human | Oral cavity | OSCC | 3.71e-04 | 2.52e-01 | 0.0647 |
| 126299 | ZNF428 | SYSMH6 | Human | Oral cavity | OSCC | 1.93e-14 | 5.34e-01 | 0.1275 |
| 126299 | ZNF428 | GSM5252128_BPH327PrGF_Via | Human | Prostate | BPH | 1.34e-05 | 3.30e-01 | -0.1688 |
| 126299 | ZNF428 | GSM5252131_BPH340PrSF_Via | Human | Prostate | BPH | 5.47e-04 | 3.44e-01 | -0.2126 |
| 126299 | ZNF428 | GSM5252136_BPH556PrGA1_Fcol | Human | Prostate | BPH | 8.03e-09 | 3.75e-01 | -0.23 |
| 126299 | ZNF428 | GSM5252137_BPH556PrGA2_Fcol | Human | Prostate | BPH | 5.73e-10 | 5.87e-01 | -0.23 |
| 126299 | ZNF428 | 047563_1562-all-cells | Human | Prostate | BPH | 3.28e-08 | -1.52e-01 | 0.0791 |
| 126299 | ZNF428 | Dong_P1 | Human | Prostate | Tumor | 1.50e-36 | 3.44e-01 | 0.035 |
| 126299 | ZNF428 | Dong_P3 | Human | Prostate | Tumor | 3.90e-20 | 4.62e-01 | 0.0278 |
| 126299 | ZNF428 | Dong_P4 | Human | Prostate | Tumor | 5.40e-15 | 3.86e-01 | 0.0292 |
| 126299 | ZNF428 | Dong_P5 | Human | Prostate | Tumor | 1.41e-55 | 7.29e-01 | 0.053 |
| 126299 | ZNF428 | GSM5353243_PA_PR5261_T1_S23_L002 | Human | Prostate | Tumor | 1.44e-04 | -1.77e-01 | 0.1545 |
| 126299 | ZNF428 | GSM5353244_PA_PR5261_T2_S24_L002 | Human | Prostate | Tumor | 2.84e-03 | -1.28e-01 | 0.1569 |
| 126299 | ZNF428 | P1_cSCC | Human | Skin | cSCC | 1.51e-20 | 8.31e-01 | 0.0292 |
| 126299 | ZNF428 | P2_cSCC | Human | Skin | cSCC | 5.59e-21 | 7.24e-01 | -0.024 |
| 126299 | ZNF428 | P4_cSCC | Human | Skin | cSCC | 7.85e-15 | 5.48e-01 | -0.00290000000000005 |
| 126299 | ZNF428 | P10_cSCC | Human | Skin | cSCC | 2.63e-15 | 6.77e-01 | 0.1017 |
| Page: 1 2 3 4 5 6 7 8 9 |
| Tissue | Expression Dynamics | Abbreviation |
| Colorectum (GSE201348) |  | FAP: Familial adenomatous polyposis |
| CRC: Colorectal cancer | ||
| Colorectum (HTA11) |  | AD: Adenomas |
| SER: Sessile serrated lesions | ||
| MSI-H: Microsatellite-high colorectal cancer | ||
| MSS: Microsatellite stable colorectal cancer | ||
| Endometrium | 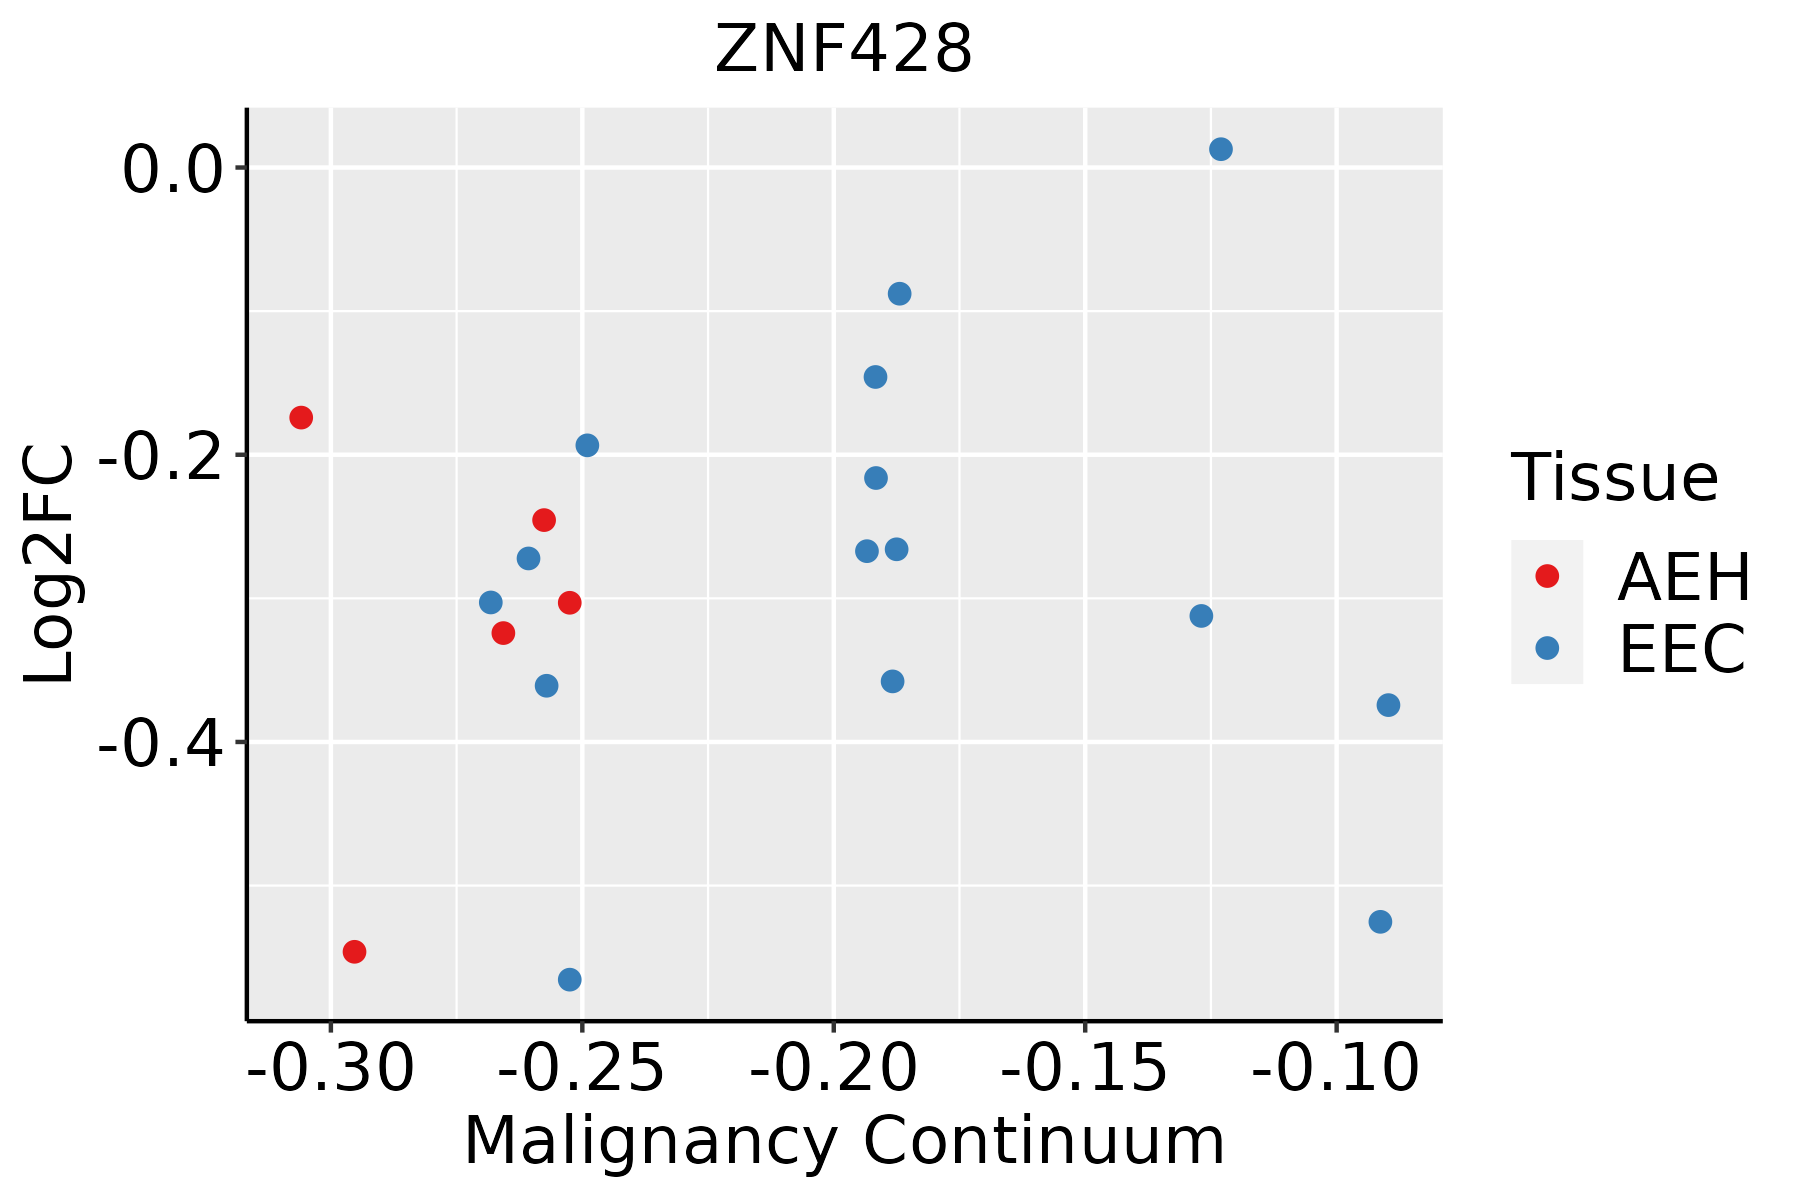 | AEH: Atypical endometrial hyperplasia |
| EEC: Endometrioid Cancer | ||
| Esophagus | 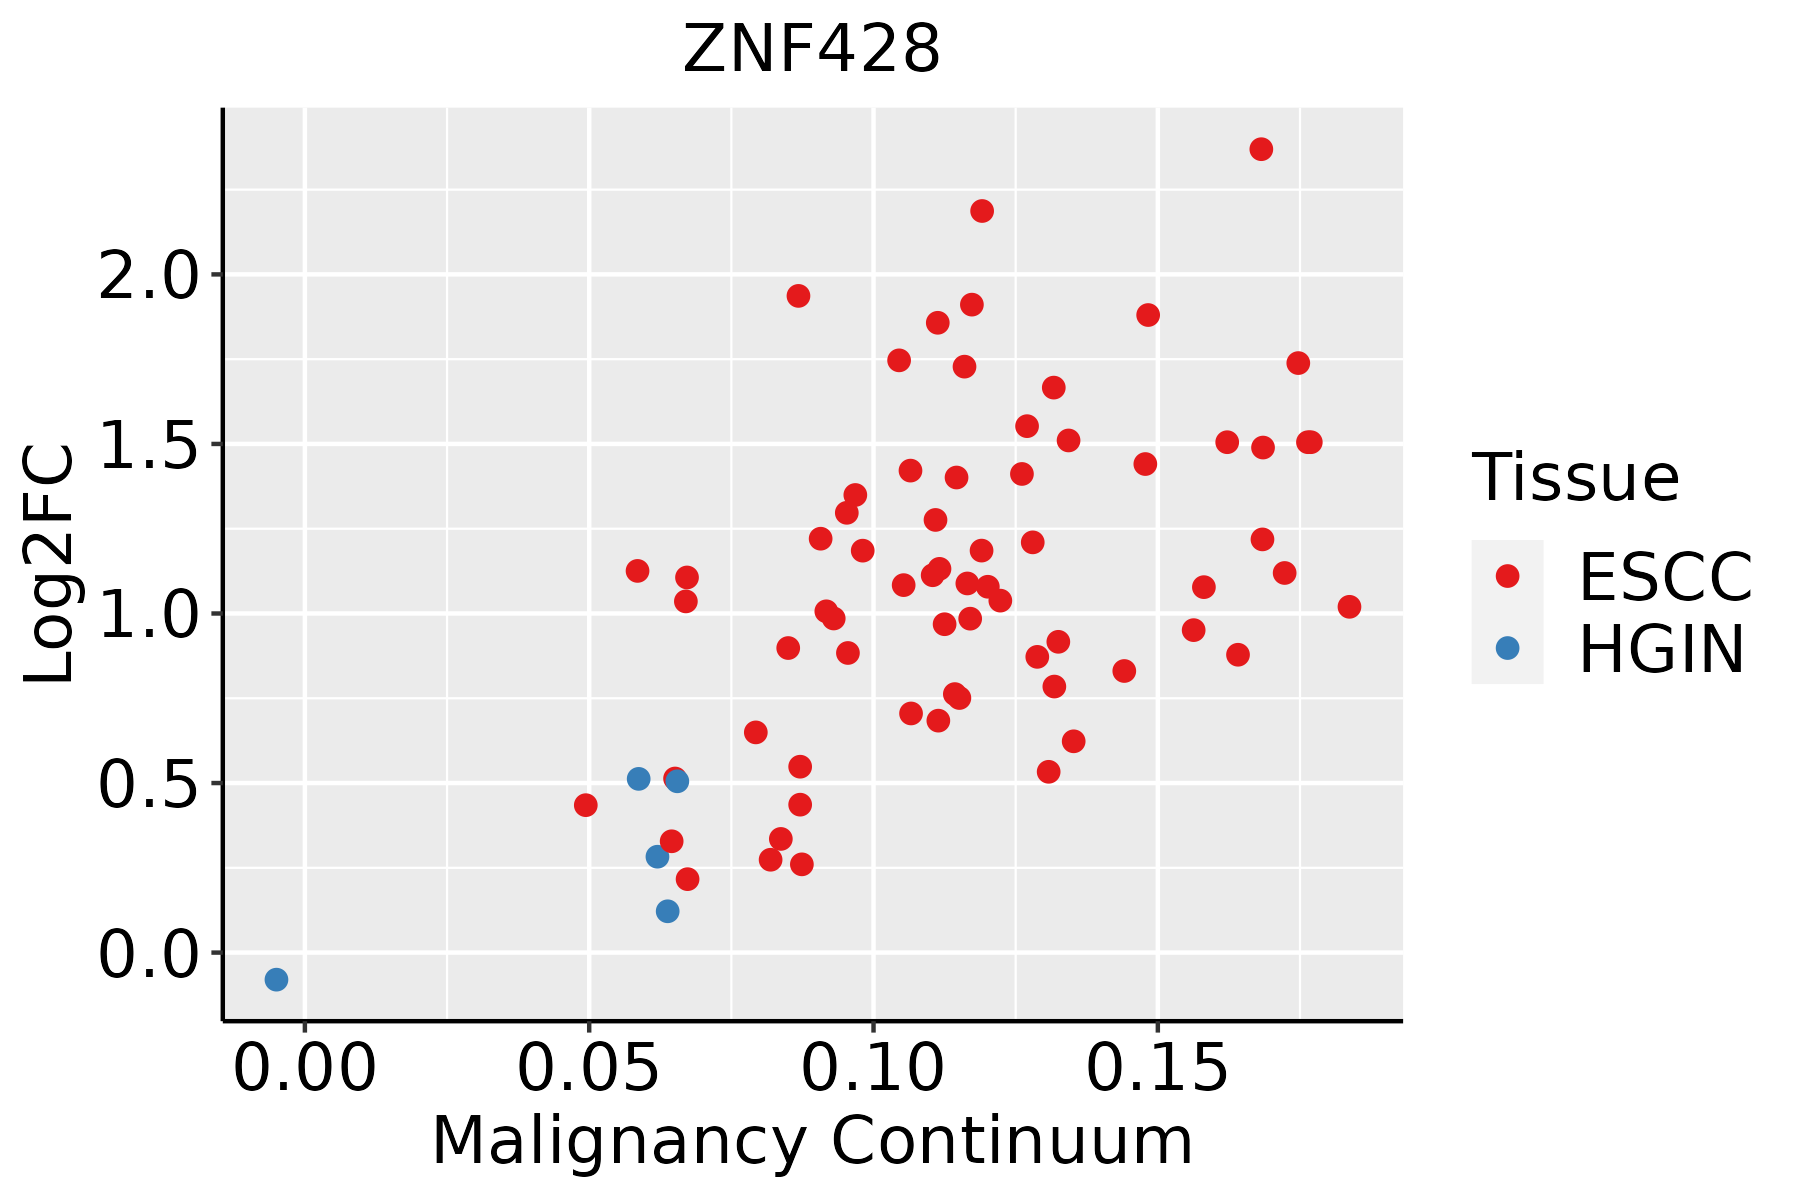 | ESCC: Esophageal squamous cell carcinoma |
| HGIN: High-grade intraepithelial neoplasias | ||
| LGIN: Low-grade intraepithelial neoplasias | ||
| Liver | 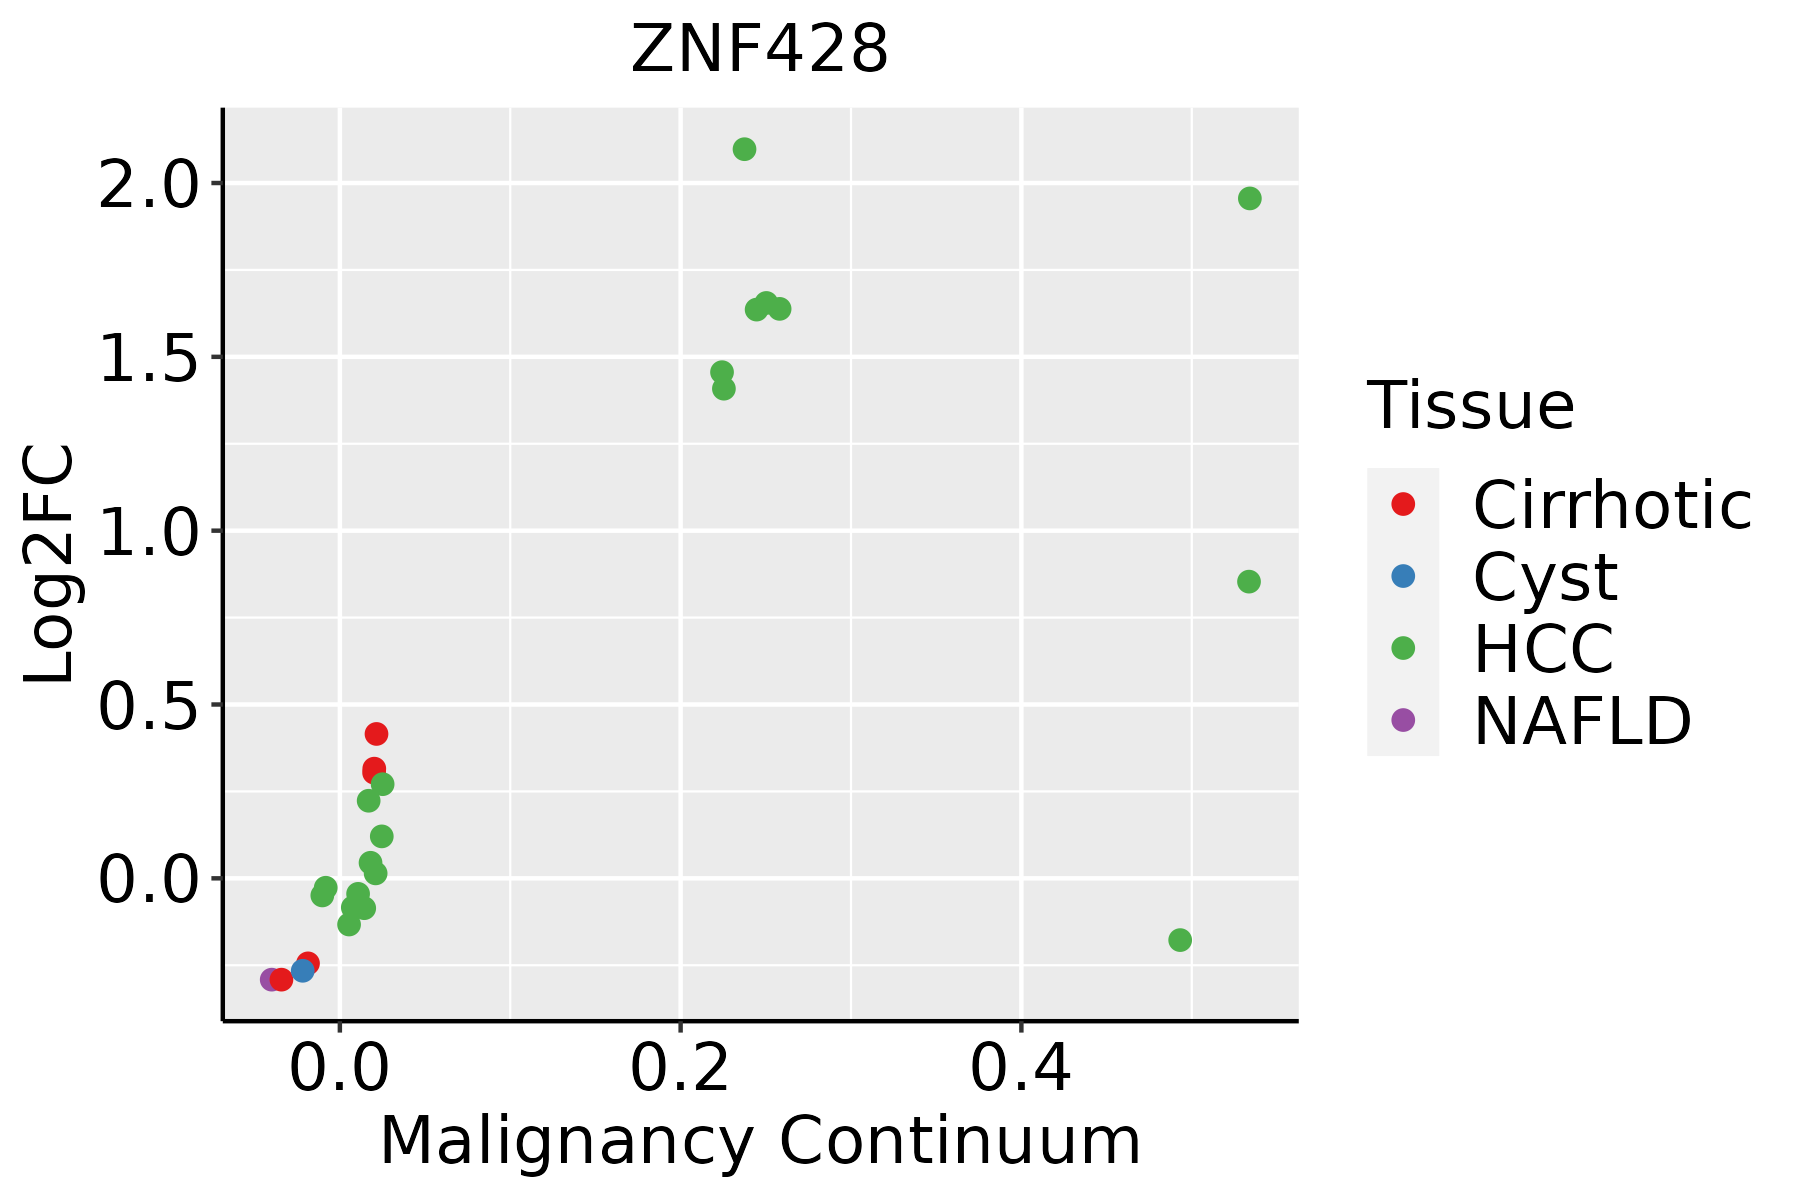 | HCC: Hepatocellular carcinoma |
| NAFLD: Non-alcoholic fatty liver disease | ||
| Oral Cavity | 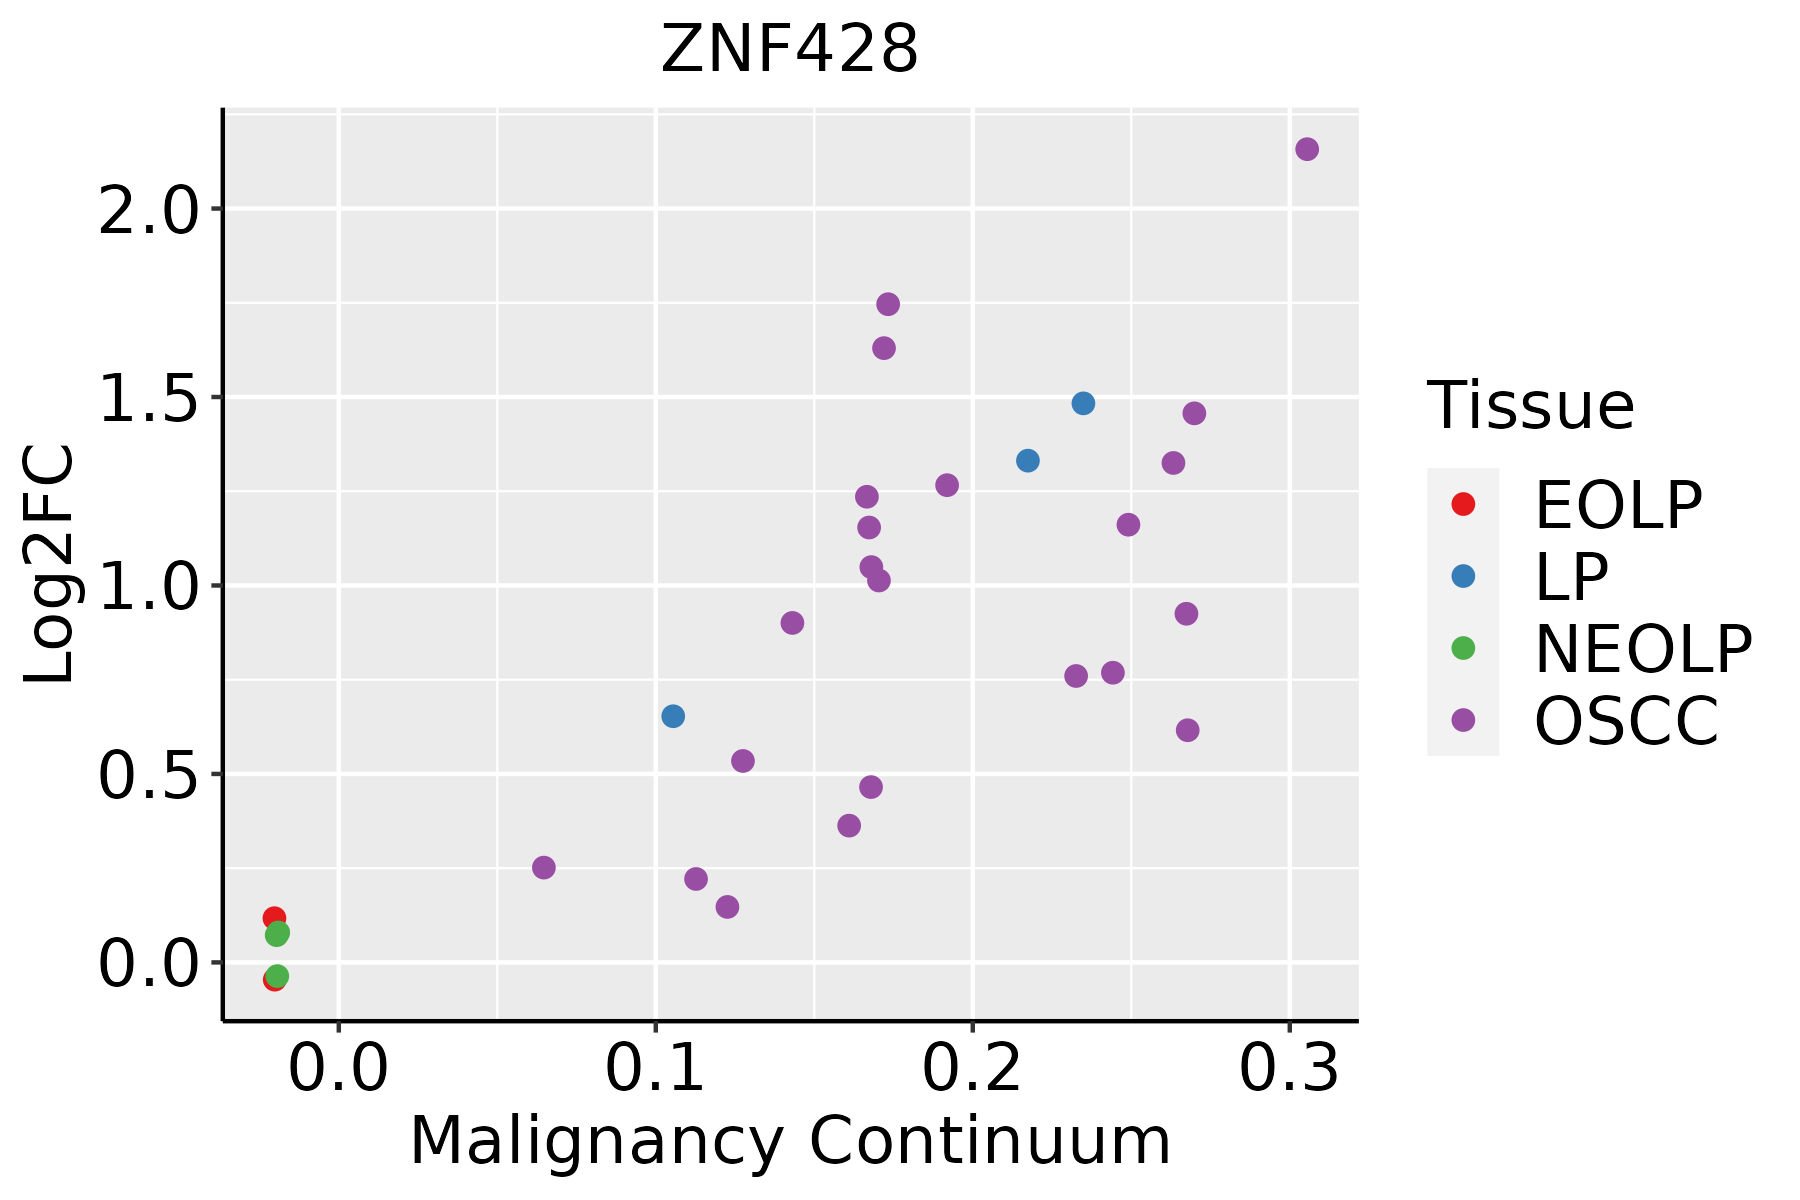 | EOLP: Erosive Oral lichen planus |
| LP: leukoplakia | ||
| NEOLP: Non-erosive oral lichen planus | ||
| OSCC: Oral squamous cell carcinoma | ||
| Prostate | 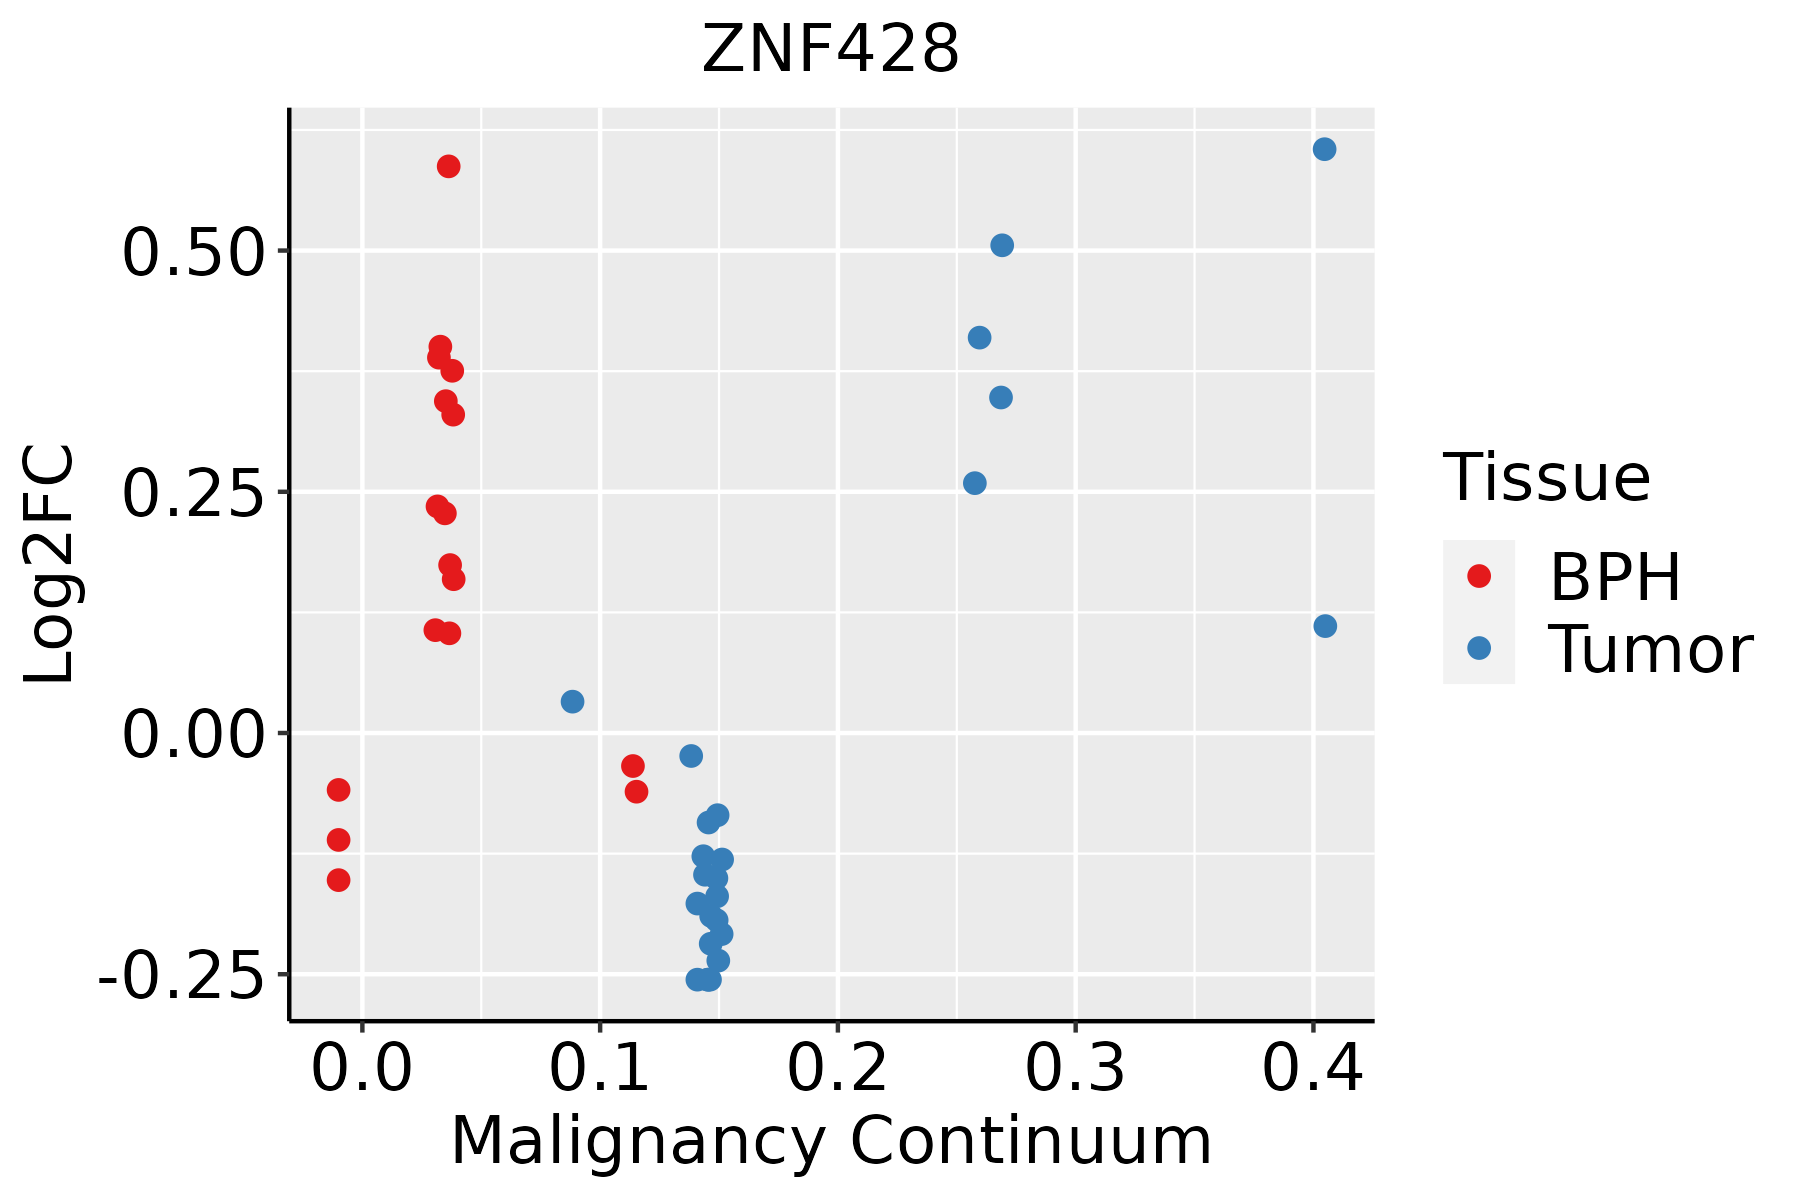 | BPH: Benign Prostatic Hyperplasia |
| Skin |  | AK: Actinic keratosis |
| cSCC: Cutaneous squamous cell carcinoma | ||
| SCCIS:squamous cell carcinoma in situ | ||
| Thyroid | 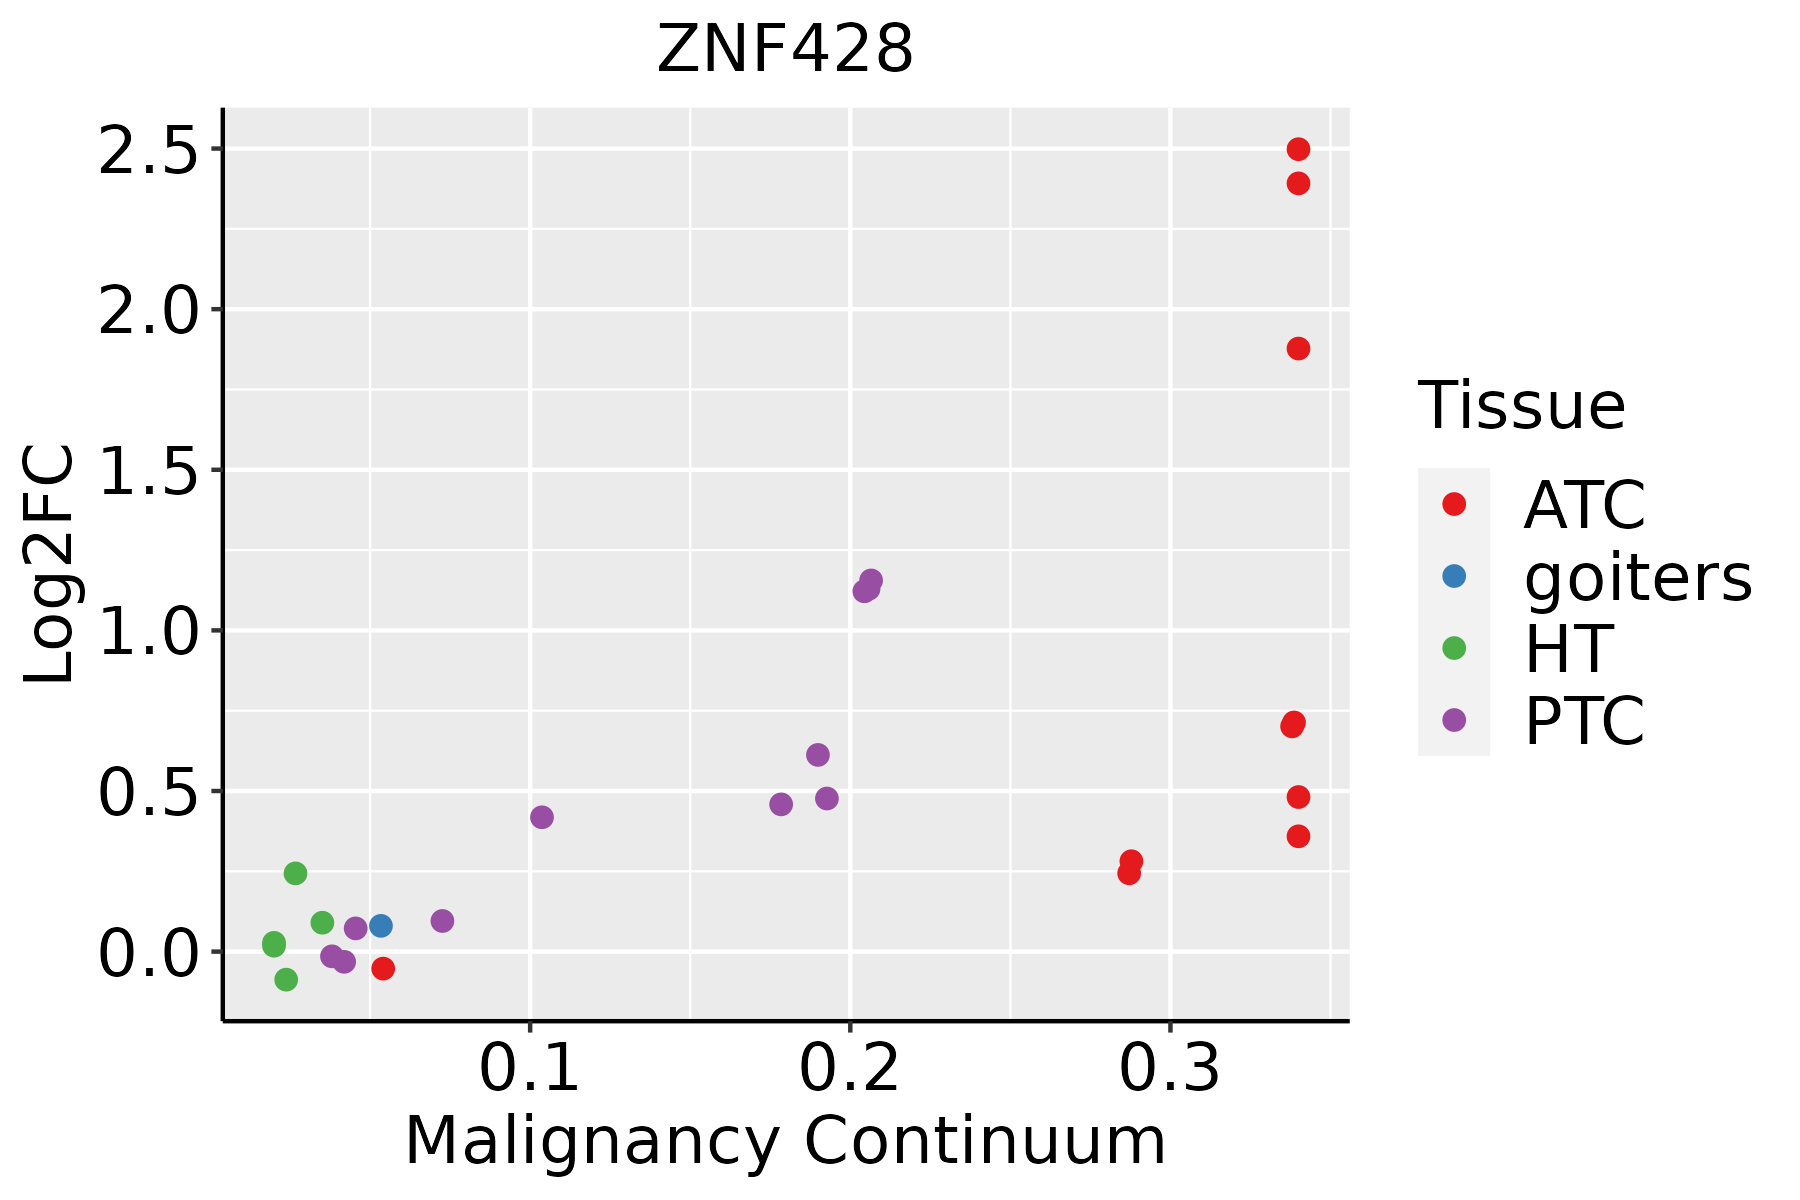 | ATC: Anaplastic thyroid cancer |
| HT: Hashimoto's thyroiditis | ||
| PTC: Papillary thyroid cancer |
| ∗log2FC in expression of this searched gene in stem-like cells from each diseased tissue sample relative to stem-like cells in normal samples in each tissue plotted against the malignancy continuum. Samples are colored based on if they are from different disease stage. |
Top |
Malignant transformation related pathway analysis |
| Find out the enriched GO biological processes and KEGG pathways involved in transition from healthy to precancer to cancer |
| Tissue | Disease Stage | Enriched GO biological Processes |
| Colorectum | AD |  |
| Colorectum | SER |  |
| Colorectum | MSS |  |
| Colorectum | MSI-H |  |
| Colorectum | FAP |  |
| ∗Top 15 enriched GO BP terms are showed in the bar plot of each disease state in each tissue. Each row represents a significant GO biological process which is colored according to the -log10(p.adjust). |
| Page: 1 2 3 4 5 6 7 8 9 |
| GO ID | Tissue | Disease Stage | Description | Gene Ratio | Bg Ratio | pvalue | p.adjust | Count |
| Page: 1 |
| Pathway ID | Tissue | Disease Stage | Description | Gene Ratio | Bg Ratio | pvalue | p.adjust | qvalue | Count |
| Page: 1 |
Top |
Cell-cell communication analysis |
| Identification of potential cell-cell interactions between two cell types and their ligand-receptor pairs for different disease states |
| Ligand | Receptor | LRpair | Pathway | Tissue | Disease Stage |
| Page: 1 |
Top |
Single-cell gene regulatory network inference analysis |
| Find out the significant the regulons (TFs) and the target genes of each regulon across cell types for different disease states |
| TF | Cell Type | Tissue | Disease Stage | Target Gene | RSS | Regulon Activity |
| ∗The dot plots of a searched regulon are shown for all cell subpopulations in each disease state of each tissue based on the regulon specific score inferred using pySCENIC and by calculating the average expression. |
| Page: 1 |
Top |
Somatic mutation of malignant transformation related genes |
| Annotation of somatic variants for genes involved in malignant transformation |
| Hugo Symbol | Variant Class | Variant Classification | dbSNP RS | HGVSc | HGVSp | HGVSp Short | SWISSPROT | BIOTYPE | SIFT | PolyPhen | Tumor Sample Barcode | Tissue | Histology | Sex | Age | Stage | Therapy Types | Drugs | Outcome |
| ZNF428 | insertion | Nonsense_Mutation | novel | c.61_62insCCTGGCTAATTTTTTAATTTTTTGTAGAGACGGAGTCTTGCTATAT | p.Glu21AlafsTer6 | p.E21Afs*6 | Q96B54 | protein_coding | TCGA-A2-A0CP-01 | Breast | breast invasive carcinoma | Female | <65 | I/II | Chemotherapy | cytoxan | SD | ||
| ZNF428 | SNV | Missense_Mutation | rs568095447 | c.416C>T | p.Pro139Leu | p.P139L | Q96B54 | protein_coding | deleterious_low_confidence(0.01) | benign(0.001) | TCGA-AA-A022-01 | Colorectum | colon adenocarcinoma | Female | >=65 | I/II | Unknown | Unknown | SD |
| ZNF428 | SNV | Missense_Mutation | c.82N>A | p.Glu28Lys | p.E28K | Q96B54 | protein_coding | deleterious_low_confidence(0.04) | probably_damaging(0.956) | TCGA-AD-6889-01 | Colorectum | colon adenocarcinoma | Male | >=65 | I/II | Chemotherapy | xeloda | PD | |
| ZNF428 | SNV | Missense_Mutation | c.238C>T | p.Arg80Cys | p.R80C | Q96B54 | protein_coding | deleterious_low_confidence(0.01) | probably_damaging(0.942) | TCGA-EI-7004-01 | Colorectum | rectum adenocarcinoma | Female | <65 | III/IV | Chemotherapy | xeloda | SD | |
| ZNF428 | SNV | Missense_Mutation | rs544659085 | c.503A>G | p.Asp168Gly | p.D168G | Q96B54 | protein_coding | deleterious_low_confidence(0) | benign(0.031) | TCGA-A5-A0G2-01 | Endometrium | uterine corpus endometrioid carcinoma | Female | <65 | III/IV | Unknown | Unknown | SD |
| ZNF428 | SNV | Missense_Mutation | rs201481478 | c.13C>T | p.Arg5Cys | p.R5C | Q96B54 | protein_coding | deleterious_low_confidence(0) | probably_damaging(0.988) | TCGA-AP-A056-01 | Endometrium | uterine corpus endometrioid carcinoma | Female | <65 | I/II | Unknown | Unknown | SD |
| ZNF428 | SNV | Missense_Mutation | rs771593141 | c.40G>A | p.Ala14Thr | p.A14T | Q96B54 | protein_coding | deleterious_low_confidence(0) | probably_damaging(0.982) | TCGA-D1-A17M-01 | Endometrium | uterine corpus endometrioid carcinoma | Female | <65 | I/II | Unknown | Unknown | SD |
| ZNF428 | SNV | Missense_Mutation | novel | c.241N>T | p.Arg81Trp | p.R81W | Q96B54 | protein_coding | deleterious_low_confidence(0) | probably_damaging(0.942) | TCGA-EO-A22R-01 | Endometrium | uterine corpus endometrioid carcinoma | Female | <65 | I/II | Unknown | Unknown | SD |
| ZNF428 | SNV | Missense_Mutation | novel | c.311C>T | p.Ala104Val | p.A104V | Q96B54 | protein_coding | tolerated_low_confidence(0.09) | benign(0) | TCGA-EO-A22U-01 | Endometrium | uterine corpus endometrioid carcinoma | Female | >=65 | I/II | Unknown | Unknown | SD |
| ZNF428 | SNV | Missense_Mutation | novel | c.133G>A | p.Glu45Lys | p.E45K | Q96B54 | protein_coding | deleterious_low_confidence(0.02) | benign(0.031) | TCGA-50-6595-01 | Lung | lung adenocarcinoma | Female | >=65 | III/IV | Chemotherapy | carboplatin | PD |
| Page: 1 2 |
Top |
Related drugs of malignant transformation related genes |
| Identification of chemicals and drugs interact with genes involved in malignant transfromation |
| (DGIdb 4.0) |
| Entrez ID | Symbol | Category | Interaction Types | Drug Claim Name | Drug Name | PMIDs |
| Page: 1 |

Copyright 2023-Present -The University of Texas Health Science Center at Houston |