Schematic overview of the cellular and molecular mechanisms involved in the cancer progression, including the proposed cellular and molecular mechanisms in cancer cells trajectory. AT1: alveolar type 1 cells; AT2: alveolar type 2 cells; AAH: atypical adenomatous hyperplasia; AIS: adenocarcinoma in situ; MIA: minimally invasive adenocarcinoma; IA: invasive adenocarcinoma; EMT: epithelial-mesenchymal transition

Home

Download

Statistics

Help

Contact

Center for Computational Systems Medicine
leaf

Gene summary

leaf

Malignant transformation analysis

leaf

Malignant transformation related pathway analysis

leaf

Cell-cell communication analysis

leaf

Single-cell gene regulatory network inference analysis

leaf

Somatic mutation of malignant transformation related genes

leaf

Related drugs of malignant transformation related genes

Gene: ZMYND8

Gene summary for ZMYND8

check button Gene summary.

Gene informationSpeciesHuman
Gene symbol

ZMYND8

Gene ID

23613

Gene namezinc finger MYND-type containing 8
Gene AliasPRKCBP1
Cytomap20q13.12
Gene Typeprotein-coding
GO ID

GO:0001941

UniProtAcc

Q569J9


Top

Malignant transformation analysis

check button Identification of the aberrant gene expression in precancerous and cancerous lesions by comparing the gene expression of stem-like cells in diseased tissues with normal stem cells
check button Malignant transformation involving gene list.
Entrez IDSymbolReplicatesSpeciesOrganTissueAdj P-valueLog2FCMalignancy
23613ZMYND8Pt14.aHumanLiverHCC4.34e-053.39e-010.0169
23613ZMYND8S014HumanLiverHCC1.51e-105.44e-010.2254
23613ZMYND8S015HumanLiverHCC4.21e-188.29e-010.2375
23613ZMYND8S016HumanLiverHCC1.16e-146.46e-010.2243
23613ZMYND8S027HumanLiverHCC1.96e-171.41e+000.2446
23613ZMYND8S028HumanLiverHCC1.74e-321.49e+000.2503
23613ZMYND8S029HumanLiverHCC3.88e-271.31e+000.2581
23613ZMYND8TD9HumanLungIAC2.15e-036.00e-010.088
23613ZMYND8RNA-P17T-P17T-2HumanLungIAC5.92e-034.35e-010.3371
23613ZMYND8RNA-P17T-P17T-8HumanLungIAC3.61e-024.16e-010.3329
23613ZMYND8RNA-P25T1-P25T1-1HumanLungAIS2.11e-166.85e-01-0.2116
23613ZMYND8RNA-P25T1-P25T1-3HumanLungAIS2.38e-047.03e-01-0.2107
23613ZMYND8RNA-P25T1-P25T1-4HumanLungAIS4.78e-106.77e-01-0.2119
23613ZMYND8RNA-P6T2-P6T2-1HumanLungIAC7.64e-104.63e-01-0.0166
23613ZMYND8RNA-P6T2-P6T2-2HumanLungIAC2.18e-144.34e-01-0.0132
23613ZMYND8RNA-P6T2-P6T2-3HumanLungIAC1.49e-195.74e-01-0.013
23613ZMYND8RNA-P6T2-P6T2-4HumanLungIAC1.87e-114.64e-01-0.0121
23613ZMYND8RNA-P7T1-P7T1-2HumanLungAIS1.43e-034.42e-01-0.0876
23613ZMYND8C21HumanOral cavityOSCC2.48e-278.66e-010.2678
23613ZMYND8C30HumanOral cavityOSCC1.67e-154.85e-010.3055
Page: 1 2 3 4 5 6 7 8 9 10 11 

check button Transcriptomic changes along malignancy continuum.
TissueExpression DynamicsAbbreviation
BreastThe image shows the transcriptomic changes along malignancy continuum.log2FC in expression of this searched gene in stem-like cells from each diseased tissue sample relative to stem-like cells in normal samples in each tissue plotted against the malignancy continuum. Samples are colored based on if they are from different disease stage.
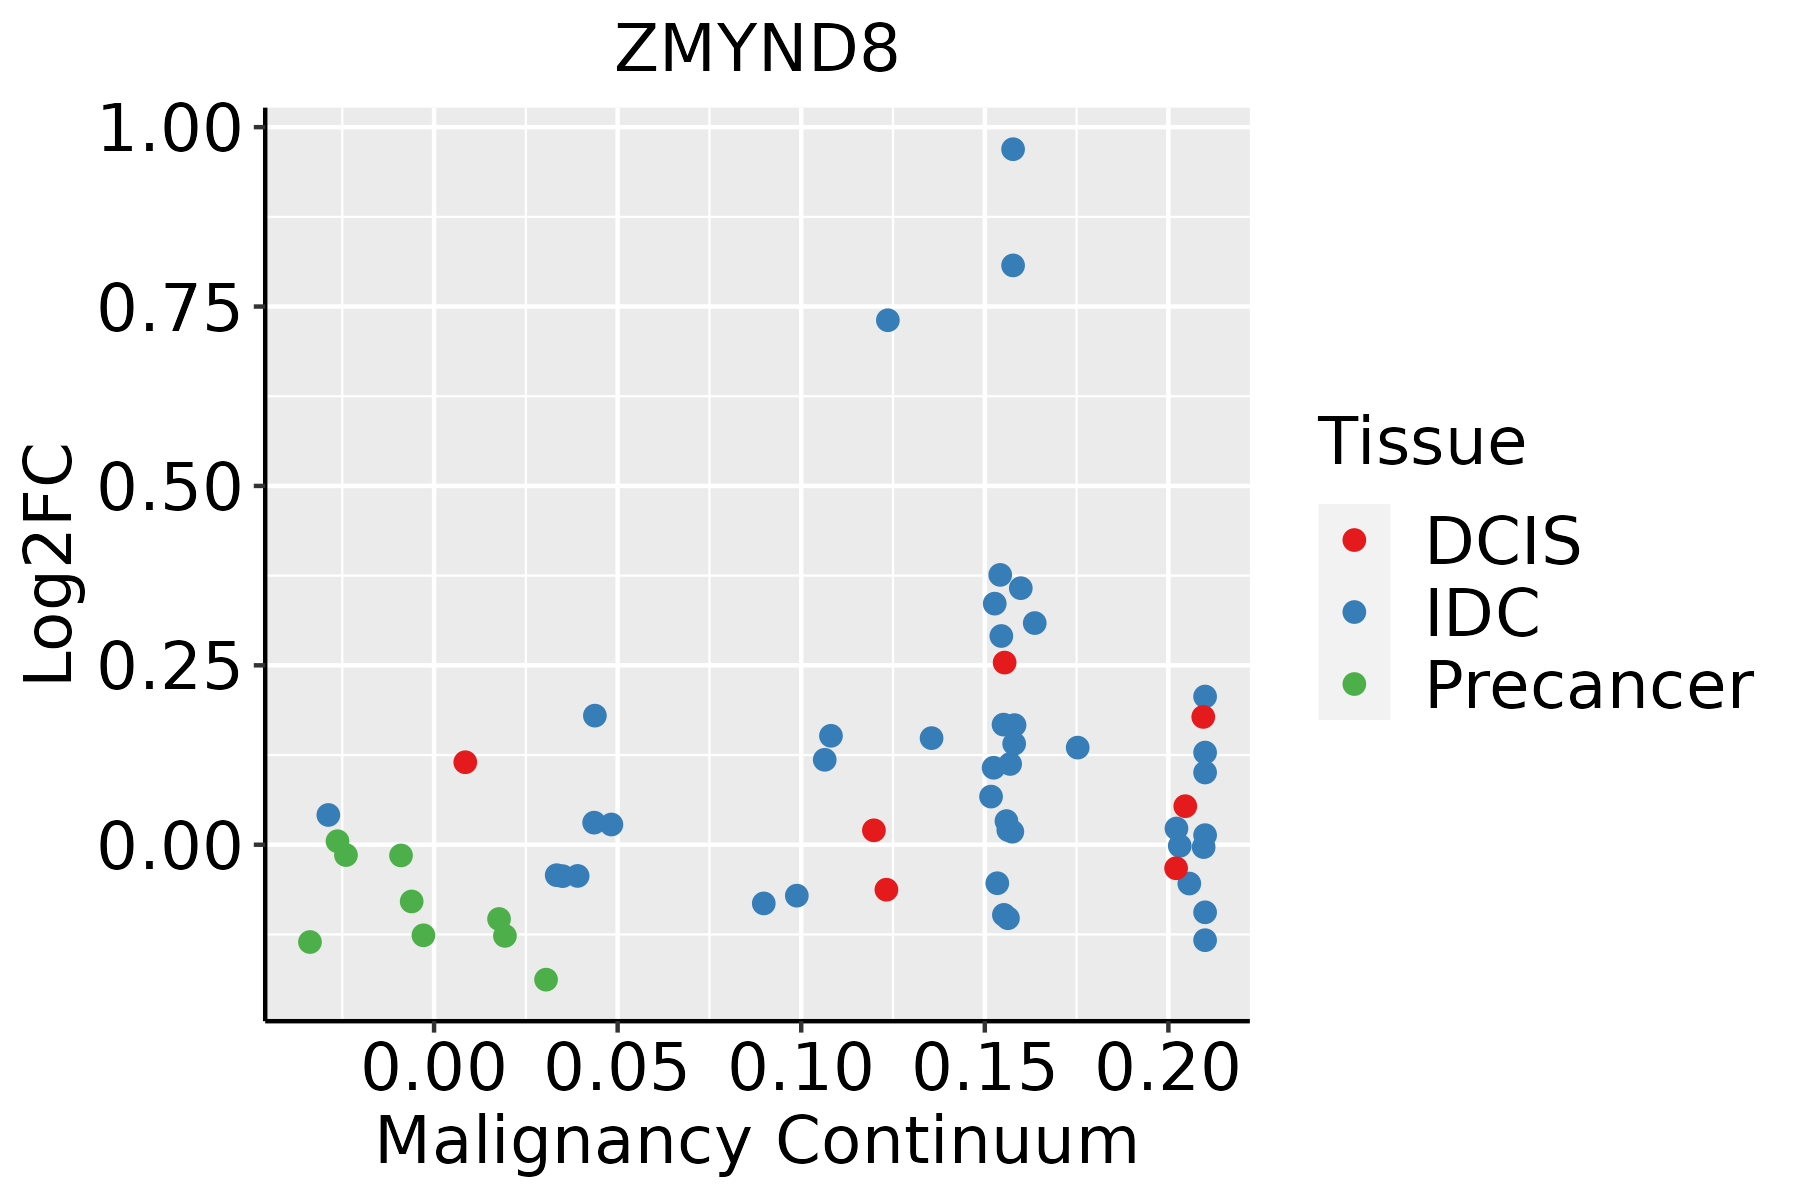
IDC: Invasive ductal carcinoma
DCIS: Ductal carcinoma in situ
Precancer(BRCA1-mut): Precancerous lesion from BRCA1 mutation carriers
Colorectum (GSE201348)The image shows the transcriptomic changes along malignancy continuum.log2FC in expression of this searched gene in stem-like cells from each diseased tissue sample relative to stem-like cells in normal samples in each tissue plotted against the malignancy continuum. Samples are colored based on if they are from different disease stage.FAP: Familial adenomatous polyposis
CRC: Colorectal cancer
Colorectum (HTA11)The image shows the transcriptomic changes along malignancy continuum.log2FC in expression of this searched gene in stem-like cells from each diseased tissue sample relative to stem-like cells in normal samples in each tissue plotted against the malignancy continuum. Samples are colored based on if they are from different disease stage.AD: Adenomas
SER: Sessile serrated lesions
MSI-H: Microsatellite-high colorectal cancer
MSS: Microsatellite stable colorectal cancer
EndometriumThe image shows the transcriptomic changes along malignancy continuum.log2FC in expression of this searched gene in stem-like cells from each diseased tissue sample relative to stem-like cells in normal samples in each tissue plotted against the malignancy continuum. Samples are colored based on if they are from different disease stage.
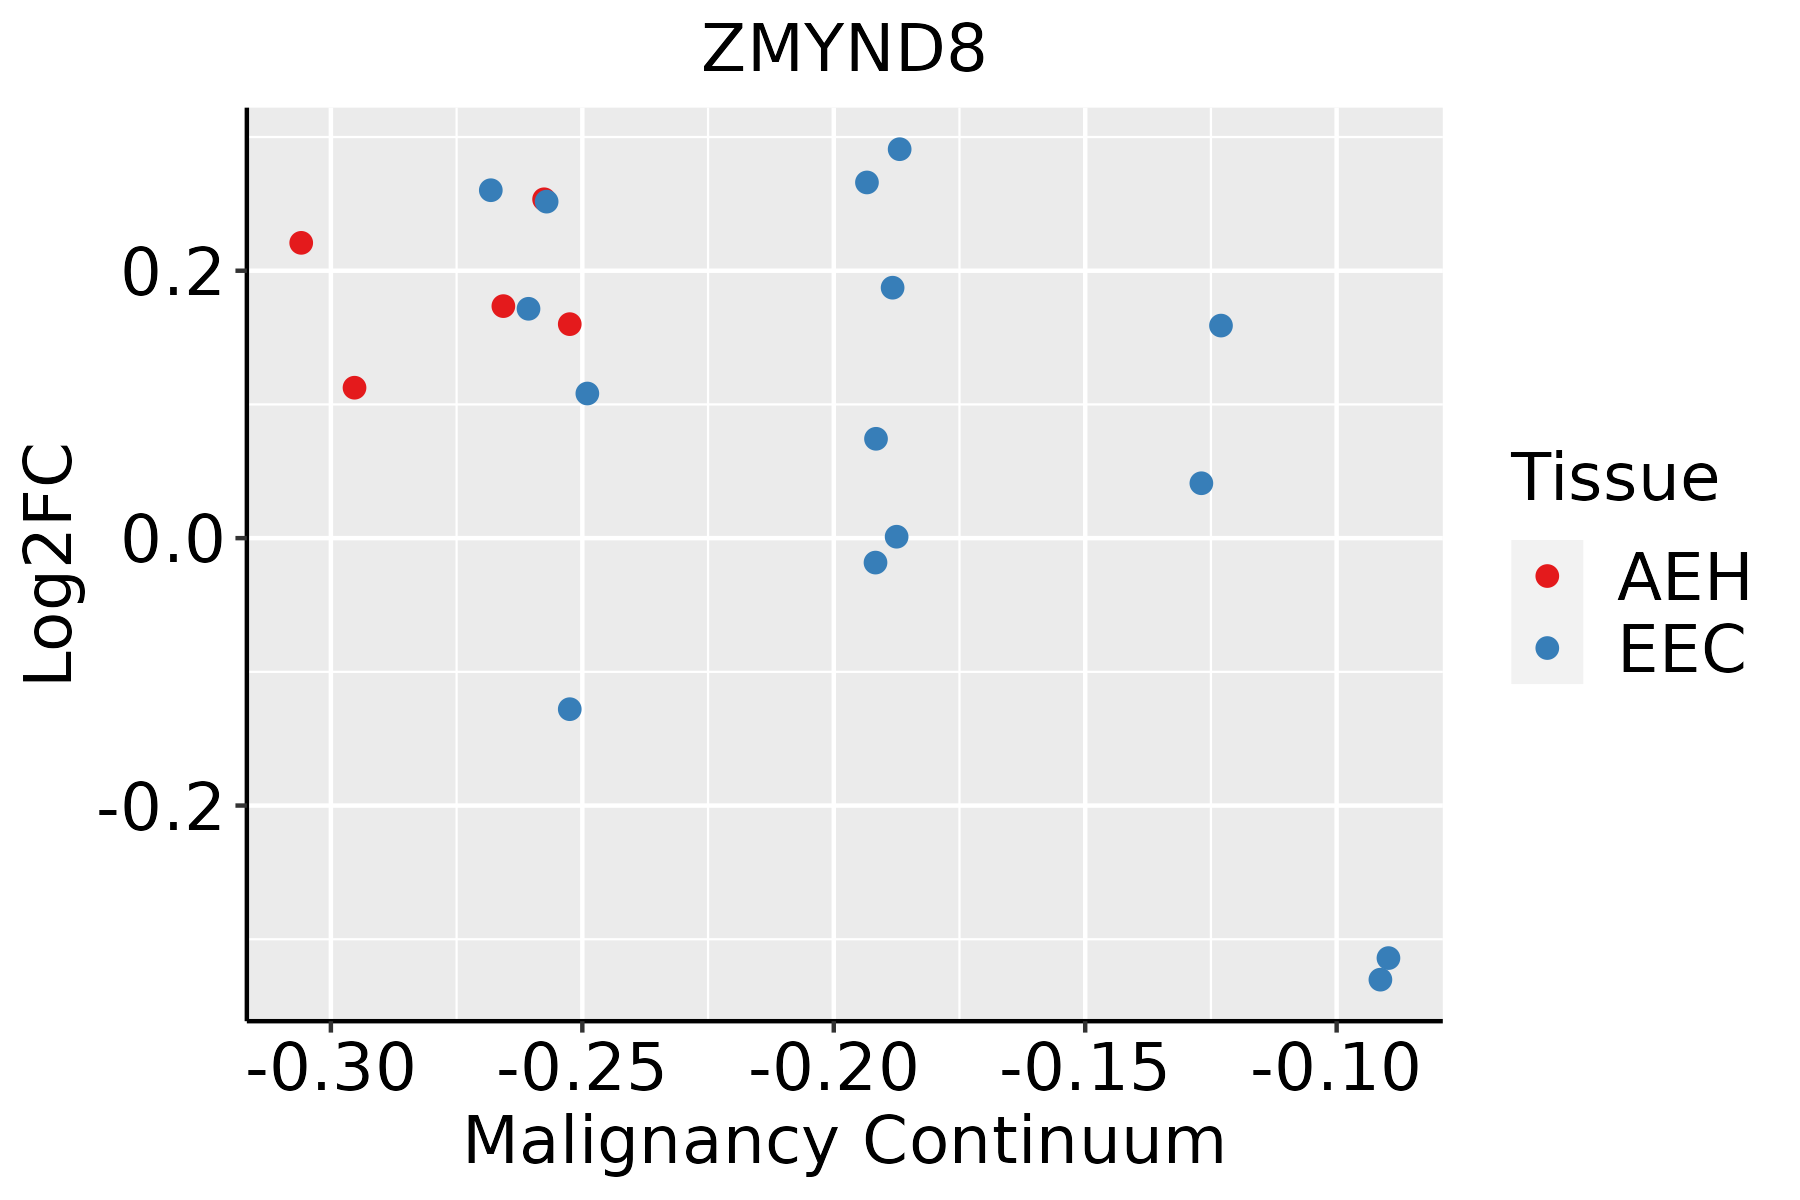
AEH: Atypical endometrial hyperplasia
EEC: Endometrioid Cancer
EsophagusThe image shows the transcriptomic changes along malignancy continuum.log2FC in expression of this searched gene in stem-like cells from each diseased tissue sample relative to stem-like cells in normal samples in each tissue plotted against the malignancy continuum. Samples are colored based on if they are from different disease stage.
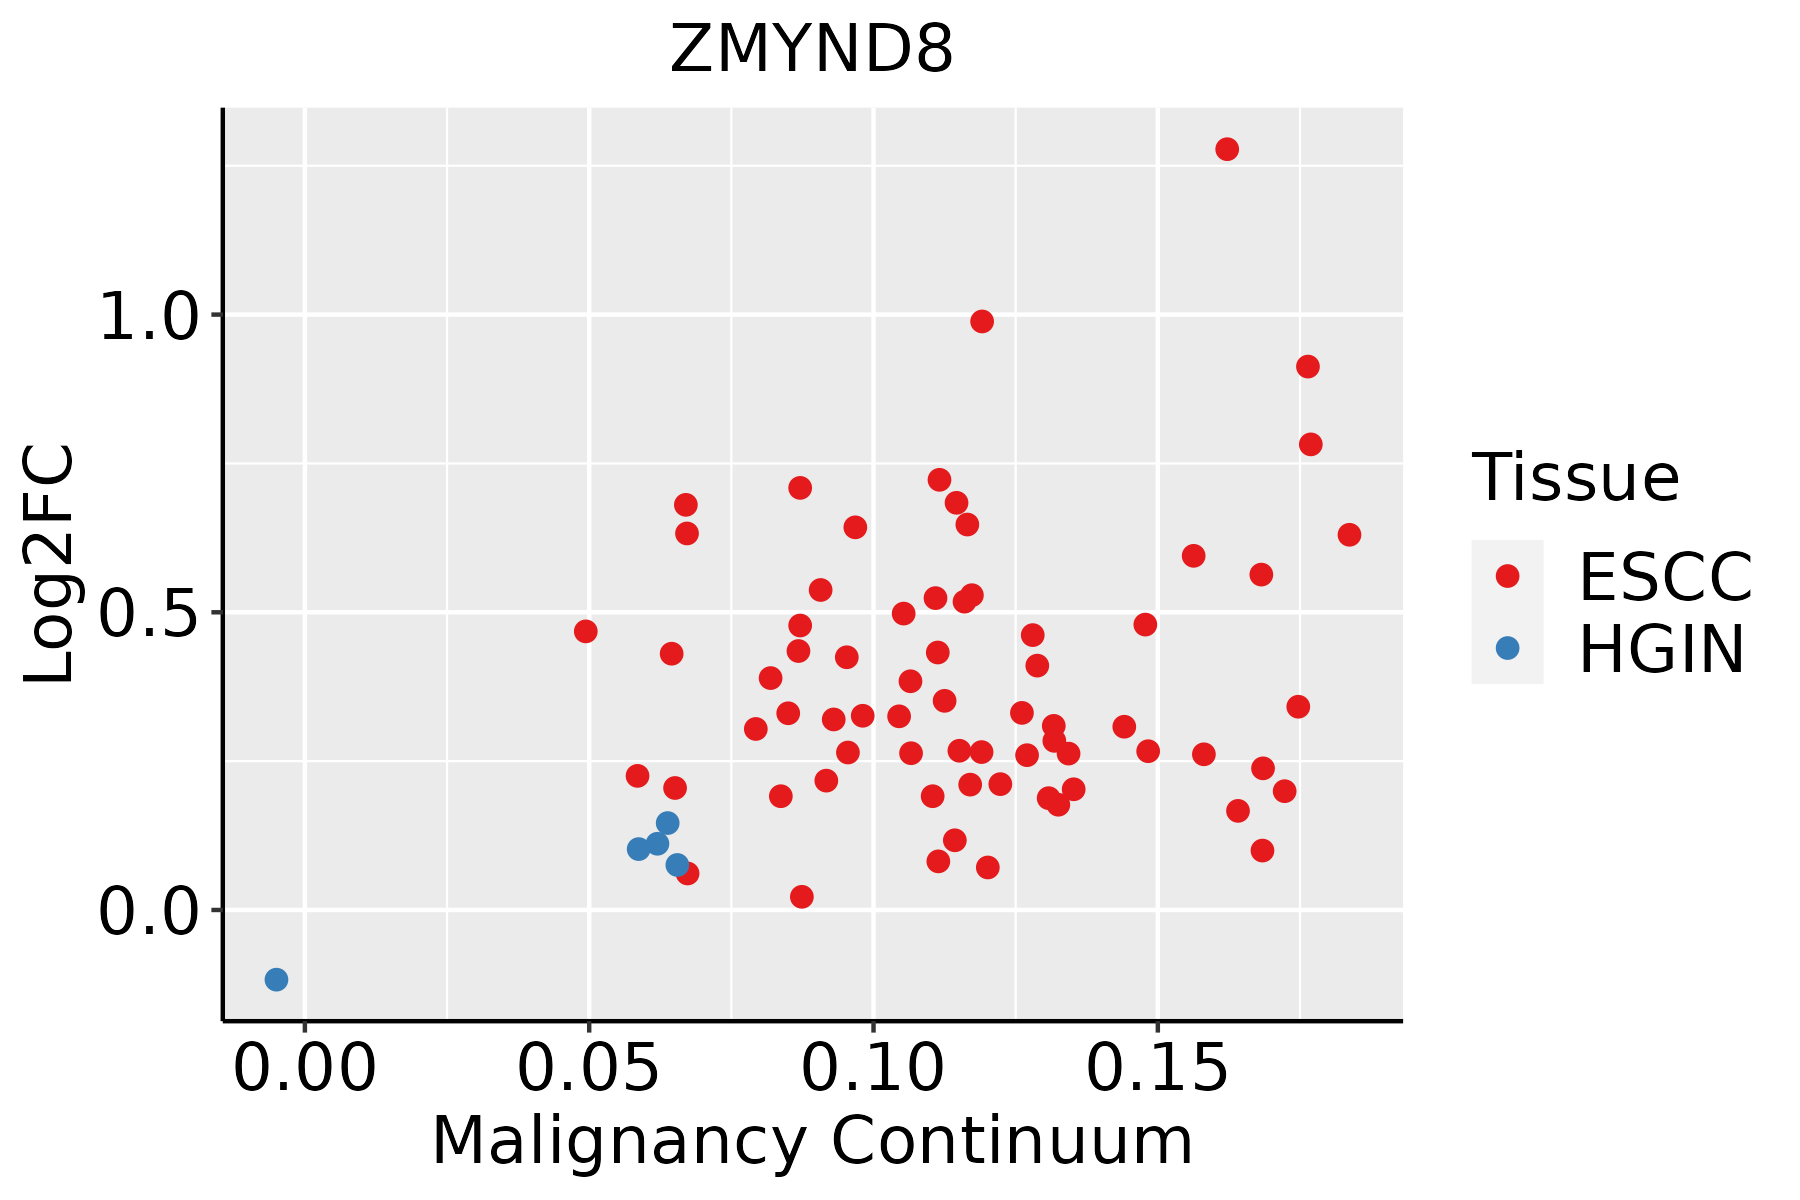
ESCC: Esophageal squamous cell carcinoma
HGIN: High-grade intraepithelial neoplasias
LGIN: Low-grade intraepithelial neoplasias
LiverThe image shows the transcriptomic changes along malignancy continuum.log2FC in expression of this searched gene in stem-like cells from each diseased tissue sample relative to stem-like cells in normal samples in each tissue plotted against the malignancy continuum. Samples are colored based on if they are from different disease stage.HCC: Hepatocellular carcinoma
NAFLD: Non-alcoholic fatty liver disease
LungThe image shows the transcriptomic changes along malignancy continuum.log2FC in expression of this searched gene in stem-like cells from each diseased tissue sample relative to stem-like cells in normal samples in each tissue plotted against the malignancy continuum. Samples are colored based on if they are from different disease stage.
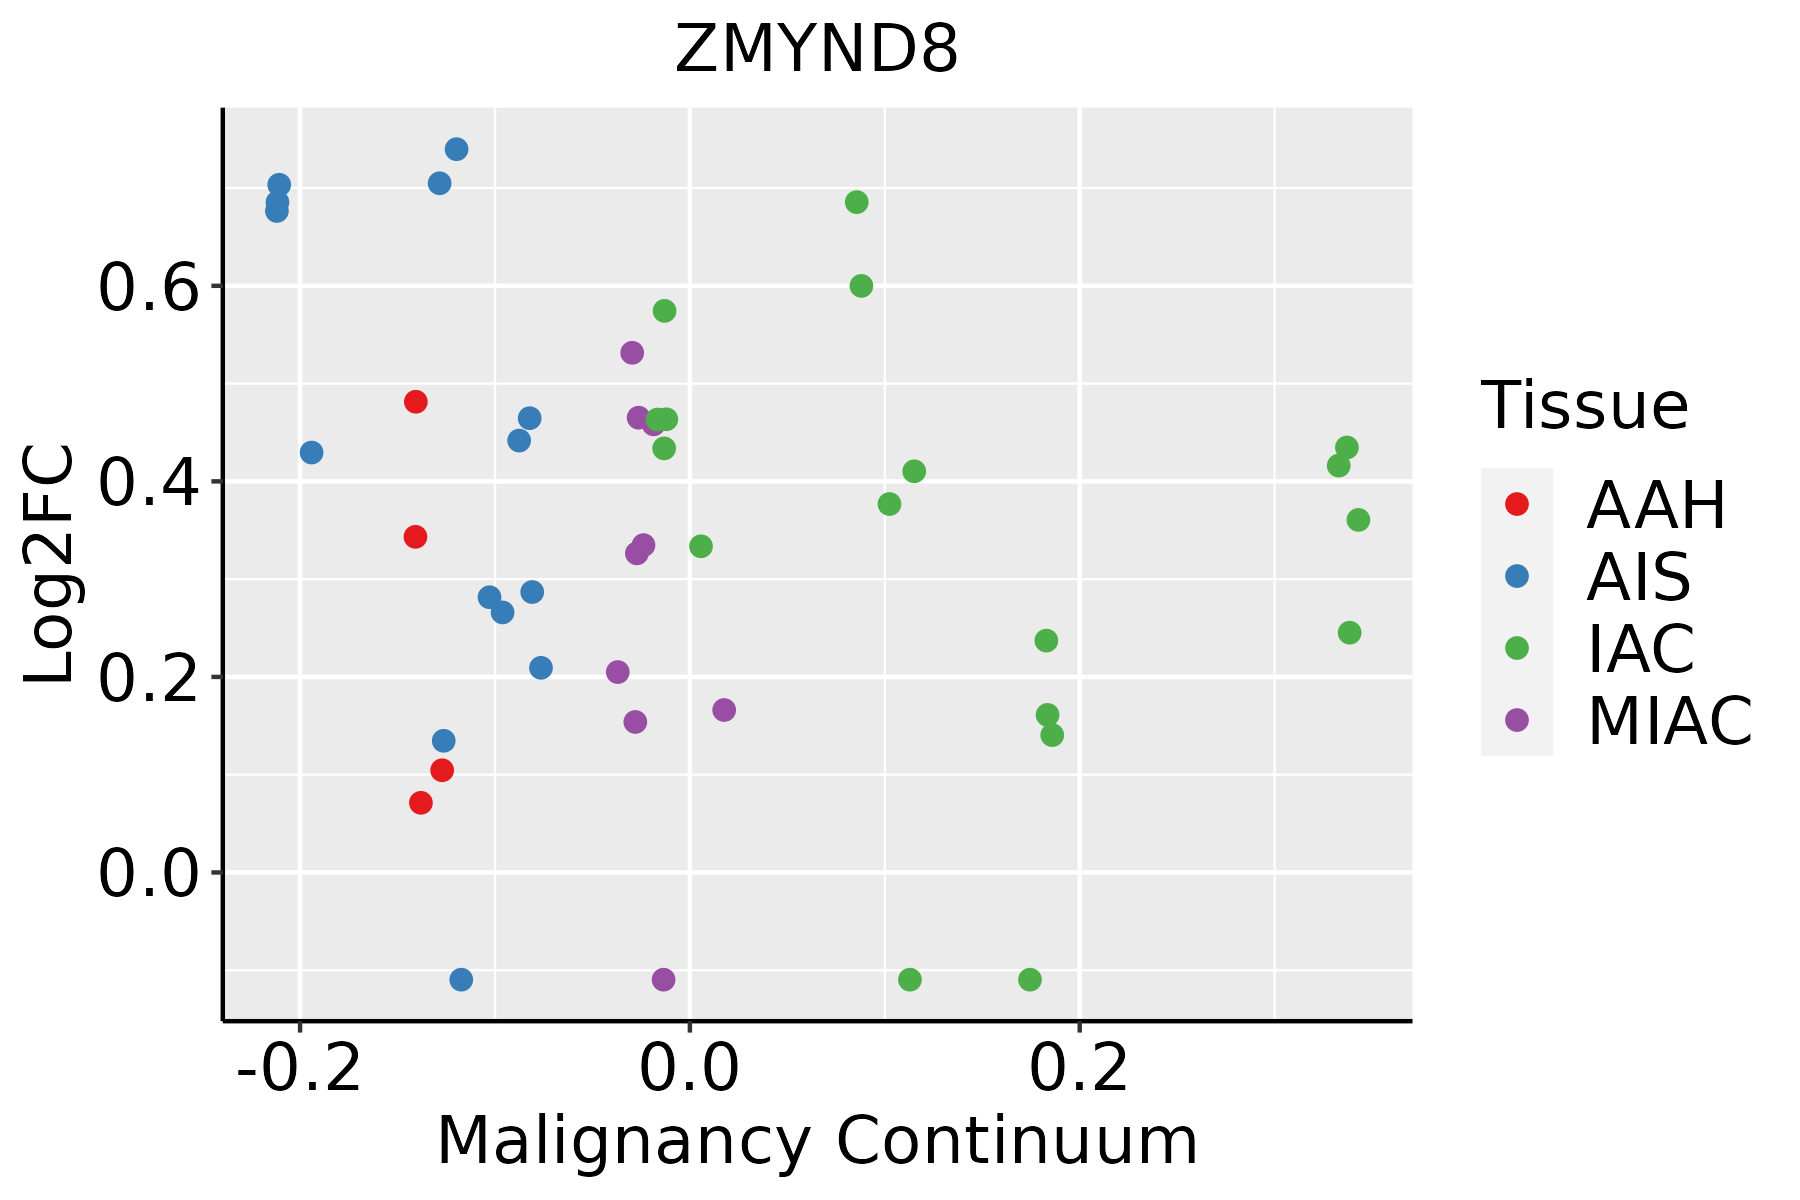
AAH: Atypical adenomatous hyperplasia
AIS: Adenocarcinoma in situ
IAC: Invasive lung adenocarcinoma
MIA: Minimally invasive adenocarcinoma
Oral CavityThe image shows the transcriptomic changes along malignancy continuum.log2FC in expression of this searched gene in stem-like cells from each diseased tissue sample relative to stem-like cells in normal samples in each tissue plotted against the malignancy continuum. Samples are colored based on if they are from different disease stage.
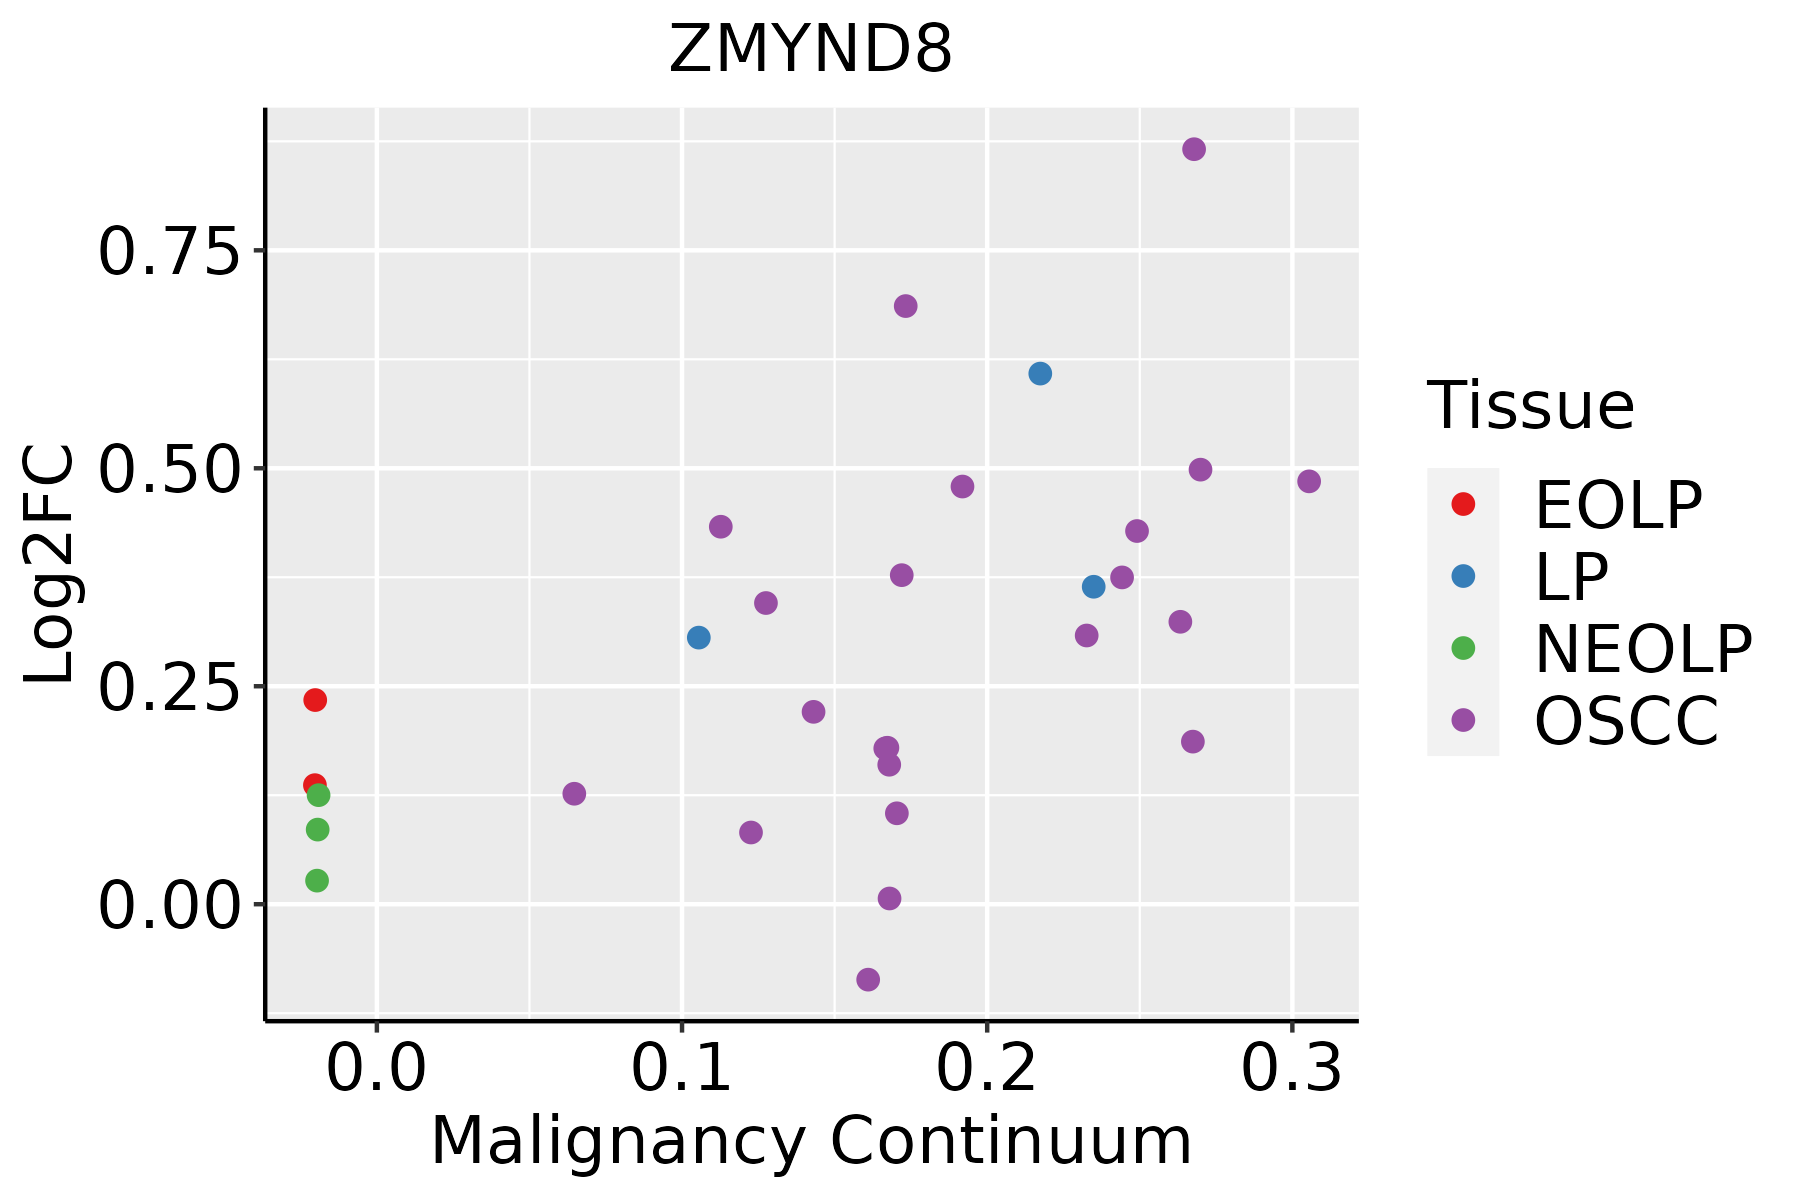
EOLP: Erosive Oral lichen planus
LP: leukoplakia
NEOLP: Non-erosive oral lichen planus
OSCC: Oral squamous cell carcinoma
ProstateThe image shows the transcriptomic changes along malignancy continuum.log2FC in expression of this searched gene in stem-like cells from each diseased tissue sample relative to stem-like cells in normal samples in each tissue plotted against the malignancy continuum. Samples are colored based on if they are from different disease stage.
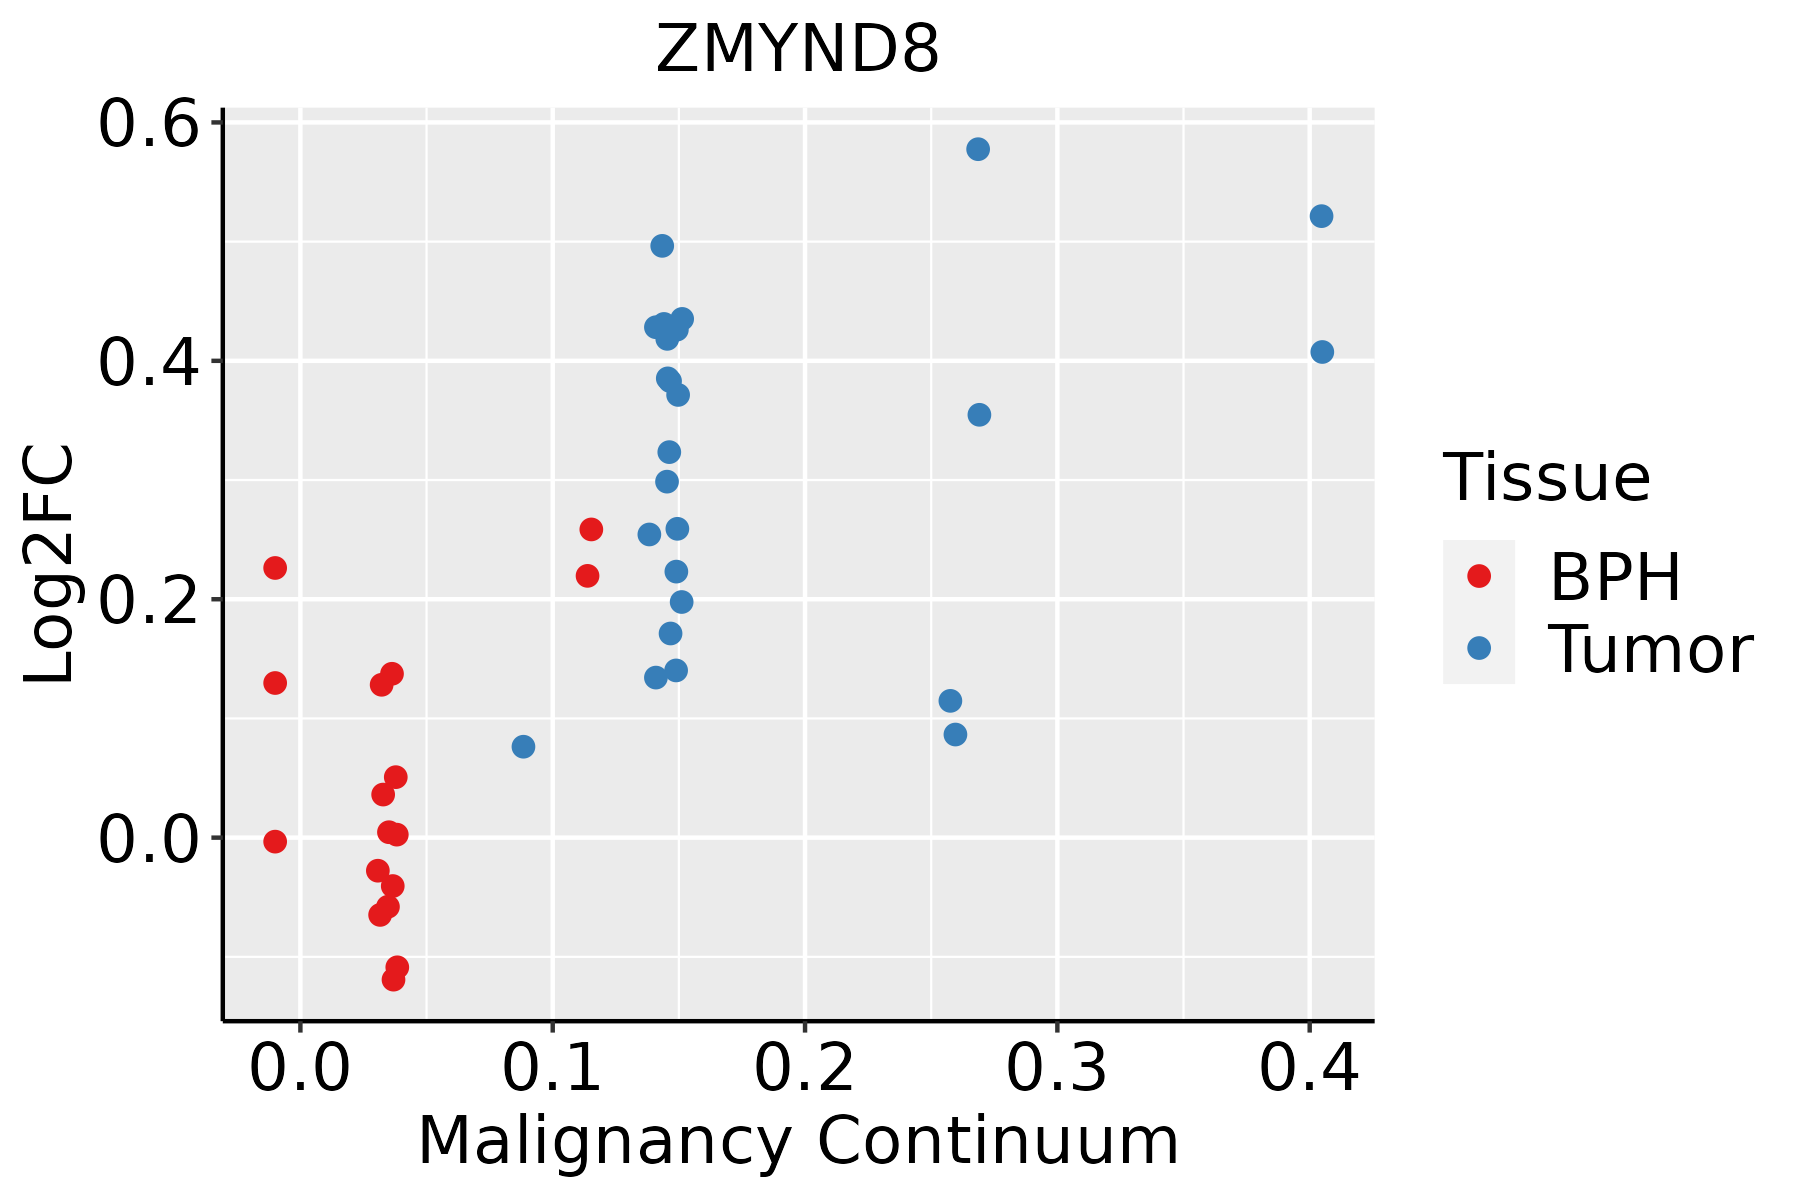
BPH: Benign Prostatic Hyperplasia
ThyroidThe image shows the transcriptomic changes along malignancy continuum.log2FC in expression of this searched gene in stem-like cells from each diseased tissue sample relative to stem-like cells in normal samples in each tissue plotted against the malignancy continuum. Samples are colored based on if they are from different disease stage.ATC: Anaplastic thyroid cancer
HT: Hashimoto's thyroiditis
PTC: Papillary thyroid cancer
∗log2FC in expression of this searched gene in stem-like cells from each diseased tissue sample relative to stem-like cells in normal samples in each tissue plotted against the malignancy continuum. Samples are colored based on if they are from different disease stage.

Top

Malignant transformation related pathway analysis

check buttonFind out the enriched GO biological processes and KEGG pathways involved in transition from healthy to precancer to cancer
check button Figure of enriched GO biological processes.
TissueDisease StageEnriched GO biological Processes
ColorectumADGO analysis - Figure of enriched GO biological processes: Top 15 enriched GO BP terms are showed in the bar plot of each disease state in each tissue. Each row represents a significant GO biological process which is colored according to the -log10(p.adjust).
ColorectumSERGO analysis - Figure of enriched GO biological processes: Top 15 enriched GO BP terms are showed in the bar plot of each disease state in each tissue. Each row represents a significant GO biological process which is colored according to the -log10(p.adjust).
ColorectumMSSGO analysis - Figure of enriched GO biological processes: Top 15 enriched GO BP terms are showed in the bar plot of each disease state in each tissue. Each row represents a significant GO biological process which is colored according to the -log10(p.adjust).
ColorectumMSI-HGO analysis - Figure of enriched GO biological processes: Top 15 enriched GO BP terms are showed in the bar plot of each disease state in each tissue. Each row represents a significant GO biological process which is colored according to the -log10(p.adjust).
ColorectumFAPGO analysis - Figure of enriched GO biological processes: Top 15 enriched GO BP terms are showed in the bar plot of each disease state in each tissue. Each row represents a significant GO biological process which is colored according to the -log10(p.adjust).
∗Top 15 enriched GO BP terms are showed in the bar plot of each disease state in each tissue. Each row represents a significant GO biological process which is colored according to the -log10(p.adjust).
Page: 1 2 3 4 5 6 7 8 9 

check button Enriched GO biological processes.
GO IDTissueDisease StageDescriptionGene RatioBg Ratiopvaluep.adjustCount
GO:190547513BreastIDCregulation of protein localization to membrane28/1434175/187231.56e-042.71e-0328
GO:00512712BreastIDCnegative regulation of cellular component movement48/1434367/187231.88e-043.12e-0348
GO:20001462BreastIDCnegative regulation of cell motility46/1434359/187234.01e-045.60e-0346
GO:00303362BreastIDCnegative regulation of cell migration43/1434344/187231.01e-031.13e-0243
GO:00400132BreastIDCnegative regulation of locomotion47/1434391/187231.39e-031.43e-0247
GO:00423912BreastIDCregulation of membrane potential49/1434434/187234.04e-033.25e-0249
GO:005127111BreastDCISnegative regulation of cellular component movement48/1390367/187238.97e-051.69e-0348
GO:200014611BreastDCISnegative regulation of cell motility46/1390359/187232.01e-043.23e-0346
GO:190547522BreastDCISregulation of protein localization to membrane26/1390175/187235.31e-046.88e-0326
GO:003033611BreastDCISnegative regulation of cell migration43/1390344/187235.41e-046.96e-0343
GO:004001311BreastDCISnegative regulation of locomotion47/1390391/187237.30e-048.69e-0347
GO:00423911BreastDCISregulation of membrane potential47/1390434/187235.87e-034.20e-0247
GO:1905475ColorectumADregulation of protein localization to membrane73/3918175/187233.37e-102.93e-0873
GO:0106027ColorectumADneuron projection organization36/391893/187236.58e-051.07e-0336
GO:0031346ColorectumADpositive regulation of cell projection organization104/3918353/187238.26e-051.30e-03104
GO:0043954ColorectumADcellular component maintenance26/391861/187231.04e-041.56e-0326
GO:0097061ColorectumADdendritic spine organization31/391884/187235.48e-045.83e-0331
GO:0099173ColorectumADpostsynapse organization51/3918168/187232.47e-031.90e-0251
GO:0016358ColorectumADdendrite development69/3918243/187233.32e-032.42e-0269
GO:0050808ColorectumADsynapse organization112/3918426/187234.25e-032.92e-02112
Page: 1 2 3 4 5 6 7 8 9 10 11 12 13 14 

check button Enriched KEGG pathways.
Pathway IDTissueDisease StageDescriptionGene RatioBg Ratiopvaluep.adjustqvalueCount
Page: 1 

Top

Cell-cell communication analysis

check buttonIdentification of potential cell-cell interactions between two cell types and their ligand-receptor pairs for different disease states
LigandReceptorLRpairPathwayTissueDisease Stage
Page: 1 

Top

Single-cell gene regulatory network inference analysis

check buttonFind out the significant the regulons (TFs) and the target genes of each regulon across cell types for different disease states
TFCell TypeTissueDisease StageTarget GeneRSSRegulon Activity
∗The dot plots of a searched regulon are shown for all cell subpopulations in each disease state of each tissue based on the regulon specific score inferred using pySCENIC and by calculating the average expression.
Page: 1 

Top

Somatic mutation of malignant transformation related genes

check buttonAnnotation of somatic variants for genes involved in malignant transformation
Hugo SymbolVariant ClassVariant ClassificationdbSNP RSHGVScHGVSpHGVSp ShortSWISSPROTBIOTYPESIFTPolyPhenTumor Sample BarcodeTissueHistologySexAgeStageTherapy TypesDrugsOutcome
ZMYND8SNVMissense_Mutationc.2435N>Tp.Pro812Leup.P812LQ9ULU4protein_codingdeleterious_low_confidence(0.02)benign(0.046)TCGA-A2-A0EV-01Breastbreast invasive carcinomaFemale>=65I/IIUnknownUnknownSD
ZMYND8SNVMissense_Mutationc.2783C>Tp.Ser928Leup.S928LQ9ULU4protein_codingtolerated(0.11)benign(0)TCGA-AC-A23H-01Breastbreast invasive carcinomaFemale>=65I/IIUnknownUnknownPD
ZMYND8SNVMissense_Mutationc.1693C>Tp.Leu565Phep.L565FQ9ULU4protein_codingdeleterious_low_confidence(0)probably_damaging(0.975)TCGA-AC-A23H-01Breastbreast invasive carcinomaFemale>=65I/IIUnknownUnknownPD
ZMYND8SNVMissense_Mutationnovelc.1625N>Ap.Arg542Glnp.R542QQ9ULU4protein_codingdeleterious_low_confidence(0)probably_damaging(0.999)TCGA-AN-A046-01Breastbreast invasive carcinomaFemale>=65I/IIUnknownUnknownSD
ZMYND8SNVMissense_Mutationnovelc.119N>Tp.Arg40Ilep.R40IQ9ULU4protein_codingdeleterious_low_confidence(0)probably_damaging(0.999)TCGA-AN-A046-01Breastbreast invasive carcinomaFemale>=65I/IIUnknownUnknownSD
ZMYND8SNVMissense_Mutationrs767210378c.2363N>Tp.Ala788Valp.A788VQ9ULU4protein_codingtolerated_low_confidence(0.08)benign(0.087)TCGA-AN-A0AK-01Breastbreast invasive carcinomaFemale>=65I/IIUnknownUnknownSD
ZMYND8SNVMissense_Mutationnovelc.1949C>Gp.Ser650Cysp.S650CQ9ULU4protein_codingtolerated_low_confidence(0.09)possibly_damaging(0.547)TCGA-BH-A28O-01Breastbreast invasive carcinomaFemale<65III/IVChemotherapycytoxanCR
ZMYND8SNVMissense_Mutationrs143023321c.1568N>Tp.Thr523Metp.T523MQ9ULU4protein_codingtolerated_low_confidence(0.28)benign(0.005)TCGA-C8-A26Y-01Breastbreast invasive carcinomaFemale>=65I/IIUnknownUnknownSD
ZMYND8SNVMissense_Mutationc.2998N>Ap.Glu1000Lysp.E1000KQ9ULU4protein_codingtolerated(0.07)probably_damaging(0.998)TCGA-EW-A1IZ-01Breastbreast invasive carcinomaFemale<65III/IVChemotherapytaxotereSD
ZMYND8SNVMissense_Mutationc.1542C>Gp.Phe514Leup.F514LQ9ULU4protein_codingtolerated_low_confidence(0.2)benign(0.061)TCGA-GM-A2D9-01Breastbreast invasive carcinomaFemale>=65I/IIHormone TherapyarimidexSD
Page: 1 2 3 4 5 6 7 8 9 10 11 12 13 14 15 16 17 

Top

Related drugs of malignant transformation related genes

check buttonIdentification of chemicals and drugs interact with genes involved in malignant transfromation
(DGIdb 4.0)
Entrez IDSymbolCategoryInteraction TypesDrug Claim NameDrug NamePMIDs
Page: 1