
|
|||||
|
 | |
| |
| |
| |
| |
| |
|
Gene: WIPF2 |
Gene summary for WIPF2 |
| Gene information | Species | Human | Gene symbol | WIPF2 | Gene ID | 147179 |
| Gene name | WAS/WASL interacting protein family member 2 | |
| Gene Alias | WICH | |
| Cytomap | 17q21.2 | |
| Gene Type | protein-coding | GO ID | GO:0006928 | UniProtAcc | Q8TF74 |
Top |
Malignant transformation analysis |
| Identification of the aberrant gene expression in precancerous and cancerous lesions by comparing the gene expression of stem-like cells in diseased tissues with normal stem cells |
| Entrez ID | Symbol | Replicates | Species | Organ | Tissue | Adj P-value | Log2FC | Malignancy |
| 147179 | WIPF2 | SYSMH2 | Human | Oral cavity | OSCC | 2.40e-09 | 2.84e-01 | 0.2326 |
| 147179 | WIPF2 | SYSMH3 | Human | Oral cavity | OSCC | 1.46e-18 | 4.30e-01 | 0.2442 |
| 147179 | WIPF2 | SYSMH5 | Human | Oral cavity | OSCC | 2.74e-07 | 2.26e-01 | 0.0647 |
| 147179 | WIPF2 | SYSMH6 | Human | Oral cavity | OSCC | 1.21e-05 | 1.90e-01 | 0.1275 |
| 147179 | WIPF2 | P4_S8_cSCC | Human | Skin | cSCC | 4.44e-06 | 1.97e-01 | -0.3095 |
| 147179 | WIPF2 | P1_cSCC | Human | Skin | cSCC | 2.88e-21 | 6.63e-01 | 0.0292 |
| 147179 | WIPF2 | P2_cSCC | Human | Skin | cSCC | 2.89e-06 | 3.08e-01 | -0.024 |
| 147179 | WIPF2 | P4_cSCC | Human | Skin | cSCC | 1.62e-04 | 2.72e-01 | -0.00290000000000005 |
| 147179 | WIPF2 | P10_cSCC | Human | Skin | cSCC | 4.01e-05 | 3.04e-01 | 0.1017 |
| 147179 | WIPF2 | male-WTA | Human | Thyroid | PTC | 7.38e-39 | 3.42e-01 | 0.1037 |
| 147179 | WIPF2 | PTC01 | Human | Thyroid | PTC | 2.71e-18 | 2.10e-01 | 0.1899 |
| 147179 | WIPF2 | PTC04 | Human | Thyroid | PTC | 1.43e-14 | 2.34e-01 | 0.1927 |
| 147179 | WIPF2 | PTC05 | Human | Thyroid | PTC | 1.83e-11 | 5.29e-01 | 0.2065 |
| 147179 | WIPF2 | PTC06 | Human | Thyroid | PTC | 9.84e-28 | 5.72e-01 | 0.2057 |
| 147179 | WIPF2 | PTC07 | Human | Thyroid | PTC | 6.54e-23 | 3.21e-01 | 0.2044 |
| 147179 | WIPF2 | ATC09 | Human | Thyroid | ATC | 1.60e-06 | 1.45e-01 | 0.2871 |
| 147179 | WIPF2 | ATC12 | Human | Thyroid | ATC | 1.57e-13 | 6.04e-02 | 0.34 |
| 147179 | WIPF2 | ATC13 | Human | Thyroid | ATC | 5.84e-24 | 2.02e-01 | 0.34 |
| 147179 | WIPF2 | ATC1 | Human | Thyroid | ATC | 1.30e-06 | 1.77e-01 | 0.2878 |
| 147179 | WIPF2 | ATC2 | Human | Thyroid | ATC | 4.04e-05 | 3.56e-01 | 0.34 |
| Page: 1 2 3 4 5 6 7 8 9 |
| Tissue | Expression Dynamics | Abbreviation |
| Breast |  | IDC: Invasive ductal carcinoma |
| DCIS: Ductal carcinoma in situ | ||
| Precancer(BRCA1-mut): Precancerous lesion from BRCA1 mutation carriers | ||
| Colorectum (GSE201348) |  | FAP: Familial adenomatous polyposis |
| CRC: Colorectal cancer | ||
| Colorectum (HTA11) |  | AD: Adenomas |
| SER: Sessile serrated lesions | ||
| MSI-H: Microsatellite-high colorectal cancer | ||
| MSS: Microsatellite stable colorectal cancer | ||
| Esophagus | 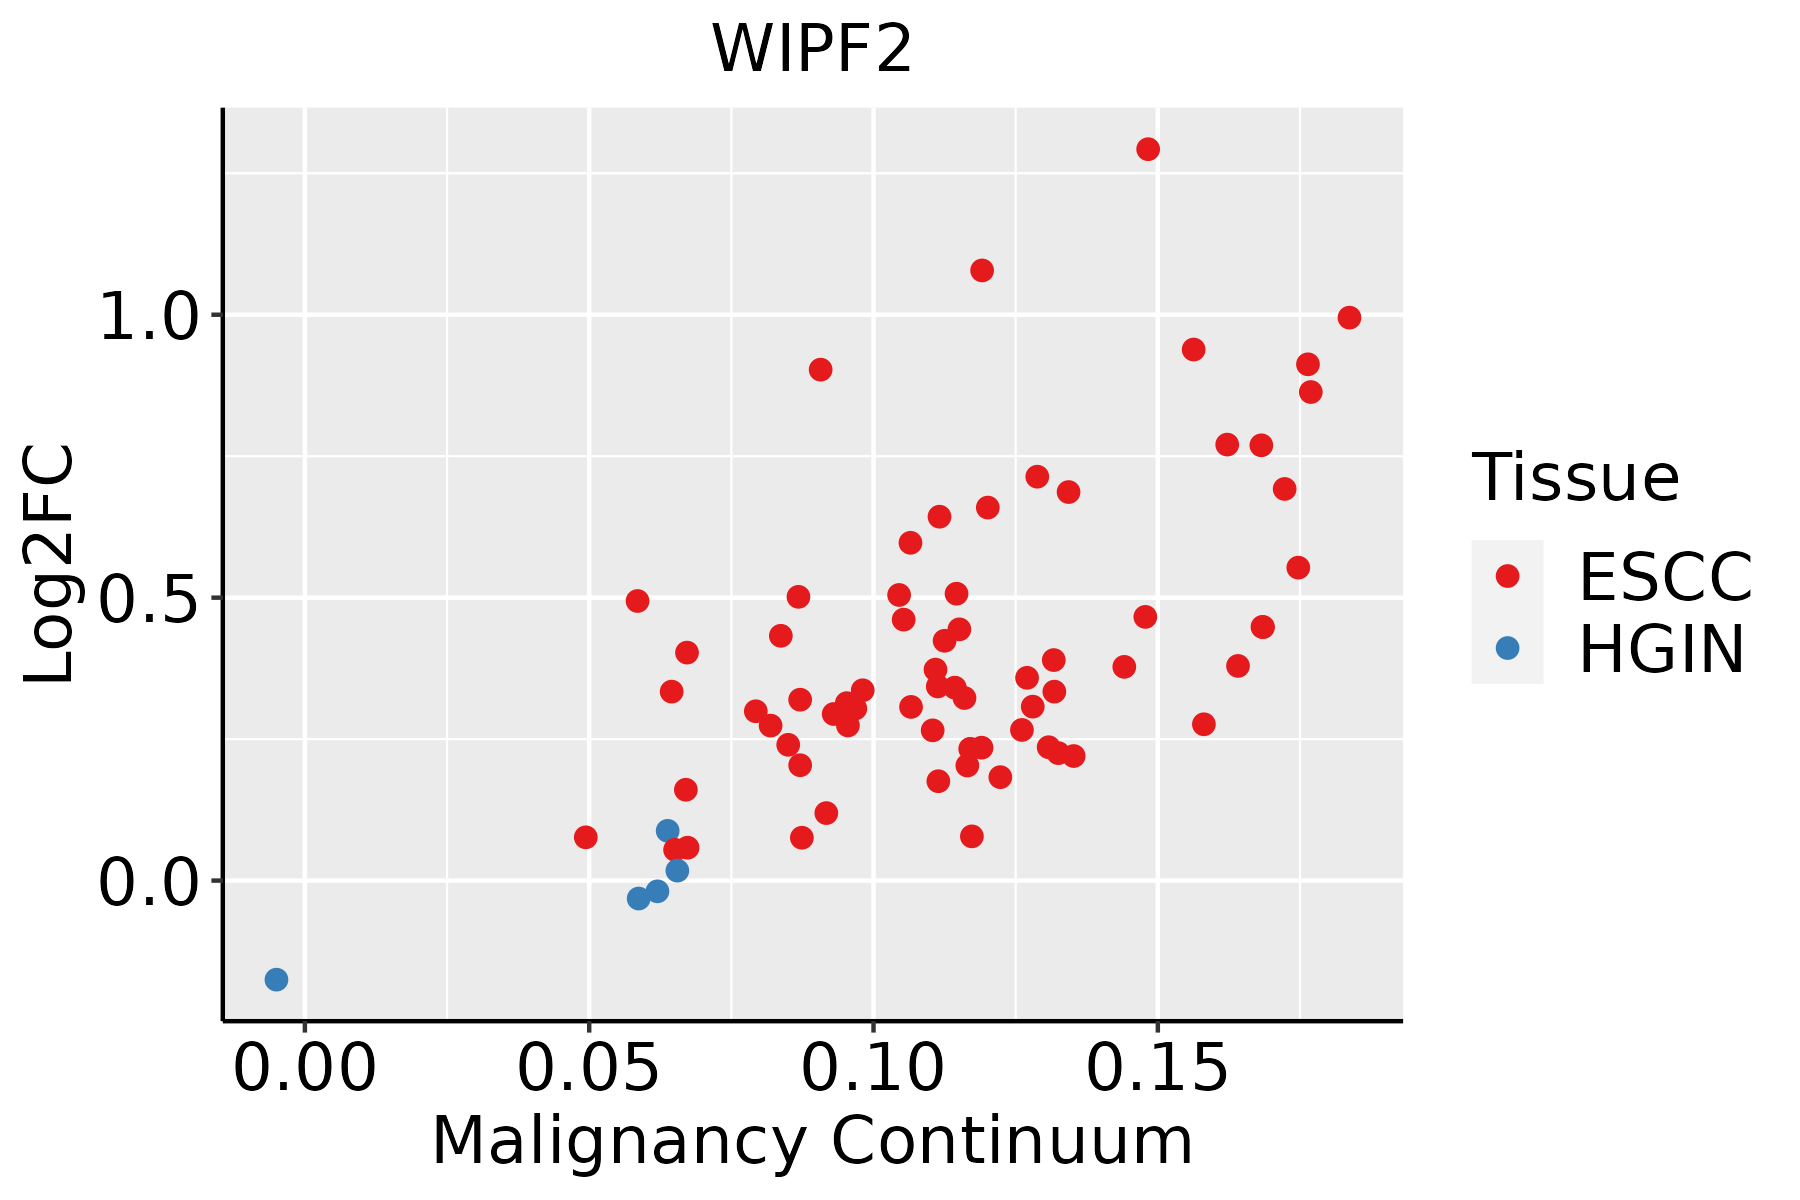 | ESCC: Esophageal squamous cell carcinoma |
| HGIN: High-grade intraepithelial neoplasias | ||
| LGIN: Low-grade intraepithelial neoplasias | ||
| Liver | 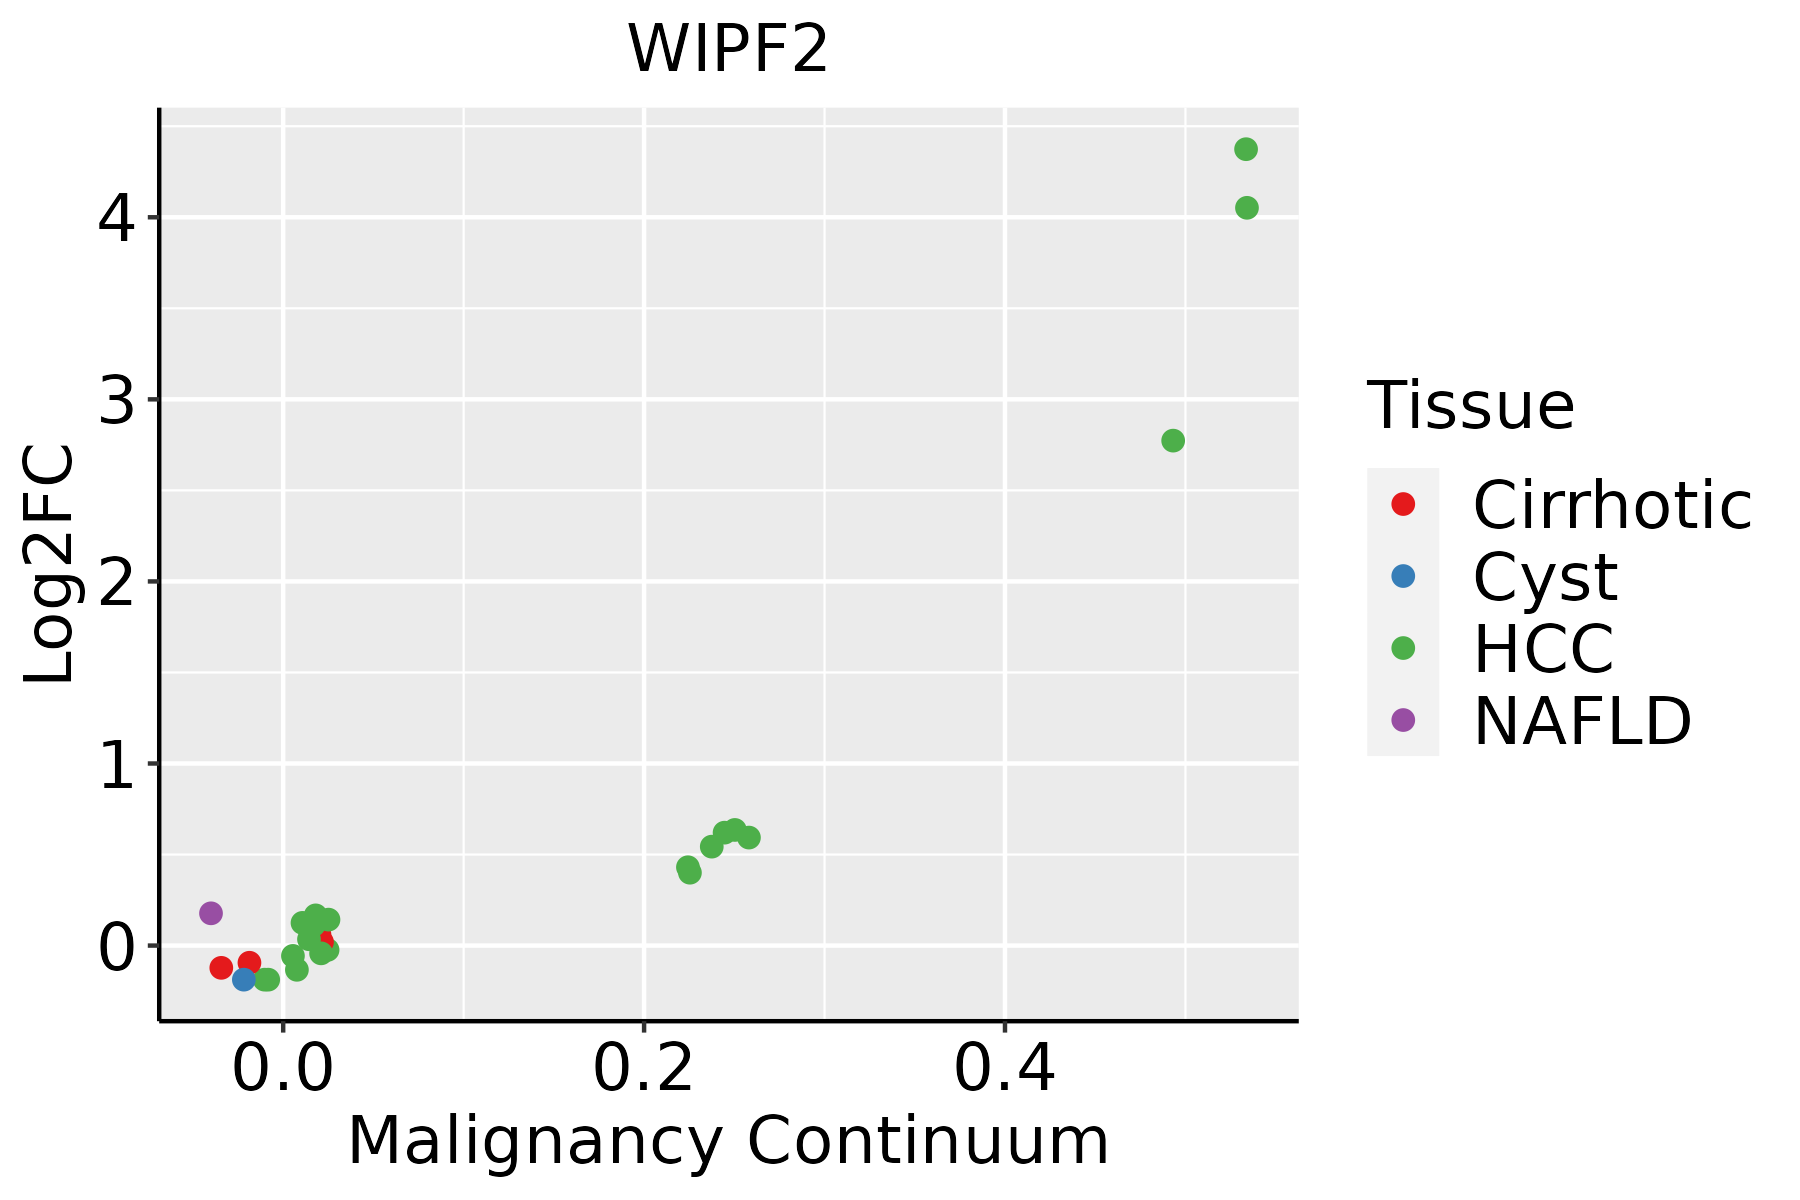 | HCC: Hepatocellular carcinoma |
| NAFLD: Non-alcoholic fatty liver disease | ||
| Oral Cavity | 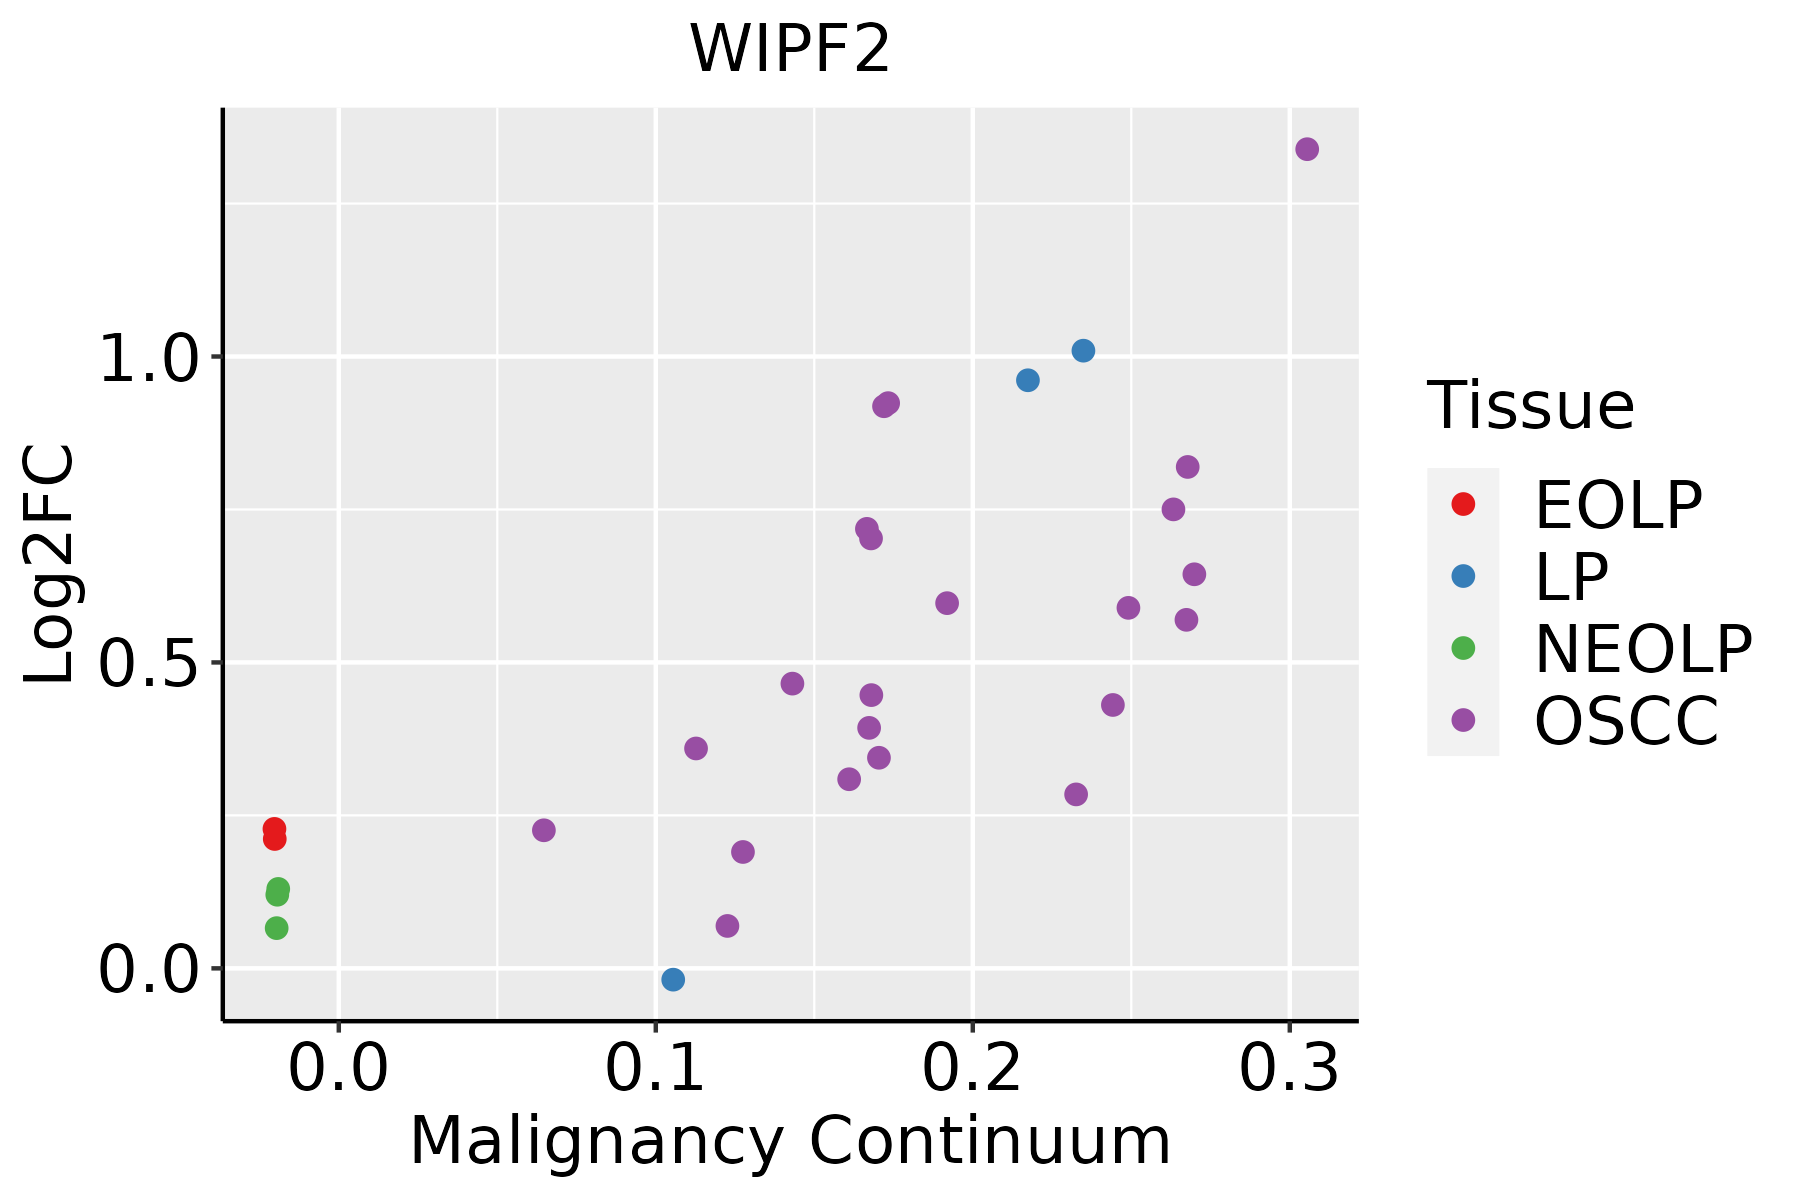 | EOLP: Erosive Oral lichen planus |
| LP: leukoplakia | ||
| NEOLP: Non-erosive oral lichen planus | ||
| OSCC: Oral squamous cell carcinoma | ||
| Skin | 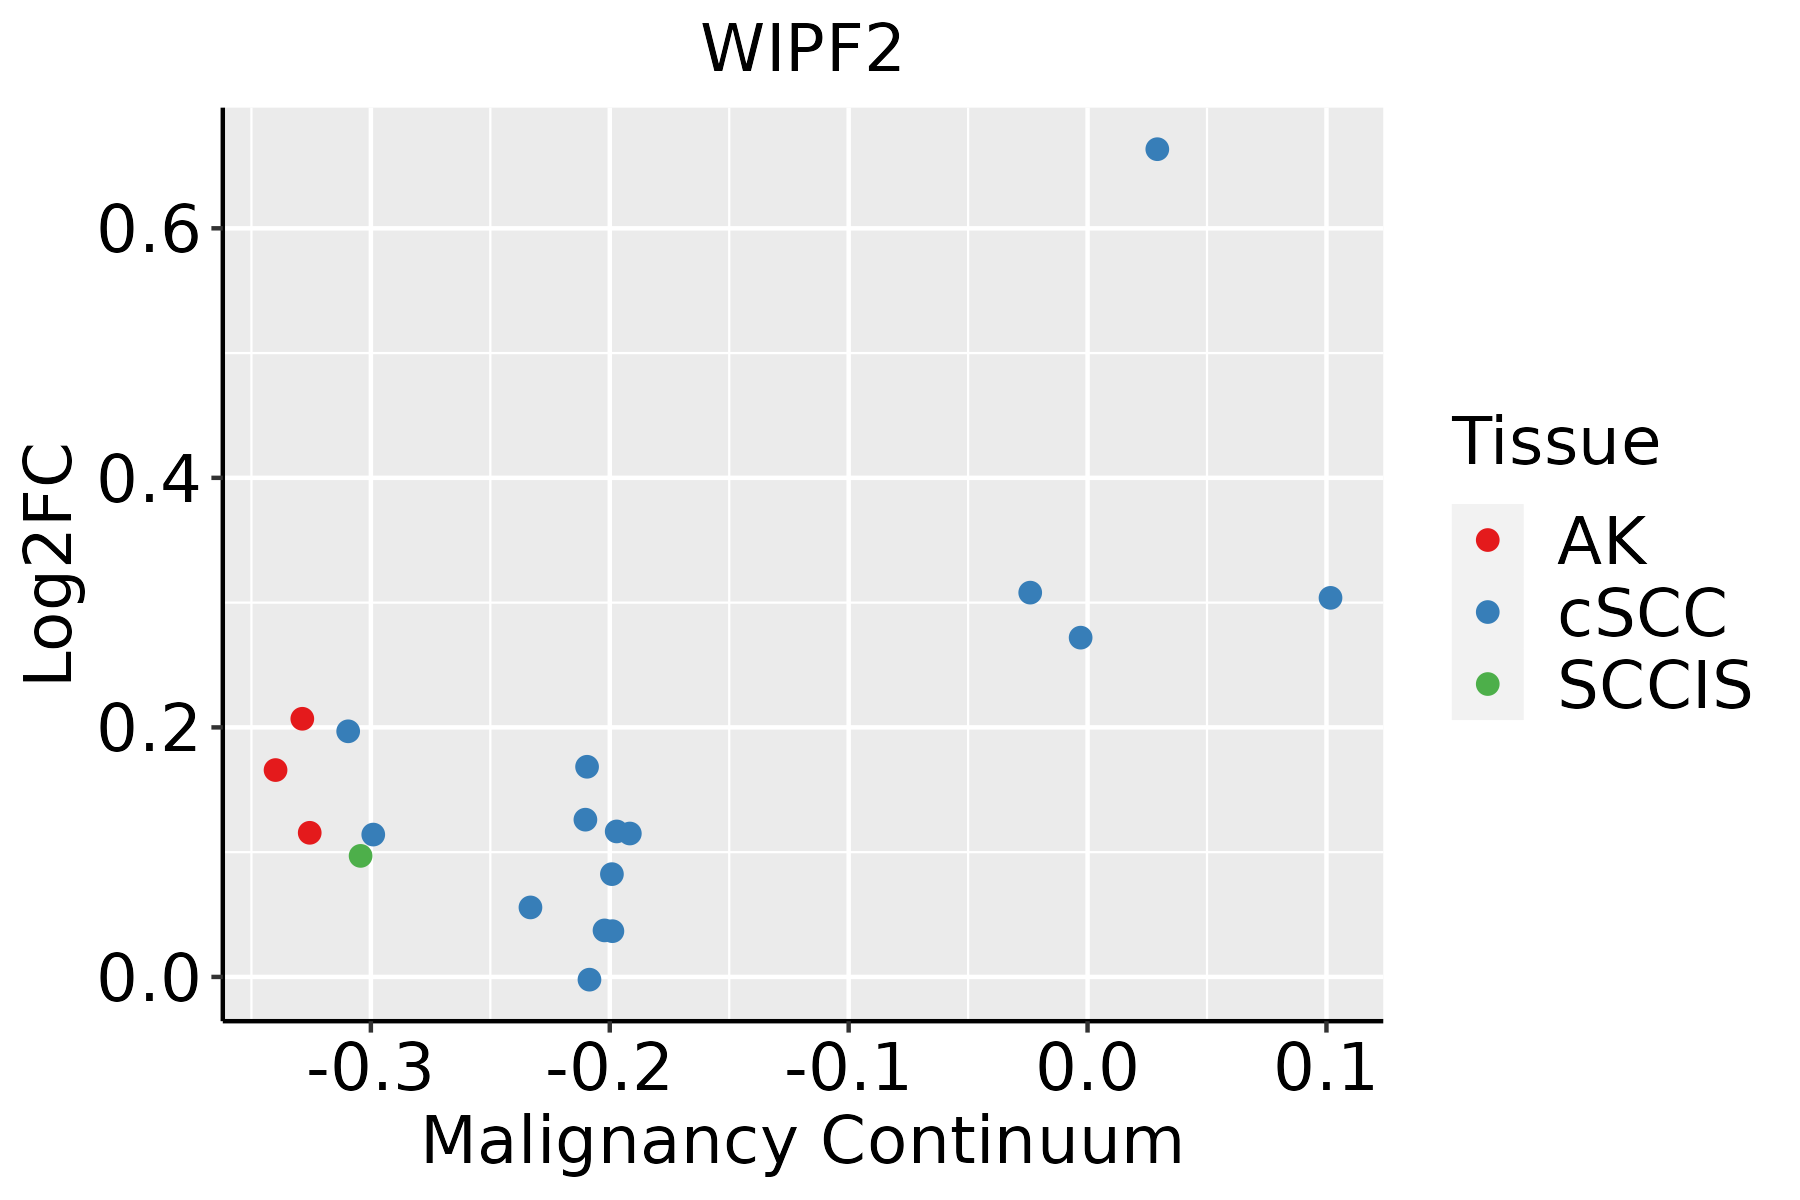 | AK: Actinic keratosis |
| cSCC: Cutaneous squamous cell carcinoma | ||
| SCCIS:squamous cell carcinoma in situ | ||
| Thyroid | 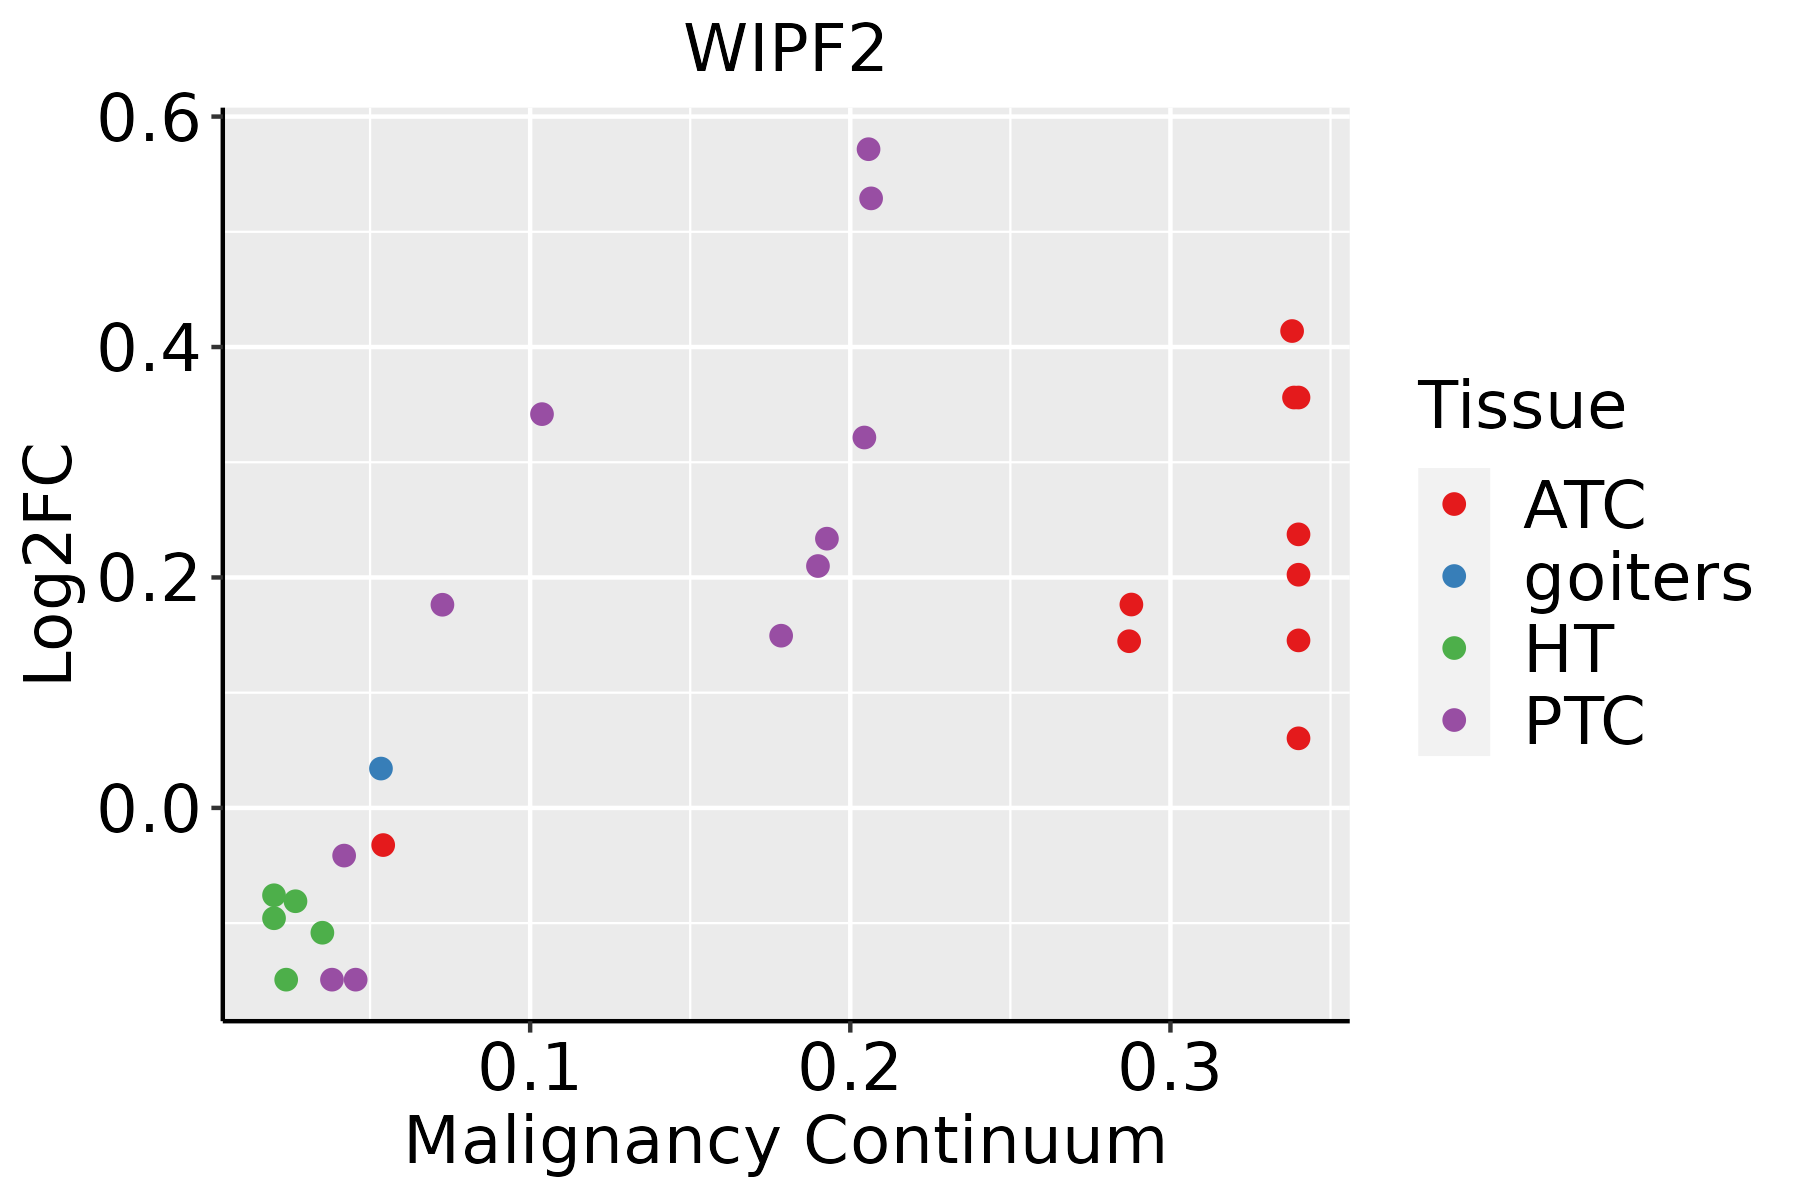 | ATC: Anaplastic thyroid cancer |
| HT: Hashimoto's thyroiditis | ||
| PTC: Papillary thyroid cancer |
| ∗log2FC in expression of this searched gene in stem-like cells from each diseased tissue sample relative to stem-like cells in normal samples in each tissue plotted against the malignancy continuum. Samples are colored based on if they are from different disease stage. |
Top |
Malignant transformation related pathway analysis |
| Find out the enriched GO biological processes and KEGG pathways involved in transition from healthy to precancer to cancer |
| Tissue | Disease Stage | Enriched GO biological Processes |
| Colorectum | AD |  |
| Colorectum | SER |  |
| Colorectum | MSS |  |
| Colorectum | MSI-H |  |
| Colorectum | FAP |  |
| ∗Top 15 enriched GO BP terms are showed in the bar plot of each disease state in each tissue. Each row represents a significant GO biological process which is colored according to the -log10(p.adjust). |
| Page: 1 2 3 4 5 6 7 8 9 |
| GO ID | Tissue | Disease Stage | Description | Gene Ratio | Bg Ratio | pvalue | p.adjust | Count |
| GO:0030048 | Colorectum | AD | actin filament-based movement | 44/3918 | 127/18723 | 2.31e-04 | 2.99e-03 | 44 |
| GO:00300481 | Colorectum | SER | actin filament-based movement | 38/2897 | 127/18723 | 2.80e-05 | 7.56e-04 | 38 |
| GO:00300482 | Colorectum | MSS | actin filament-based movement | 44/3467 | 127/18723 | 1.11e-05 | 2.64e-04 | 44 |
| GO:00300483 | Colorectum | FAP | actin filament-based movement | 44/2622 | 127/18723 | 3.48e-09 | 5.93e-07 | 44 |
| GO:00300484 | Colorectum | CRC | actin filament-based movement | 42/2078 | 127/18723 | 2.96e-11 | 1.97e-08 | 42 |
| Page: 1 |
| Pathway ID | Tissue | Disease Stage | Description | Gene Ratio | Bg Ratio | pvalue | p.adjust | qvalue | Count |
| hsa0513024 | Breast | IDC | Pathogenic Escherichia coli infection | 42/867 | 197/8465 | 2.66e-06 | 3.92e-05 | 2.94e-05 | 42 |
| hsa0513034 | Breast | IDC | Pathogenic Escherichia coli infection | 42/867 | 197/8465 | 2.66e-06 | 3.92e-05 | 2.94e-05 | 42 |
| hsa0513043 | Breast | DCIS | Pathogenic Escherichia coli infection | 42/846 | 197/8465 | 1.40e-06 | 2.15e-05 | 1.59e-05 | 42 |
| hsa0414416 | Breast | DCIS | Endocytosis | 37/846 | 251/8465 | 9.92e-03 | 4.40e-02 | 3.24e-02 | 37 |
| hsa0513053 | Breast | DCIS | Pathogenic Escherichia coli infection | 42/846 | 197/8465 | 1.40e-06 | 2.15e-05 | 1.59e-05 | 42 |
| hsa0414417 | Breast | DCIS | Endocytosis | 37/846 | 251/8465 | 9.92e-03 | 4.40e-02 | 3.24e-02 | 37 |
| hsa04144 | Colorectum | AD | Endocytosis | 111/2092 | 251/8465 | 5.95e-12 | 1.42e-10 | 9.08e-11 | 111 |
| hsa05130 | Colorectum | AD | Pathogenic Escherichia coli infection | 79/2092 | 197/8465 | 1.05e-06 | 1.36e-05 | 8.65e-06 | 79 |
| hsa05135 | Colorectum | AD | Yersinia infection | 58/2092 | 137/8465 | 3.90e-06 | 4.35e-05 | 2.78e-05 | 58 |
| hsa041441 | Colorectum | AD | Endocytosis | 111/2092 | 251/8465 | 5.95e-12 | 1.42e-10 | 9.08e-11 | 111 |
| hsa051301 | Colorectum | AD | Pathogenic Escherichia coli infection | 79/2092 | 197/8465 | 1.05e-06 | 1.36e-05 | 8.65e-06 | 79 |
| hsa051351 | Colorectum | AD | Yersinia infection | 58/2092 | 137/8465 | 3.90e-06 | 4.35e-05 | 2.78e-05 | 58 |
| hsa041442 | Colorectum | SER | Endocytosis | 81/1580 | 251/8465 | 1.14e-07 | 2.36e-06 | 1.71e-06 | 81 |
| hsa051302 | Colorectum | SER | Pathogenic Escherichia coli infection | 60/1580 | 197/8465 | 3.63e-05 | 4.31e-04 | 3.13e-04 | 60 |
| hsa051352 | Colorectum | SER | Yersinia infection | 43/1580 | 137/8465 | 2.15e-04 | 2.10e-03 | 1.52e-03 | 43 |
| hsa041443 | Colorectum | SER | Endocytosis | 81/1580 | 251/8465 | 1.14e-07 | 2.36e-06 | 1.71e-06 | 81 |
| hsa051303 | Colorectum | SER | Pathogenic Escherichia coli infection | 60/1580 | 197/8465 | 3.63e-05 | 4.31e-04 | 3.13e-04 | 60 |
| hsa051353 | Colorectum | SER | Yersinia infection | 43/1580 | 137/8465 | 2.15e-04 | 2.10e-03 | 1.52e-03 | 43 |
| hsa041444 | Colorectum | MSS | Endocytosis | 102/1875 | 251/8465 | 1.85e-11 | 4.43e-10 | 2.71e-10 | 102 |
| hsa051304 | Colorectum | MSS | Pathogenic Escherichia coli infection | 73/1875 | 197/8465 | 1.10e-06 | 1.48e-05 | 9.06e-06 | 73 |
| Page: 1 2 3 4 |
Top |
Cell-cell communication analysis |
| Identification of potential cell-cell interactions between two cell types and their ligand-receptor pairs for different disease states |
| Ligand | Receptor | LRpair | Pathway | Tissue | Disease Stage |
| Page: 1 |
Top |
Single-cell gene regulatory network inference analysis |
| Find out the significant the regulons (TFs) and the target genes of each regulon across cell types for different disease states |
| TF | Cell Type | Tissue | Disease Stage | Target Gene | RSS | Regulon Activity |
| ∗The dot plots of a searched regulon are shown for all cell subpopulations in each disease state of each tissue based on the regulon specific score inferred using pySCENIC and by calculating the average expression. |
| Page: 1 |
Top |
Somatic mutation of malignant transformation related genes |
| Annotation of somatic variants for genes involved in malignant transformation |
| Hugo Symbol | Variant Class | Variant Classification | dbSNP RS | HGVSc | HGVSp | HGVSp Short | SWISSPROT | BIOTYPE | SIFT | PolyPhen | Tumor Sample Barcode | Tissue | Histology | Sex | Age | Stage | Therapy Types | Drugs | Outcome |
| WIPF2 | SNV | Missense_Mutation | c.49C>T | p.Pro17Ser | p.P17S | Q8TF74 | protein_coding | deleterious_low_confidence(0.03) | probably_damaging(0.994) | TCGA-AR-A0TX-01 | Breast | breast invasive carcinoma | Female | <65 | I/II | Unknown | Unknown | SD | |
| WIPF2 | insertion | In_Frame_Ins | novel | c.142_143insTCTCGGCTCACTGCAACCTCCACCTCCTGGGTTCAAGCGATT | p.Thr48delinsIleSerAlaHisCysAsnLeuHisLeuLeuGlySerSerAspSer | p.T48delinsISAHCNLHLLGSSDS | Q8TF74 | protein_coding | TCGA-A8-A09E-01 | Breast | breast invasive carcinoma | Female | >=65 | III/IV | Hormone Therapy | anastrozole | SD | ||
| WIPF2 | deletion | Frame_Shift_Del | novel | c.1269delC | p.Ser423ArgfsTer44 | p.S423Rfs*44 | Q8TF74 | protein_coding | TCGA-EW-A2FV-01 | Breast | breast invasive carcinoma | Female | <65 | III/IV | Chemotherapy | docetaxel | SD | ||
| WIPF2 | SNV | Missense_Mutation | c.845N>A | p.Ser282Tyr | p.S282Y | Q8TF74 | protein_coding | deleterious(0) | probably_damaging(0.994) | TCGA-A6-6141-01 | Colorectum | colon adenocarcinoma | Male | <65 | I/II | Chemotherapy | 5-fu | SD | |
| WIPF2 | SNV | Missense_Mutation | novel | c.519N>A | p.Ser173Arg | p.S173R | Q8TF74 | protein_coding | deleterious(0) | probably_damaging(0.991) | TCGA-AA-3492-01 | Colorectum | colon adenocarcinoma | Female | >=65 | I/II | Unknown | Unknown | SD |
| WIPF2 | SNV | Missense_Mutation | c.238N>T | p.Ala80Ser | p.A80S | Q8TF74 | protein_coding | tolerated(0.41) | benign(0.029) | TCGA-AZ-4616-01 | Colorectum | colon adenocarcinoma | Female | >=65 | III/IV | Chemotherapy | xeloda | PD | |
| WIPF2 | SNV | Missense_Mutation | c.998G>A | p.Arg333Gln | p.R333Q | Q8TF74 | protein_coding | deleterious(0.03) | probably_damaging(0.953) | TCGA-CA-6718-01 | Colorectum | colon adenocarcinoma | Male | <65 | I/II | Unknown | Unknown | PD | |
| WIPF2 | SNV | Missense_Mutation | c.1220A>G | p.Asp407Gly | p.D407G | Q8TF74 | protein_coding | deleterious(0) | probably_damaging(0.995) | TCGA-CM-5341-01 | Colorectum | colon adenocarcinoma | Female | >=65 | III/IV | Chemotherapy | fluorouracil | SD | |
| WIPF2 | deletion | Frame_Shift_Del | c.613_616delNNNN | p.Glu206AsnfsTer31 | p.E206Nfs*31 | Q8TF74 | protein_coding | TCGA-AA-3814-01 | Colorectum | colon adenocarcinoma | Female | >=65 | I/II | Unknown | Unknown | SD | |||
| WIPF2 | deletion | Frame_Shift_Del | c.25delN | p.Pro10HisfsTer20 | p.P10Hfs*20 | Q8TF74 | protein_coding | TCGA-AD-6889-01 | Colorectum | colon adenocarcinoma | Male | >=65 | I/II | Chemotherapy | xeloda | PD |
| Page: 1 2 3 4 5 6 |
Top |
Related drugs of malignant transformation related genes |
| Identification of chemicals and drugs interact with genes involved in malignant transfromation |
| (DGIdb 4.0) |
| Entrez ID | Symbol | Category | Interaction Types | Drug Claim Name | Drug Name | PMIDs |
| Page: 1 |

Copyright 2023-Present -The University of Texas Health Science Center at Houston |