
|
|||||
|
 | |
| |
| |
| |
| |
| |
|
Gene: TXNRD1 |
Gene summary for TXNRD1 |
| Gene information | Species | Human | Gene symbol | TXNRD1 | Gene ID | 7296 |
| Gene name | thioredoxin reductase 1 | |
| Gene Alias | GRIM-12 | |
| Cytomap | 12q23.3 | |
| Gene Type | protein-coding | GO ID | GO:0001704 | UniProtAcc | Q16881 |
Top |
Malignant transformation analysis |
| Identification of the aberrant gene expression in precancerous and cancerous lesions by comparing the gene expression of stem-like cells in diseased tissues with normal stem cells |
| Entrez ID | Symbol | Replicates | Species | Organ | Tissue | Adj P-value | Log2FC | Malignancy |
| 7296 | TXNRD1 | PTC03 | Human | Thyroid | PTC | 2.92e-04 | 2.58e-02 | 0.1784 |
| 7296 | TXNRD1 | PTC04 | Human | Thyroid | PTC | 3.44e-08 | -3.05e-02 | 0.1927 |
| 7296 | TXNRD1 | PTC05 | Human | Thyroid | PTC | 3.94e-12 | 1.53e-01 | 0.2065 |
| 7296 | TXNRD1 | PTC06 | Human | Thyroid | PTC | 1.63e-16 | 1.99e-01 | 0.2057 |
| 7296 | TXNRD1 | PTC07 | Human | Thyroid | PTC | 4.67e-09 | 1.19e-01 | 0.2044 |
| 7296 | TXNRD1 | ATC08 | Human | Thyroid | ATC | 2.21e-03 | 6.46e-02 | 0.0541 |
| 7296 | TXNRD1 | ATC09 | Human | Thyroid | ATC | 1.25e-09 | 4.46e-01 | 0.2871 |
| 7296 | TXNRD1 | ATC12 | Human | Thyroid | ATC | 2.26e-35 | 1.20e+00 | 0.34 |
| 7296 | TXNRD1 | ATC13 | Human | Thyroid | ATC | 1.68e-17 | 1.84e-01 | 0.34 |
| 7296 | TXNRD1 | ATC1 | Human | Thyroid | ATC | 9.73e-09 | 5.98e-01 | 0.2878 |
| 7296 | TXNRD1 | ATC2 | Human | Thyroid | ATC | 4.36e-06 | 1.04e+00 | 0.34 |
| 7296 | TXNRD1 | ATC3 | Human | Thyroid | ATC | 3.03e-03 | 3.88e-01 | 0.338 |
| 7296 | TXNRD1 | ATC4 | Human | Thyroid | ATC | 1.92e-49 | 1.52e+00 | 0.34 |
| 7296 | TXNRD1 | ATC5 | Human | Thyroid | ATC | 5.20e-12 | 2.27e-01 | 0.34 |
| Page: 1 2 3 4 5 6 7 8 |
| Tissue | Expression Dynamics | Abbreviation |
| Cervix |  | CC: Cervix cancer |
| HSIL_HPV: HPV-infected high-grade squamous intraepithelial lesions | ||
| N_HPV: HPV-infected normal cervix | ||
| Endometrium | 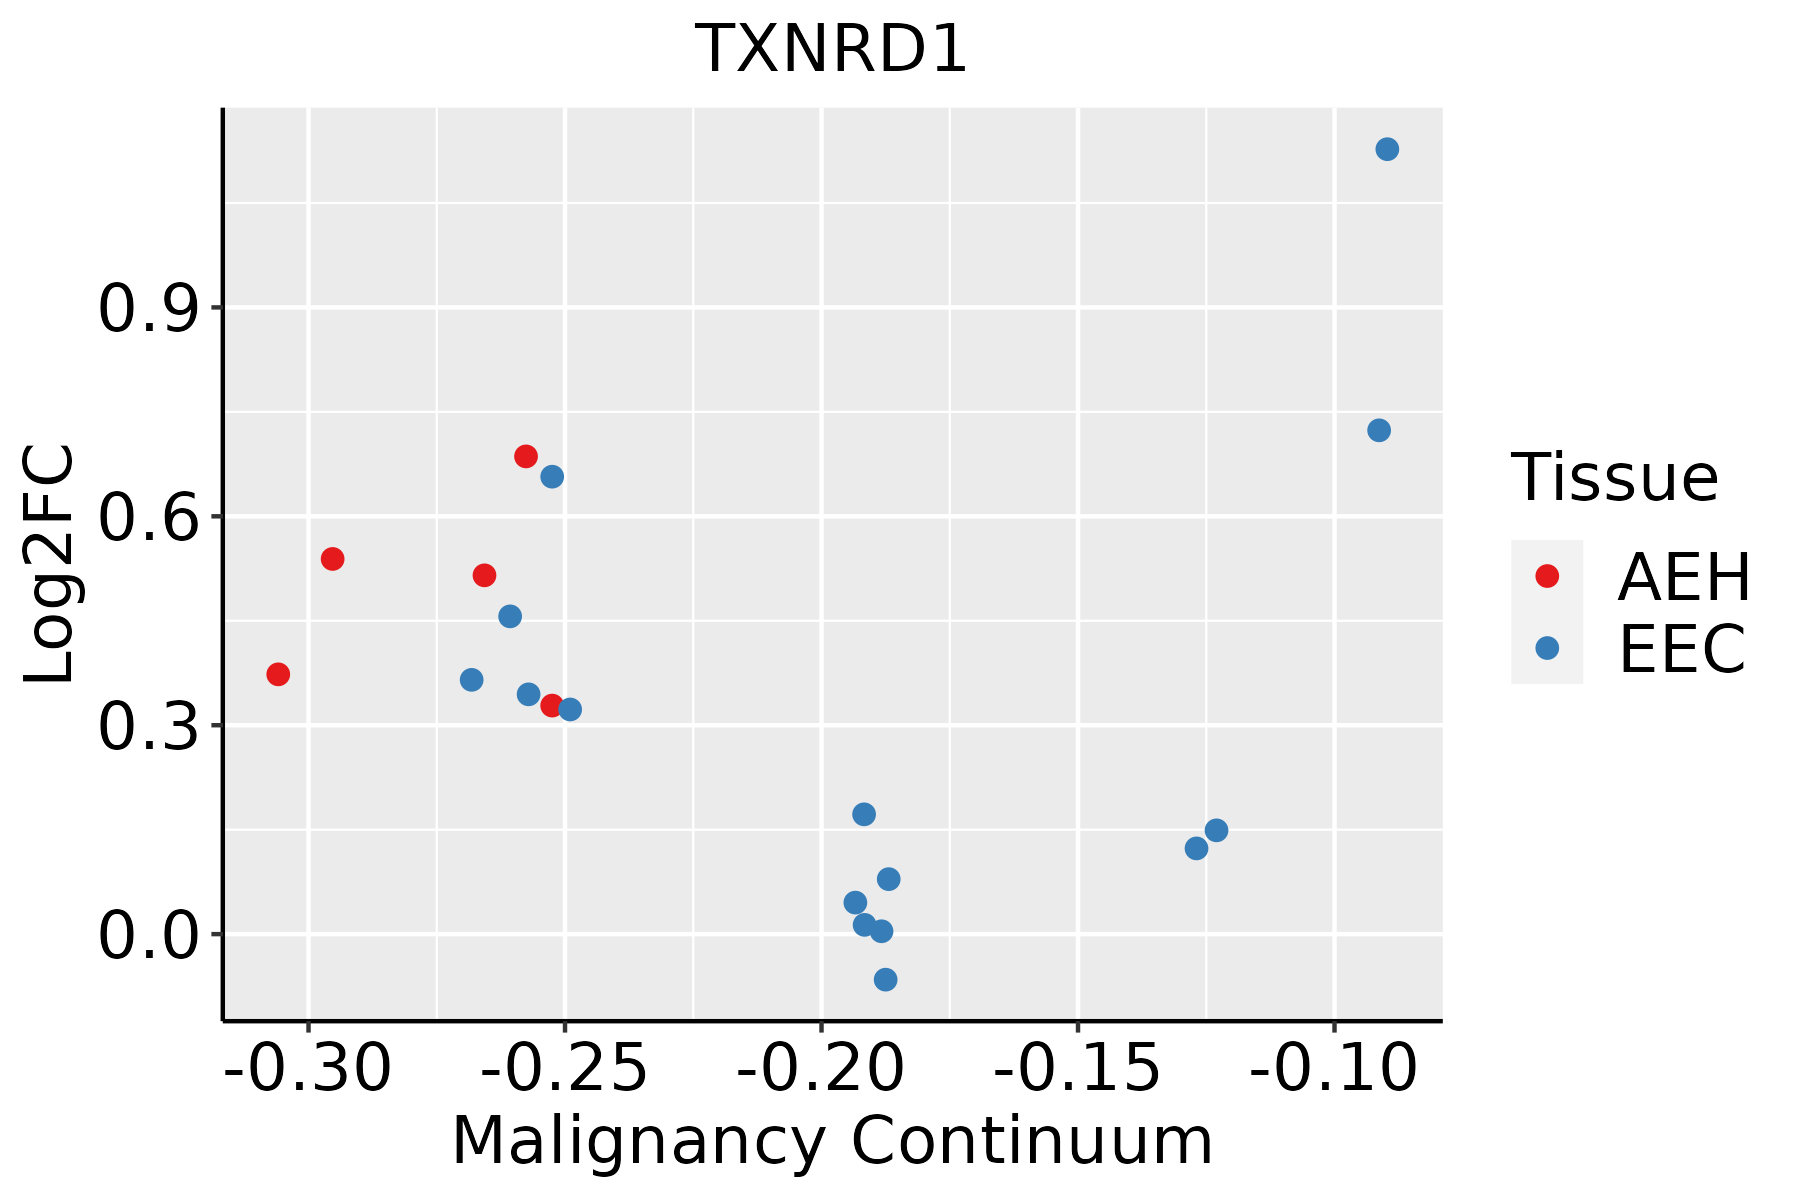 | AEH: Atypical endometrial hyperplasia |
| EEC: Endometrioid Cancer | ||
| Esophagus | 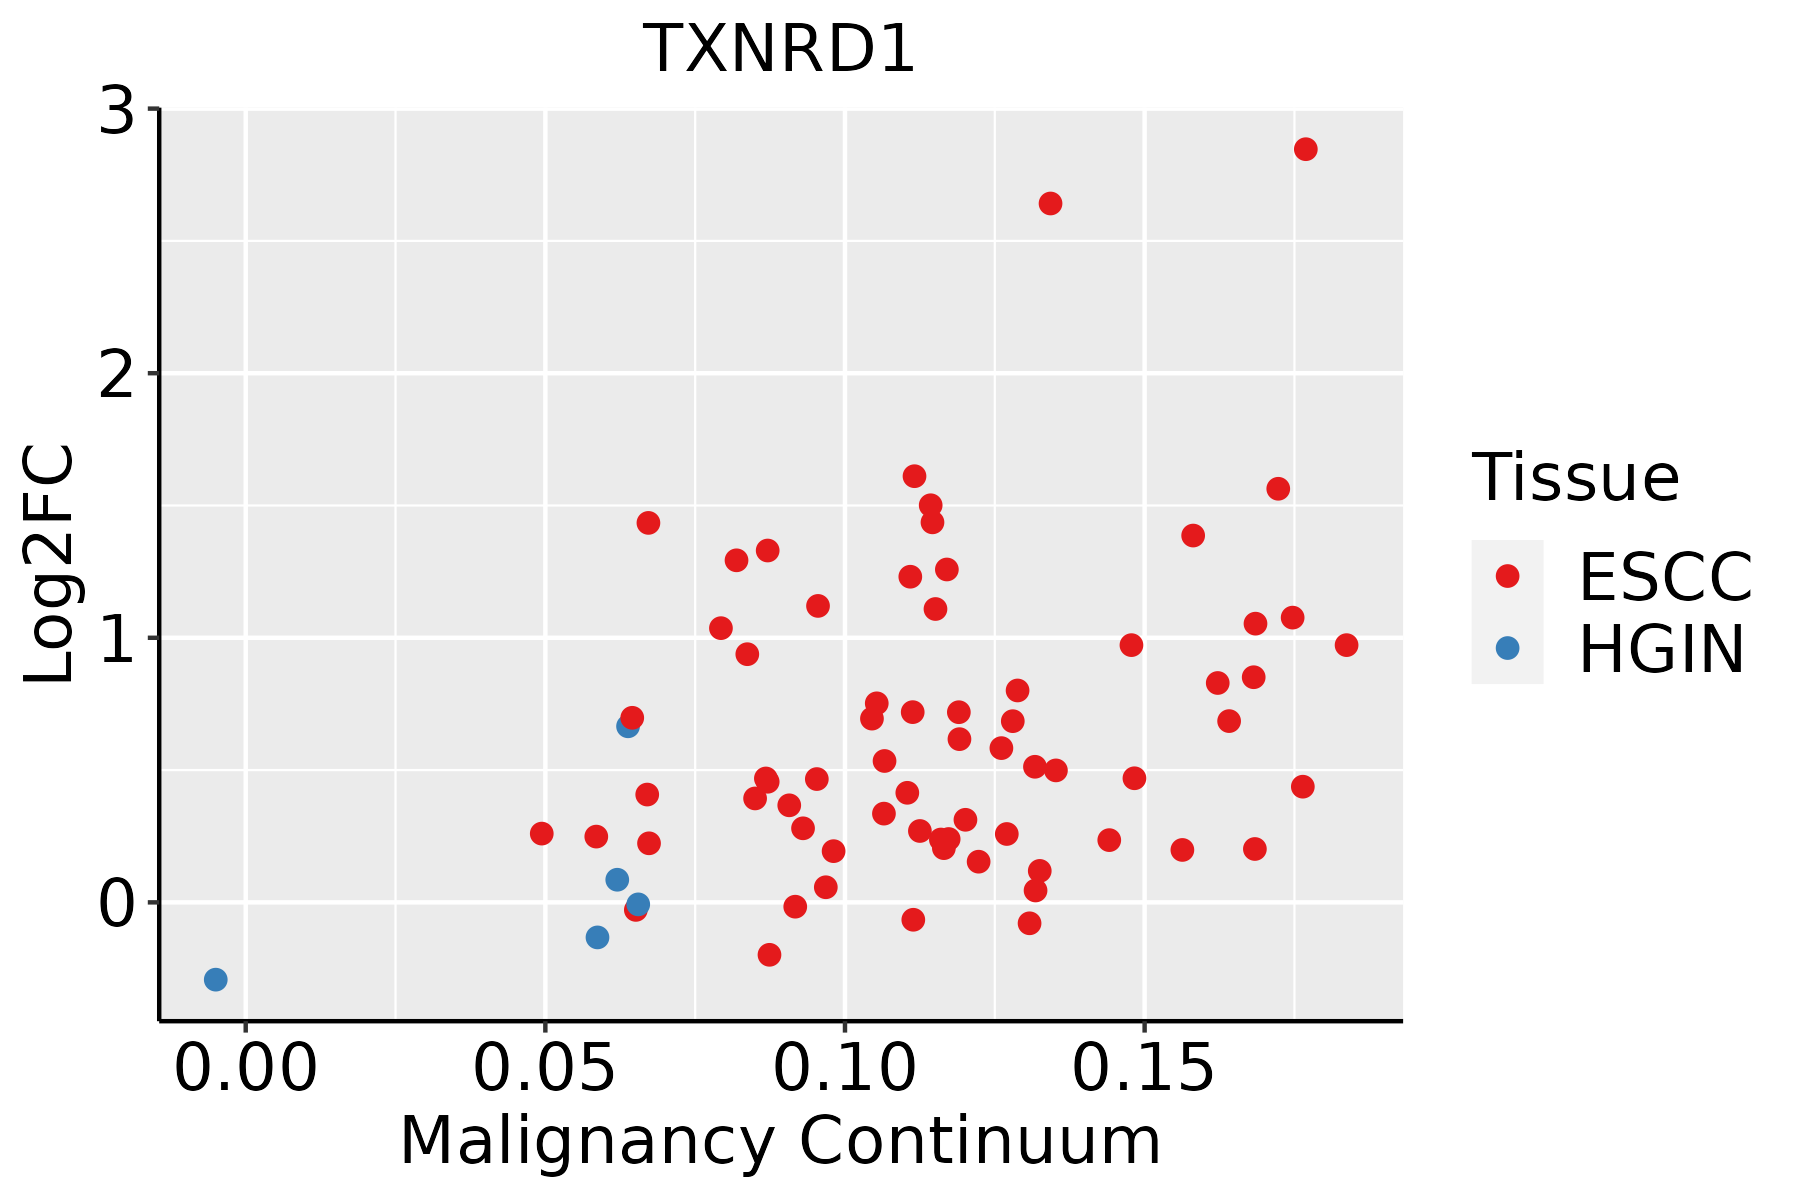 | ESCC: Esophageal squamous cell carcinoma |
| HGIN: High-grade intraepithelial neoplasias | ||
| LGIN: Low-grade intraepithelial neoplasias | ||
| Liver | 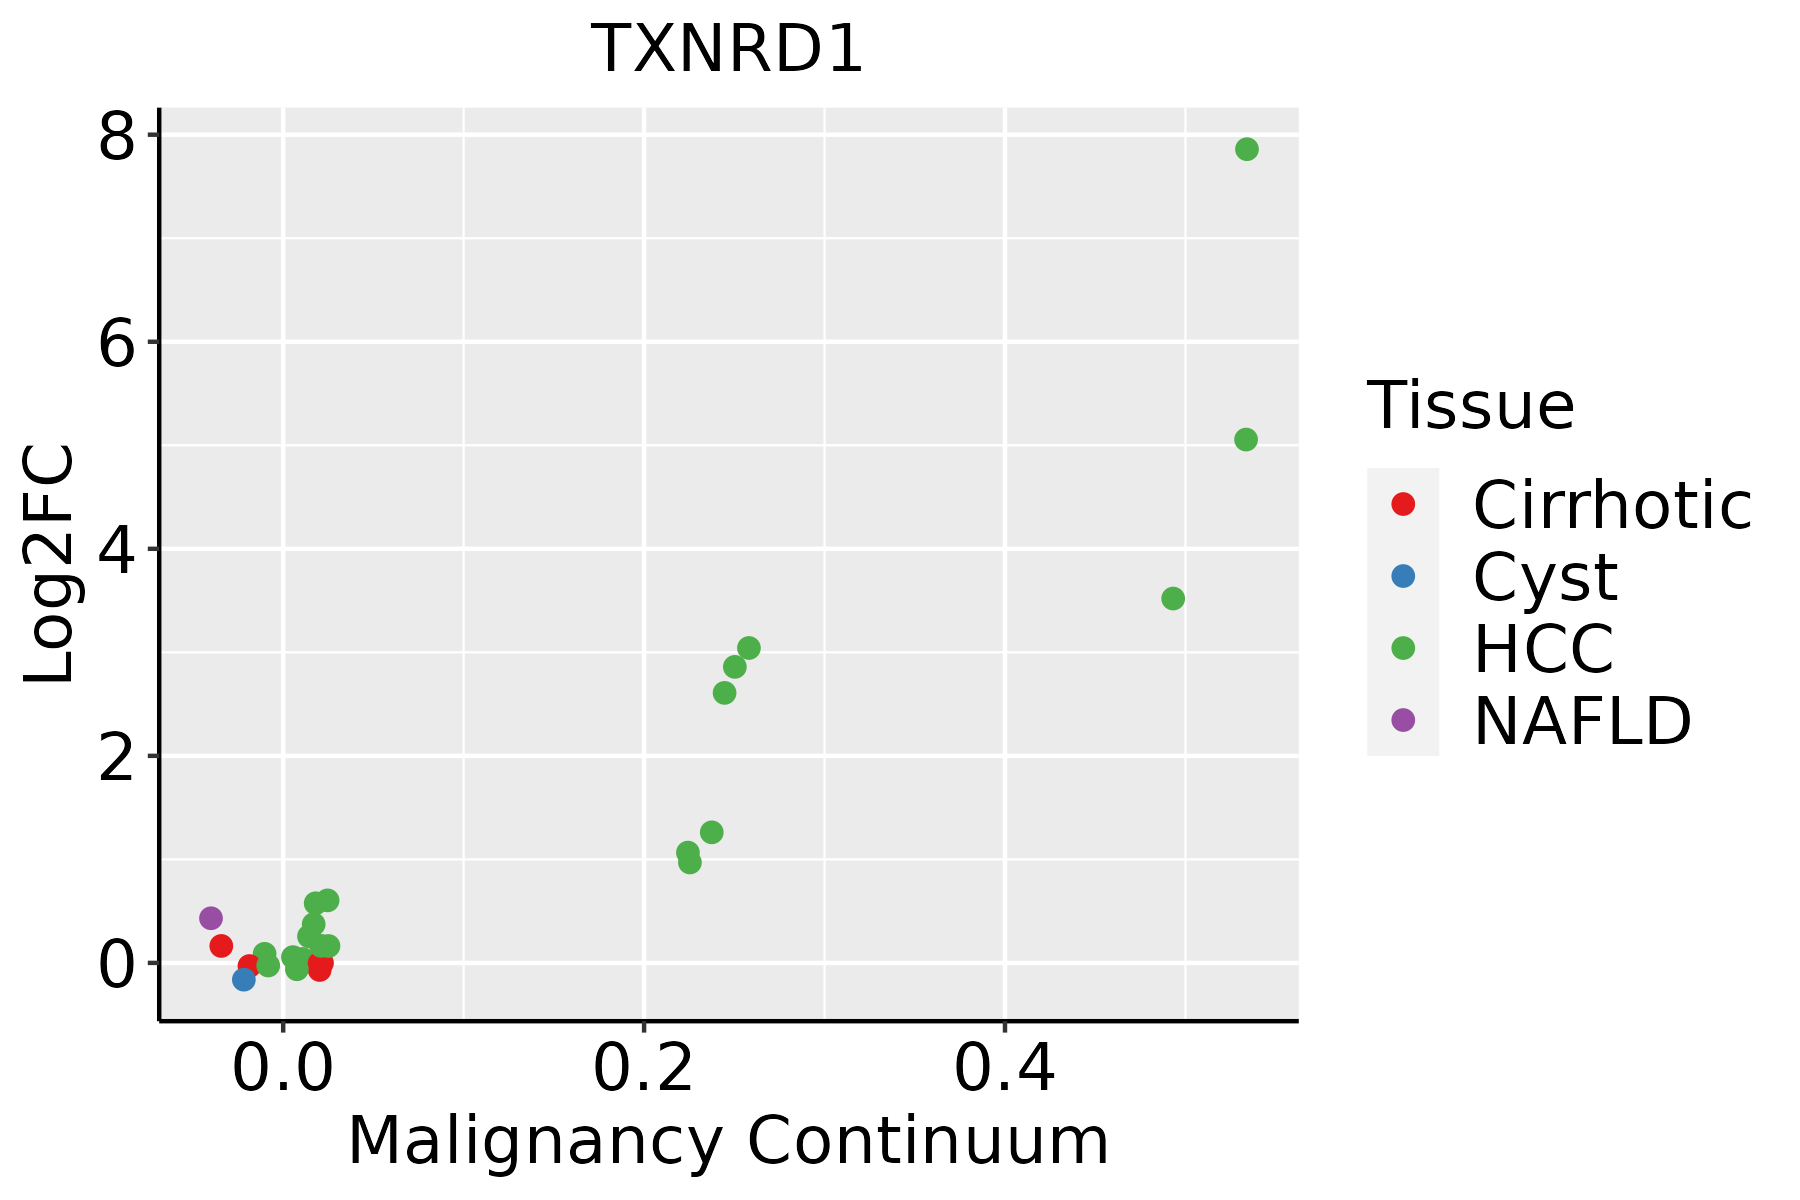 | HCC: Hepatocellular carcinoma |
| NAFLD: Non-alcoholic fatty liver disease | ||
| Oral Cavity | 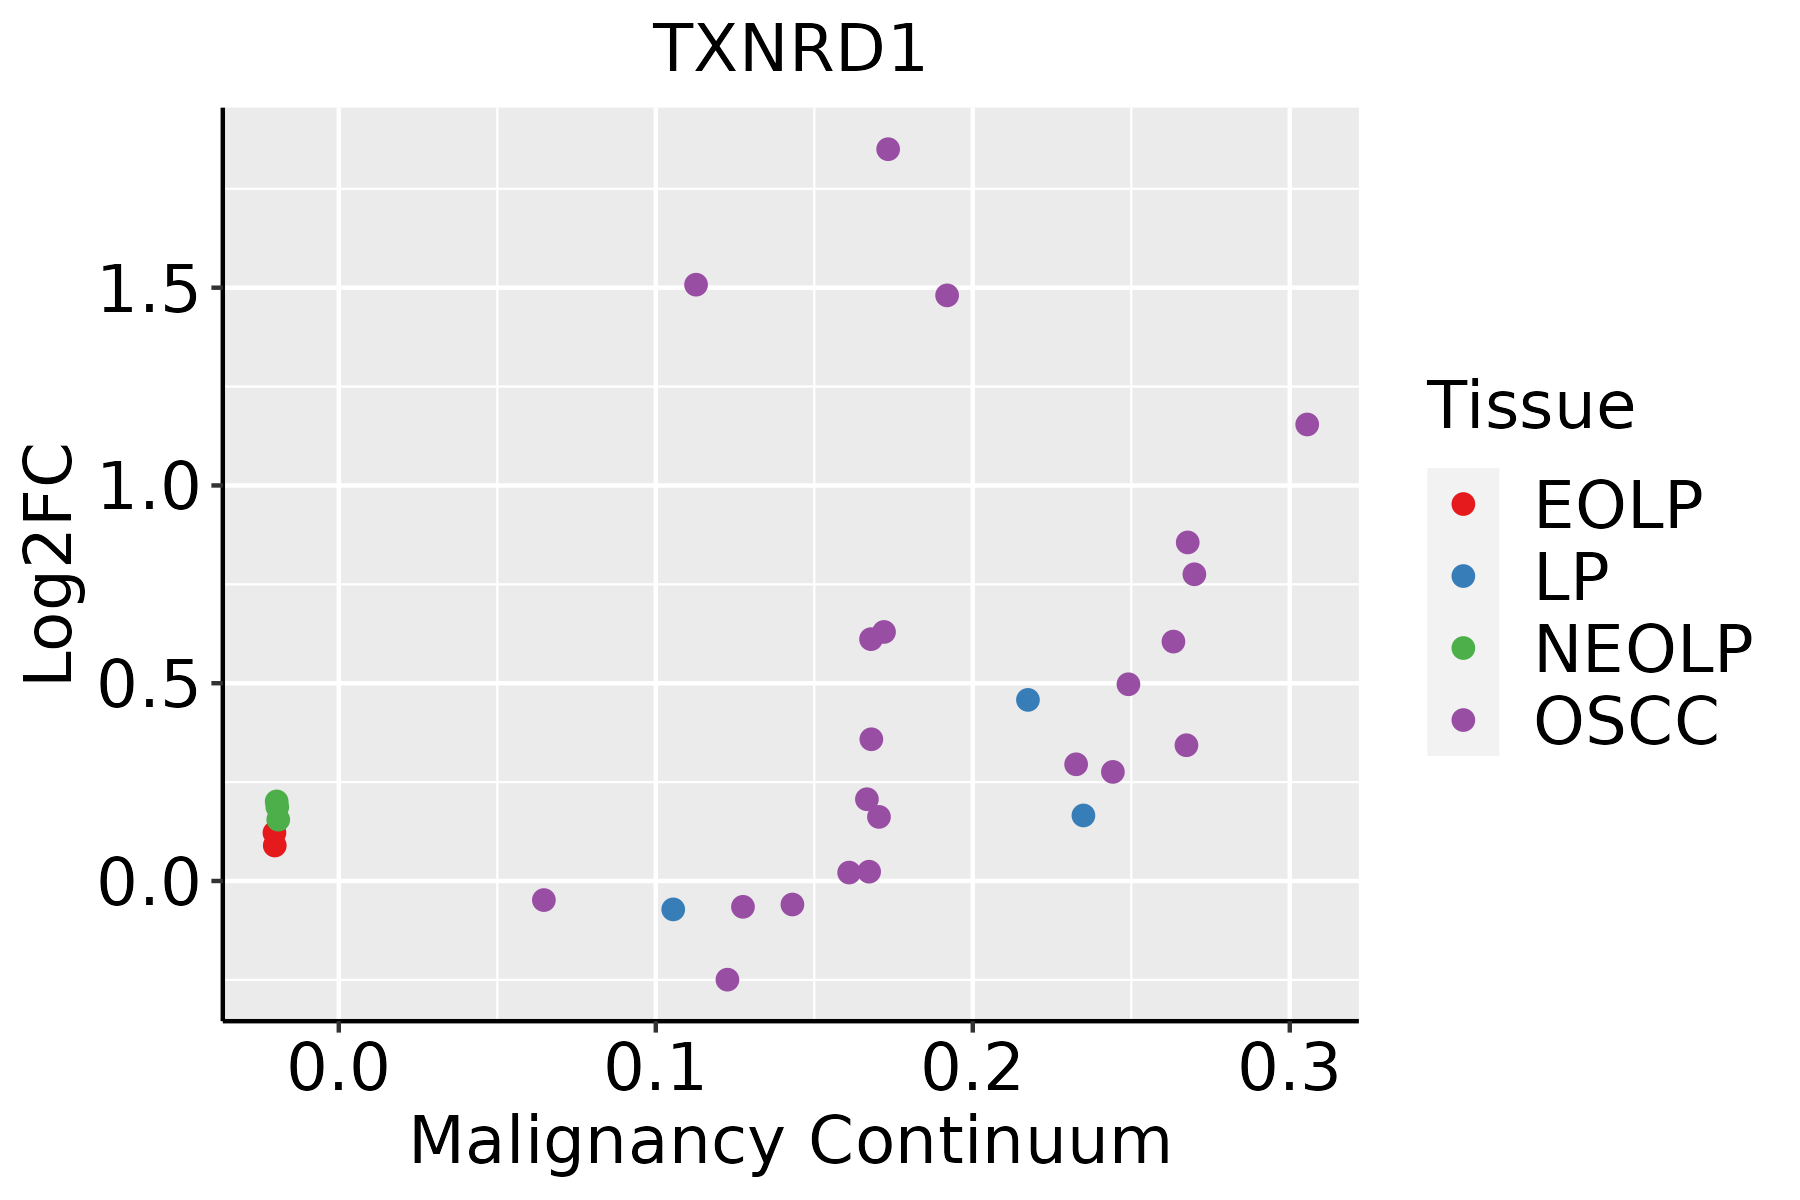 | EOLP: Erosive Oral lichen planus |
| LP: leukoplakia | ||
| NEOLP: Non-erosive oral lichen planus | ||
| OSCC: Oral squamous cell carcinoma | ||
| Prostate |  | BPH: Benign Prostatic Hyperplasia |
| Skin | 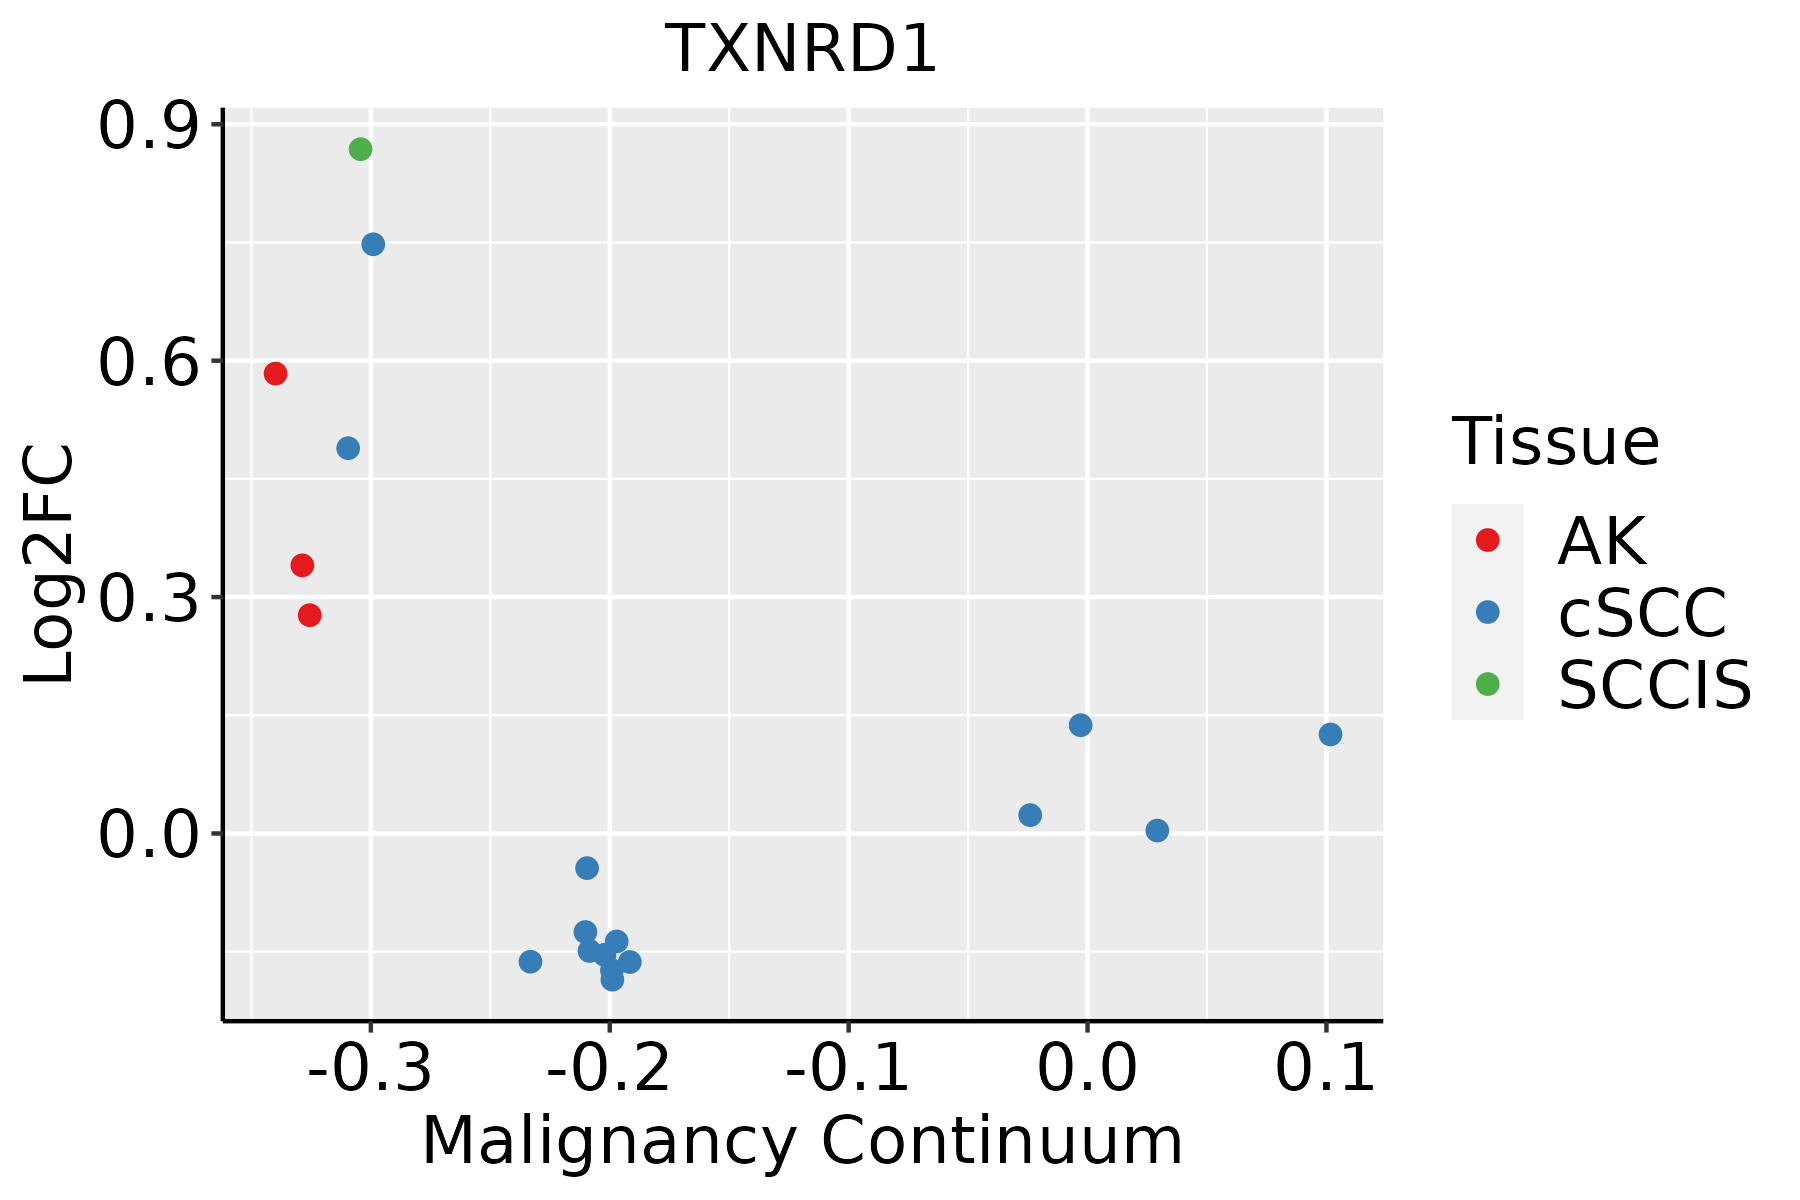 | AK: Actinic keratosis |
| cSCC: Cutaneous squamous cell carcinoma | ||
| SCCIS:squamous cell carcinoma in situ | ||
| Thyroid |  | ATC: Anaplastic thyroid cancer |
| HT: Hashimoto's thyroiditis | ||
| PTC: Papillary thyroid cancer |
| ∗log2FC in expression of this searched gene in stem-like cells from each diseased tissue sample relative to stem-like cells in normal samples in each tissue plotted against the malignancy continuum. Samples are colored based on if they are from different disease stage. |
Top |
Malignant transformation related pathway analysis |
| Find out the enriched GO biological processes and KEGG pathways involved in transition from healthy to precancer to cancer |
| Tissue | Disease Stage | Enriched GO biological Processes |
| Colorectum | AD |  |
| Colorectum | SER |  |
| Colorectum | MSS |  |
| Colorectum | MSI-H |  |
| Colorectum | FAP |  |
| ∗Top 15 enriched GO BP terms are showed in the bar plot of each disease state in each tissue. Each row represents a significant GO biological process which is colored according to the -log10(p.adjust). |
| Page: 1 2 3 4 5 6 7 8 9 |
| GO ID | Tissue | Disease Stage | Description | Gene Ratio | Bg Ratio | pvalue | p.adjust | Count |
| GO:00988699 | Cervix | CC | cellular oxidant detoxification | 30/2311 | 101/18723 | 2.72e-06 | 7.93e-05 | 30 |
| GO:19907489 | Cervix | CC | cellular detoxification | 30/2311 | 116/18723 | 5.34e-05 | 7.94e-04 | 30 |
| GO:00073695 | Cervix | CC | gastrulation | 42/2311 | 185/18723 | 5.83e-05 | 8.46e-04 | 42 |
| GO:00972379 | Cervix | CC | cellular response to toxic substance | 31/2311 | 124/18723 | 8.09e-05 | 1.10e-03 | 31 |
| GO:00096369 | Cervix | CC | response to toxic substance | 52/2311 | 262/18723 | 3.34e-04 | 3.52e-03 | 52 |
| GO:00987549 | Cervix | CC | detoxification | 33/2311 | 152/18723 | 7.97e-04 | 7.00e-03 | 33 |
| GO:0001704 | Cervix | CC | formation of primary germ layer | 27/2311 | 121/18723 | 1.49e-03 | 1.16e-02 | 27 |
| GO:00454549 | Cervix | CC | cell redox homeostasis | 10/2311 | 35/18723 | 7.99e-03 | 4.18e-02 | 10 |
| GO:009723710 | Endometrium | AEH | cellular response to toxic substance | 34/2100 | 124/18723 | 5.02e-07 | 1.97e-05 | 34 |
| GO:199074810 | Endometrium | AEH | cellular detoxification | 30/2100 | 116/18723 | 8.40e-06 | 1.98e-04 | 30 |
| GO:000963610 | Endometrium | AEH | response to toxic substance | 52/2100 | 262/18723 | 2.89e-05 | 5.40e-04 | 52 |
| GO:009886910 | Endometrium | AEH | cellular oxidant detoxification | 26/2100 | 101/18723 | 3.57e-05 | 6.26e-04 | 26 |
| GO:004545410 | Endometrium | AEH | cell redox homeostasis | 12/2100 | 35/18723 | 2.69e-04 | 3.12e-03 | 12 |
| GO:009875410 | Endometrium | AEH | detoxification | 31/2100 | 152/18723 | 6.85e-04 | 6.62e-03 | 31 |
| GO:009723715 | Endometrium | EEC | cellular response to toxic substance | 35/2168 | 124/18723 | 3.44e-07 | 1.37e-05 | 35 |
| GO:199074815 | Endometrium | EEC | cellular detoxification | 31/2168 | 116/18723 | 5.54e-06 | 1.36e-04 | 31 |
| GO:000963615 | Endometrium | EEC | response to toxic substance | 54/2168 | 262/18723 | 1.65e-05 | 3.18e-04 | 54 |
| GO:009886915 | Endometrium | EEC | cellular oxidant detoxification | 27/2168 | 101/18723 | 2.17e-05 | 3.89e-04 | 27 |
| GO:004545414 | Endometrium | EEC | cell redox homeostasis | 12/2168 | 35/18723 | 3.63e-04 | 3.95e-03 | 12 |
| GO:009875415 | Endometrium | EEC | detoxification | 32/2168 | 152/18723 | 5.52e-04 | 5.52e-03 | 32 |
| Page: 1 2 3 4 5 6 |
| Pathway ID | Tissue | Disease Stage | Description | Gene Ratio | Bg Ratio | pvalue | p.adjust | qvalue | Count |
| hsa0522510 | Cervix | CC | Hepatocellular carcinoma | 40/1267 | 168/8465 | 1.52e-03 | 6.39e-03 | 3.78e-03 | 40 |
| hsa0522513 | Cervix | CC | Hepatocellular carcinoma | 40/1267 | 168/8465 | 1.52e-03 | 6.39e-03 | 3.78e-03 | 40 |
| hsa0522518 | Esophagus | ESCC | Hepatocellular carcinoma | 109/4205 | 168/8465 | 4.27e-05 | 1.88e-04 | 9.64e-05 | 109 |
| hsa0522519 | Esophagus | ESCC | Hepatocellular carcinoma | 109/4205 | 168/8465 | 4.27e-05 | 1.88e-04 | 9.64e-05 | 109 |
| hsa052258 | Liver | HCC | Hepatocellular carcinoma | 106/4020 | 168/8465 | 2.87e-05 | 1.85e-04 | 1.03e-04 | 106 |
| hsa0522511 | Liver | HCC | Hepatocellular carcinoma | 106/4020 | 168/8465 | 2.87e-05 | 1.85e-04 | 1.03e-04 | 106 |
| hsa0522516 | Oral cavity | OSCC | Hepatocellular carcinoma | 97/3704 | 168/8465 | 1.63e-04 | 5.52e-04 | 2.81e-04 | 97 |
| hsa0522517 | Oral cavity | OSCC | Hepatocellular carcinoma | 97/3704 | 168/8465 | 1.63e-04 | 5.52e-04 | 2.81e-04 | 97 |
| hsa0522514 | Prostate | BPH | Hepatocellular carcinoma | 51/1718 | 168/8465 | 1.17e-03 | 5.22e-03 | 3.23e-03 | 51 |
| hsa0522515 | Prostate | BPH | Hepatocellular carcinoma | 51/1718 | 168/8465 | 1.17e-03 | 5.22e-03 | 3.23e-03 | 51 |
| hsa0522522 | Prostate | Tumor | Hepatocellular carcinoma | 53/1791 | 168/8465 | 9.65e-04 | 4.44e-03 | 2.75e-03 | 53 |
| hsa0522532 | Prostate | Tumor | Hepatocellular carcinoma | 53/1791 | 168/8465 | 9.65e-04 | 4.44e-03 | 2.75e-03 | 53 |
| Page: 1 |
Top |
Cell-cell communication analysis |
| Identification of potential cell-cell interactions between two cell types and their ligand-receptor pairs for different disease states |
| Ligand | Receptor | LRpair | Pathway | Tissue | Disease Stage |
| Page: 1 |
Top |
Single-cell gene regulatory network inference analysis |
| Find out the significant the regulons (TFs) and the target genes of each regulon across cell types for different disease states |
| TF | Cell Type | Tissue | Disease Stage | Target Gene | RSS | Regulon Activity |
| ∗The dot plots of a searched regulon are shown for all cell subpopulations in each disease state of each tissue based on the regulon specific score inferred using pySCENIC and by calculating the average expression. |
| Page: 1 |
Top |
Somatic mutation of malignant transformation related genes |
| Annotation of somatic variants for genes involved in malignant transformation |
| Hugo Symbol | Variant Class | Variant Classification | dbSNP RS | HGVSc | HGVSp | HGVSp Short | SWISSPROT | BIOTYPE | SIFT | PolyPhen | Tumor Sample Barcode | Tissue | Histology | Sex | Age | Stage | Therapy Types | Drugs | Outcome |
| TXNRD1 | SNV | Missense_Mutation | novel | c.1312N>G | p.Met438Val | p.M438V | Q16881 | protein_coding | tolerated(0.1) | benign(0.006) | TCGA-BH-A0B6-01 | Breast | breast invasive carcinoma | Female | <65 | I/II | Unknown | Unknown | SD |
| TXNRD1 | SNV | Missense_Mutation | rs773469710 | c.387N>C | p.Lys129Asn | p.K129N | Q16881 | protein_coding | tolerated(0.11) | benign(0.001) | TCGA-D8-A1J8-01 | Breast | breast invasive carcinoma | Female | >=65 | I/II | Hormone Therapy | nolvadex | SD |
| TXNRD1 | SNV | Missense_Mutation | c.961N>T | p.Pro321Ser | p.P321S | Q16881 | protein_coding | deleterious(0) | probably_damaging(0.934) | TCGA-E9-A1R2-01 | Breast | breast invasive carcinoma | Female | <65 | III/IV | Chemotherapy | taxotere | CR | |
| TXNRD1 | SNV | Missense_Mutation | novel | c.1810G>A | p.Ala604Thr | p.A604T | Q16881 | protein_coding | tolerated(0.08) | benign(0.07) | TCGA-C5-A8YQ-01 | Cervix | cervical & endocervical cancer | Female | >=65 | I/II | Chemotherapy | cisplatin | PD |
| TXNRD1 | SNV | Missense_Mutation | c.1609N>C | p.Glu537Gln | p.E537Q | Q16881 | protein_coding | deleterious(0) | probably_damaging(0.999) | TCGA-DS-A0VL-01 | Cervix | cervical & endocervical cancer | Female | <65 | I/II | Unknown | Unknown | SD | |
| TXNRD1 | SNV | Missense_Mutation | rs369684801 | c.1750N>T | p.Arg584Cys | p.R584C | Q16881 | protein_coding | deleterious(0) | probably_damaging(0.992) | TCGA-EA-A410-01 | Cervix | cervical & endocervical cancer | Female | <65 | I/II | Unknown | Unknown | SD |
| TXNRD1 | SNV | Missense_Mutation | novel | c.175N>T | p.Leu59Phe | p.L59F | Q16881 | protein_coding | deleterious(0.01) | benign(0.025) | TCGA-VS-A8EB-01 | Cervix | cervical & endocervical cancer | Female | <65 | III/IV | Unknown | Unknown | PD |
| TXNRD1 | SNV | Missense_Mutation | rs769989720 | c.232C>T | p.Arg78Cys | p.R78C | Q16881 | protein_coding | tolerated(0.15) | benign(0.251) | TCGA-VS-A9U6-01 | Cervix | cervical & endocervical cancer | Female | <65 | I/II | Chemotherapy | cisplatin | PD |
| TXNRD1 | SNV | Missense_Mutation | novel | c.994N>T | p.Asp332Tyr | p.D332Y | Q16881 | protein_coding | deleterious(0) | probably_damaging(1) | TCGA-AA-3984-01 | Colorectum | colon adenocarcinoma | Female | <65 | I/II | Unknown | Unknown | SD |
| TXNRD1 | SNV | Missense_Mutation | c.956N>A | p.Gly319Asp | p.G319D | Q16881 | protein_coding | tolerated(0.91) | benign(0.006) | TCGA-AA-A00N-01 | Colorectum | colon adenocarcinoma | Male | >=65 | I/II | Unknown | Unknown | PD |
| Page: 1 2 3 4 5 6 7 |
Top |
Related drugs of malignant transformation related genes |
| Identification of chemicals and drugs interact with genes involved in malignant transfromation |
| (DGIdb 4.0) |
| Entrez ID | Symbol | Category | Interaction Types | Drug Claim Name | Drug Name | PMIDs |
| 7296 | TXNRD1 | DRUGGABLE GENOME | 4-aryl quinol derivative 7 | |||
| 7296 | TXNRD1 | DRUGGABLE GENOME | ARSENIC TRIOXIDE | |||
| 7296 | TXNRD1 | DRUGGABLE GENOME | Binuclear gold(I) compound 1 | |||
| 7296 | TXNRD1 | DRUGGABLE GENOME | Disulfide compound 1 | |||
| 7296 | TXNRD1 | DRUGGABLE GENOME | Metal complex derivative 3 | |||
| 7296 | TXNRD1 | DRUGGABLE GENOME | inhibitor | CHEMBL1200978 | ARSENIC TRIOXIDE | |
| 7296 | TXNRD1 | DRUGGABLE GENOME | Terpyridineplatinum(II) complexe 2 | |||
| 7296 | TXNRD1 | DRUGGABLE GENOME | Fotemustine | FOTEMUSTINE | ||
| 7296 | TXNRD1 | DRUGGABLE GENOME | 4-aryl quinol derivative 4 | |||
| 7296 | TXNRD1 | DRUGGABLE GENOME | vitamin c | 23913015 |
| Page: 1 2 3 4 5 6 7 |

Copyright 2023-Present -The University of Texas Health Science Center at Houston |