
|
|||||
|
 | |
| |
| |
| |
| |
| |
|
Gene: TSC22D2 |
Gene summary for TSC22D2 |
| Gene information | Species | Human | Gene symbol | TSC22D2 | Gene ID | 9819 |
| Gene name | TSC22 domain family member 2 | |
| Gene Alias | TILZ4a | |
| Cytomap | 3q25.1 | |
| Gene Type | protein-coding | GO ID | GO:0006139 | UniProtAcc | B4DN36 |
Top |
Malignant transformation analysis |
| Identification of the aberrant gene expression in precancerous and cancerous lesions by comparing the gene expression of stem-like cells in diseased tissues with normal stem cells |
| Entrez ID | Symbol | Replicates | Species | Organ | Tissue | Adj P-value | Log2FC | Malignancy |
| 9819 | TSC22D2 | RNA-P7T1-P7T1-4 | Human | Lung | AIS | 6.32e-05 | 4.40e-01 | -0.0809 |
| 9819 | TSC22D2 | C21 | Human | Oral cavity | OSCC | 1.38e-12 | 5.20e-01 | 0.2678 |
| 9819 | TSC22D2 | C30 | Human | Oral cavity | OSCC | 4.43e-12 | 6.60e-01 | 0.3055 |
| 9819 | TSC22D2 | C43 | Human | Oral cavity | OSCC | 7.04e-05 | 3.14e-02 | 0.1704 |
| 9819 | TSC22D2 | C51 | Human | Oral cavity | OSCC | 7.18e-09 | 5.12e-01 | 0.2674 |
| 9819 | TSC22D2 | C57 | Human | Oral cavity | OSCC | 3.76e-02 | 2.83e-01 | 0.1679 |
| 9819 | TSC22D2 | C06 | Human | Oral cavity | OSCC | 1.26e-05 | 8.39e-01 | 0.2699 |
| 9819 | TSC22D2 | C08 | Human | Oral cavity | OSCC | 3.21e-13 | 6.57e-01 | 0.1919 |
| 9819 | TSC22D2 | C09 | Human | Oral cavity | OSCC | 1.97e-04 | 3.68e-01 | 0.1431 |
| 9819 | TSC22D2 | LP15 | Human | Oral cavity | LP | 2.91e-03 | 9.97e-01 | 0.2174 |
| 9819 | TSC22D2 | EOLP-1 | Human | Oral cavity | EOLP | 3.23e-12 | 3.96e-01 | -0.0202 |
| 9819 | TSC22D2 | NEOLP-1 | Human | Oral cavity | NEOLP | 3.68e-07 | 4.86e-01 | -0.0194 |
| 9819 | TSC22D2 | SYSMH1 | Human | Oral cavity | OSCC | 1.31e-02 | 3.39e-01 | 0.1127 |
| 9819 | TSC22D2 | SYSMH3 | Human | Oral cavity | OSCC | 1.38e-02 | 2.25e-01 | 0.2442 |
| 9819 | TSC22D2 | HTA12-18-3 | Human | Pancreas | PDAC | 3.37e-06 | 7.82e-01 | 0.0716 |
| 9819 | TSC22D2 | HTA12-25-1 | Human | Pancreas | PDAC | 3.76e-08 | 7.56e-01 | 0.313 |
| 9819 | TSC22D2 | HTA12-26-1 | Human | Pancreas | PDAC | 8.26e-07 | 4.41e-01 | 0.3728 |
| 9819 | TSC22D2 | HTA12-29-1 | Human | Pancreas | PDAC | 5.80e-18 | 4.60e-01 | 0.3722 |
| 9819 | TSC22D2 | HTA12-9-2 | Human | Pancreas | PDAC | 3.98e-13 | 7.38e-01 | 0.0835 |
| 9819 | TSC22D2 | GSM5252128_BPH327PrGF_Via | Human | Prostate | BPH | 3.76e-15 | 7.51e-01 | -0.1688 |
| Page: 1 2 3 4 5 6 7 8 9 |
| Tissue | Expression Dynamics | Abbreviation |
| Cervix | 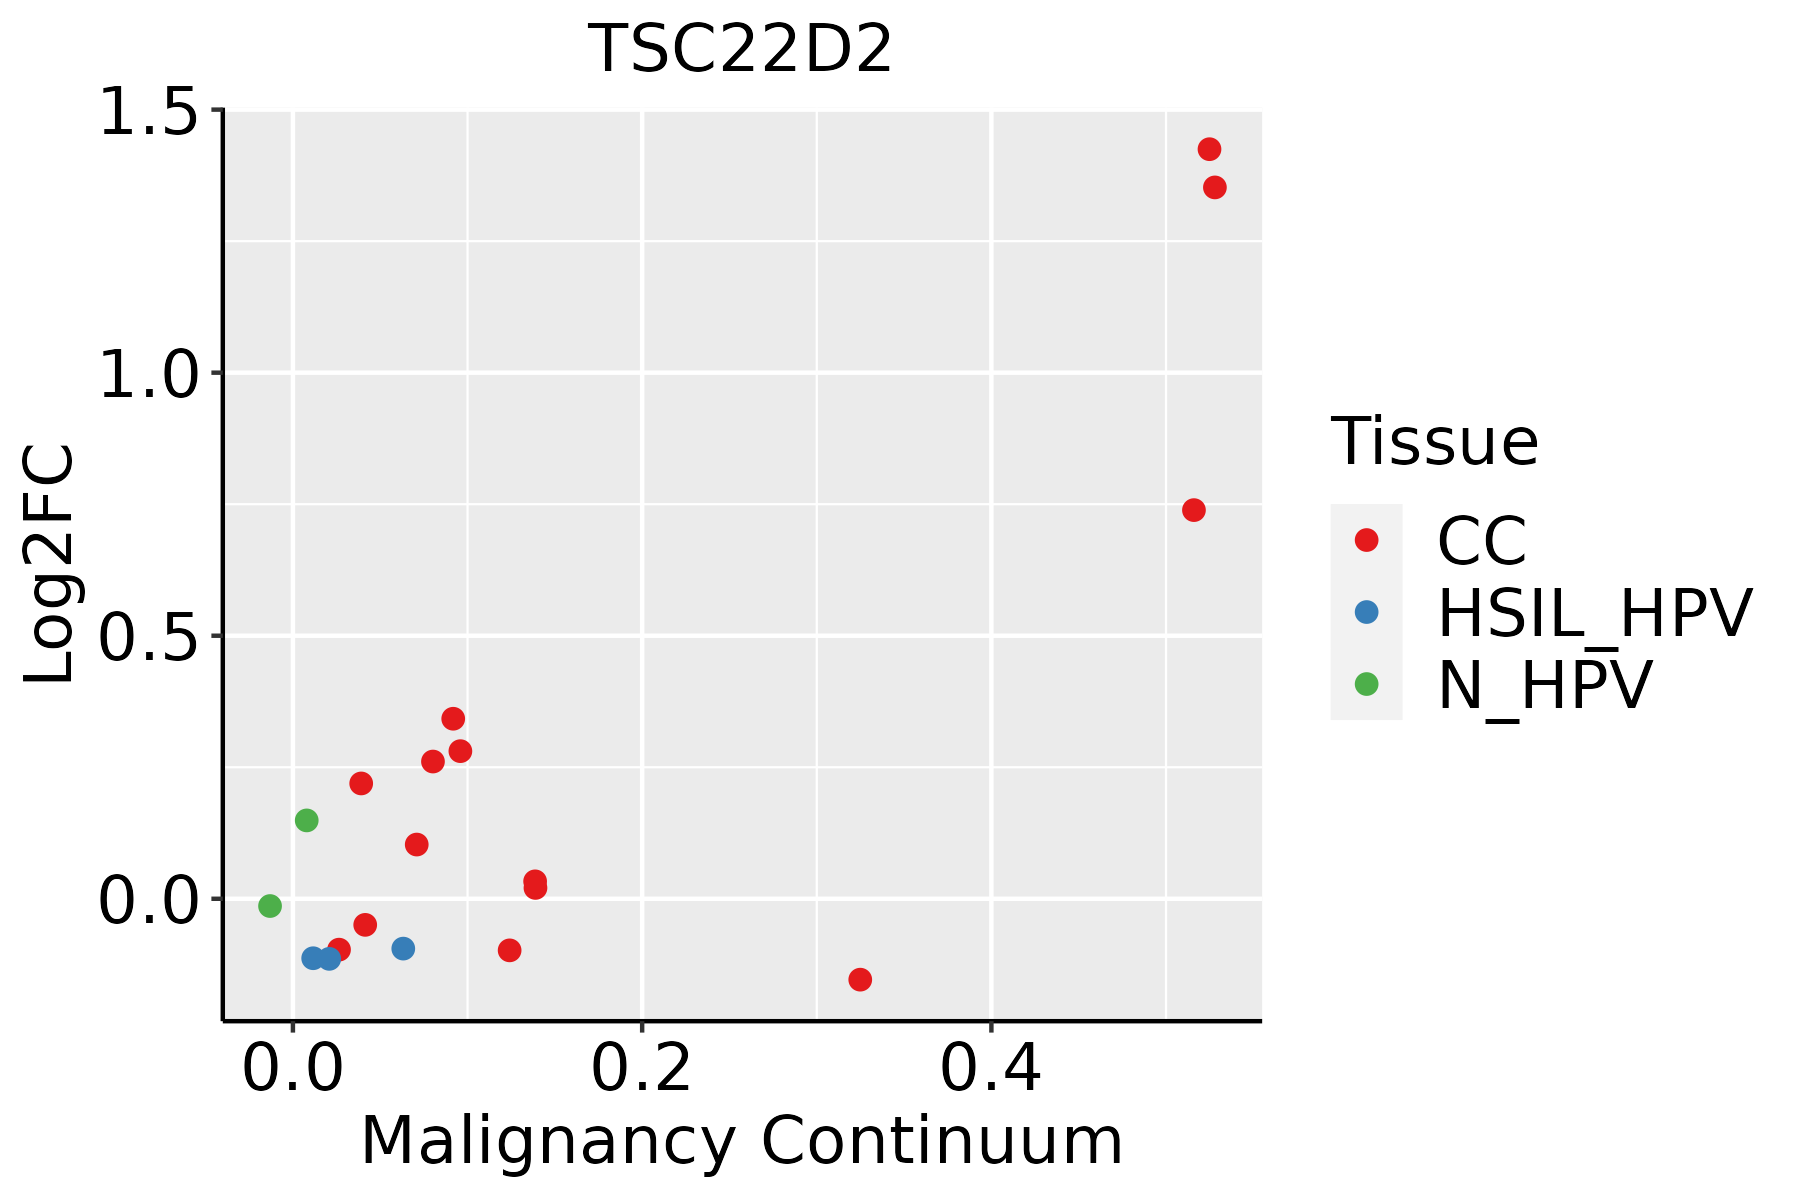 | CC: Cervix cancer |
| HSIL_HPV: HPV-infected high-grade squamous intraepithelial lesions | ||
| N_HPV: HPV-infected normal cervix | ||
| Colorectum (GSE201348) | 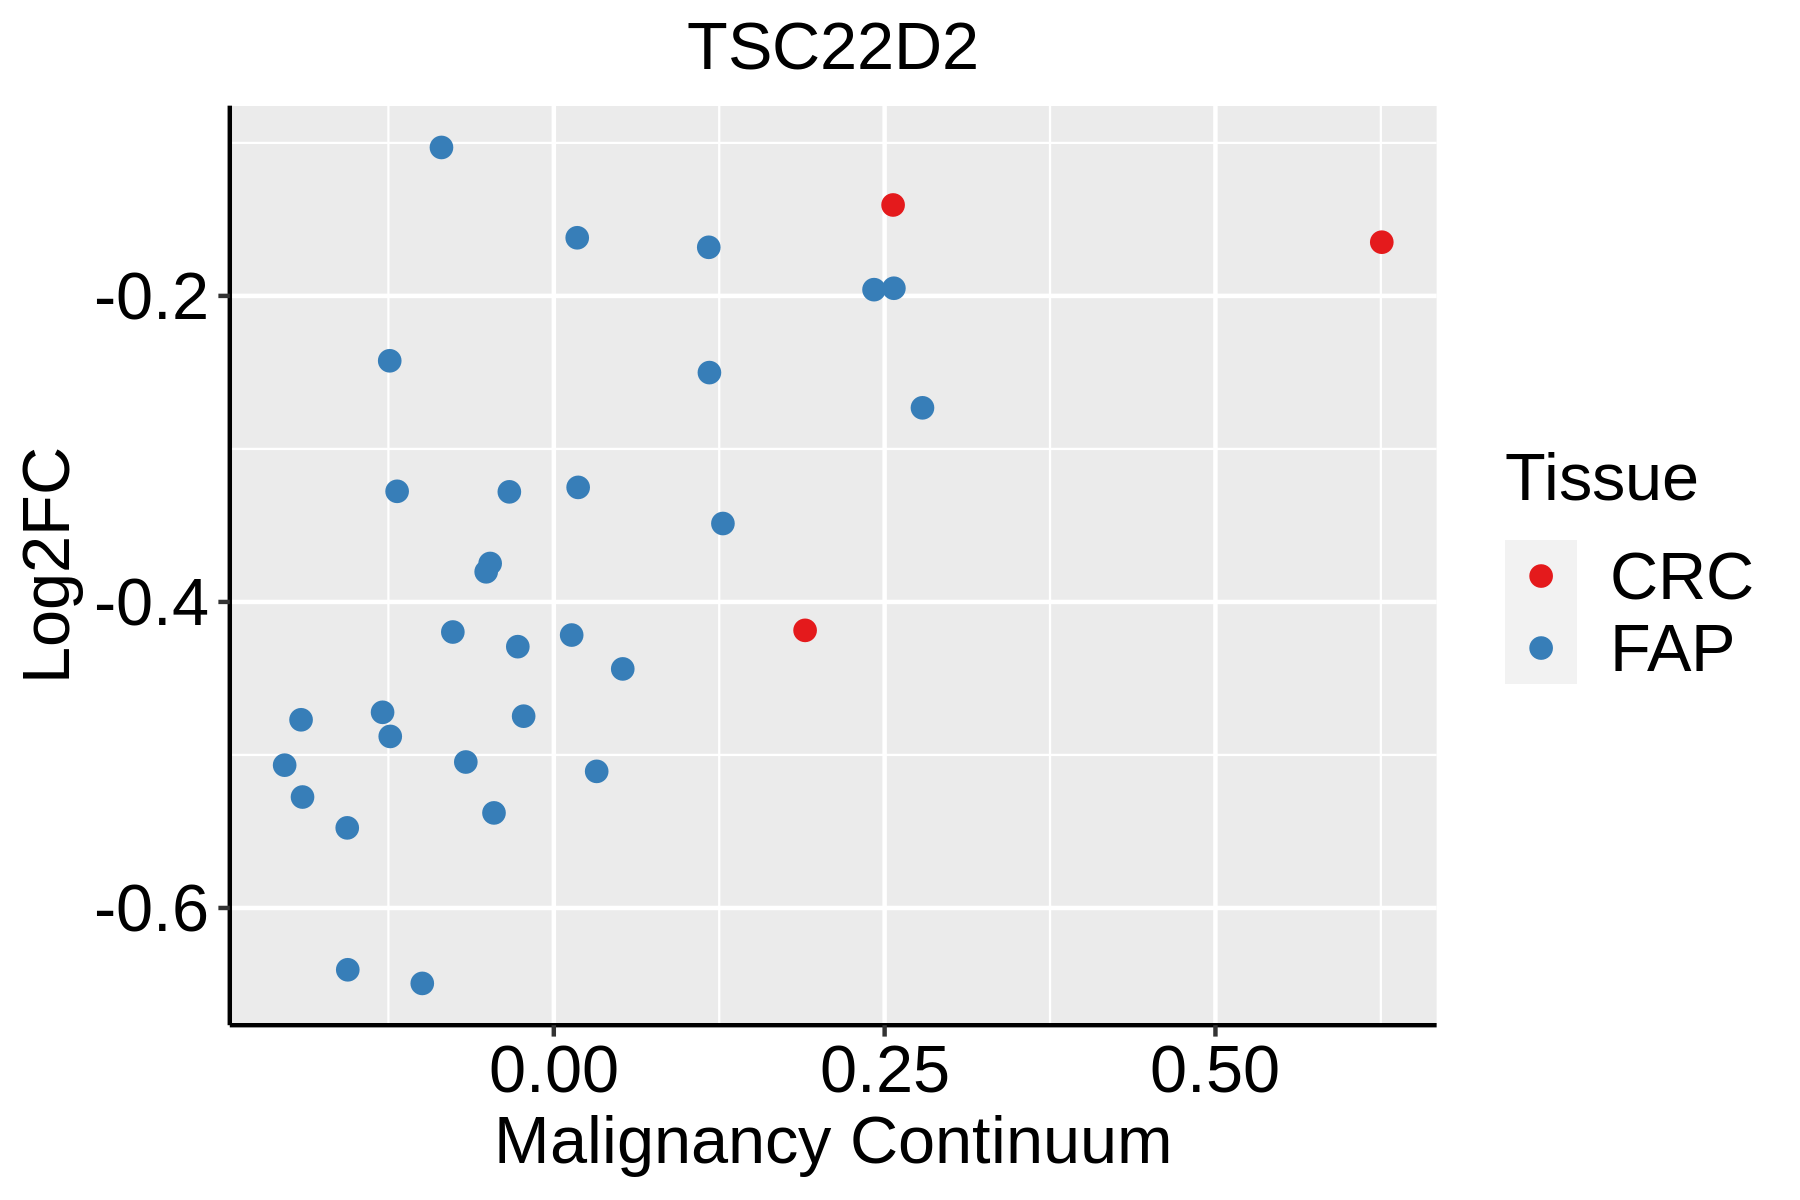 | FAP: Familial adenomatous polyposis |
| CRC: Colorectal cancer | ||
| Colorectum (HTA11) |  | AD: Adenomas |
| SER: Sessile serrated lesions | ||
| MSI-H: Microsatellite-high colorectal cancer | ||
| MSS: Microsatellite stable colorectal cancer | ||
| Endometrium | 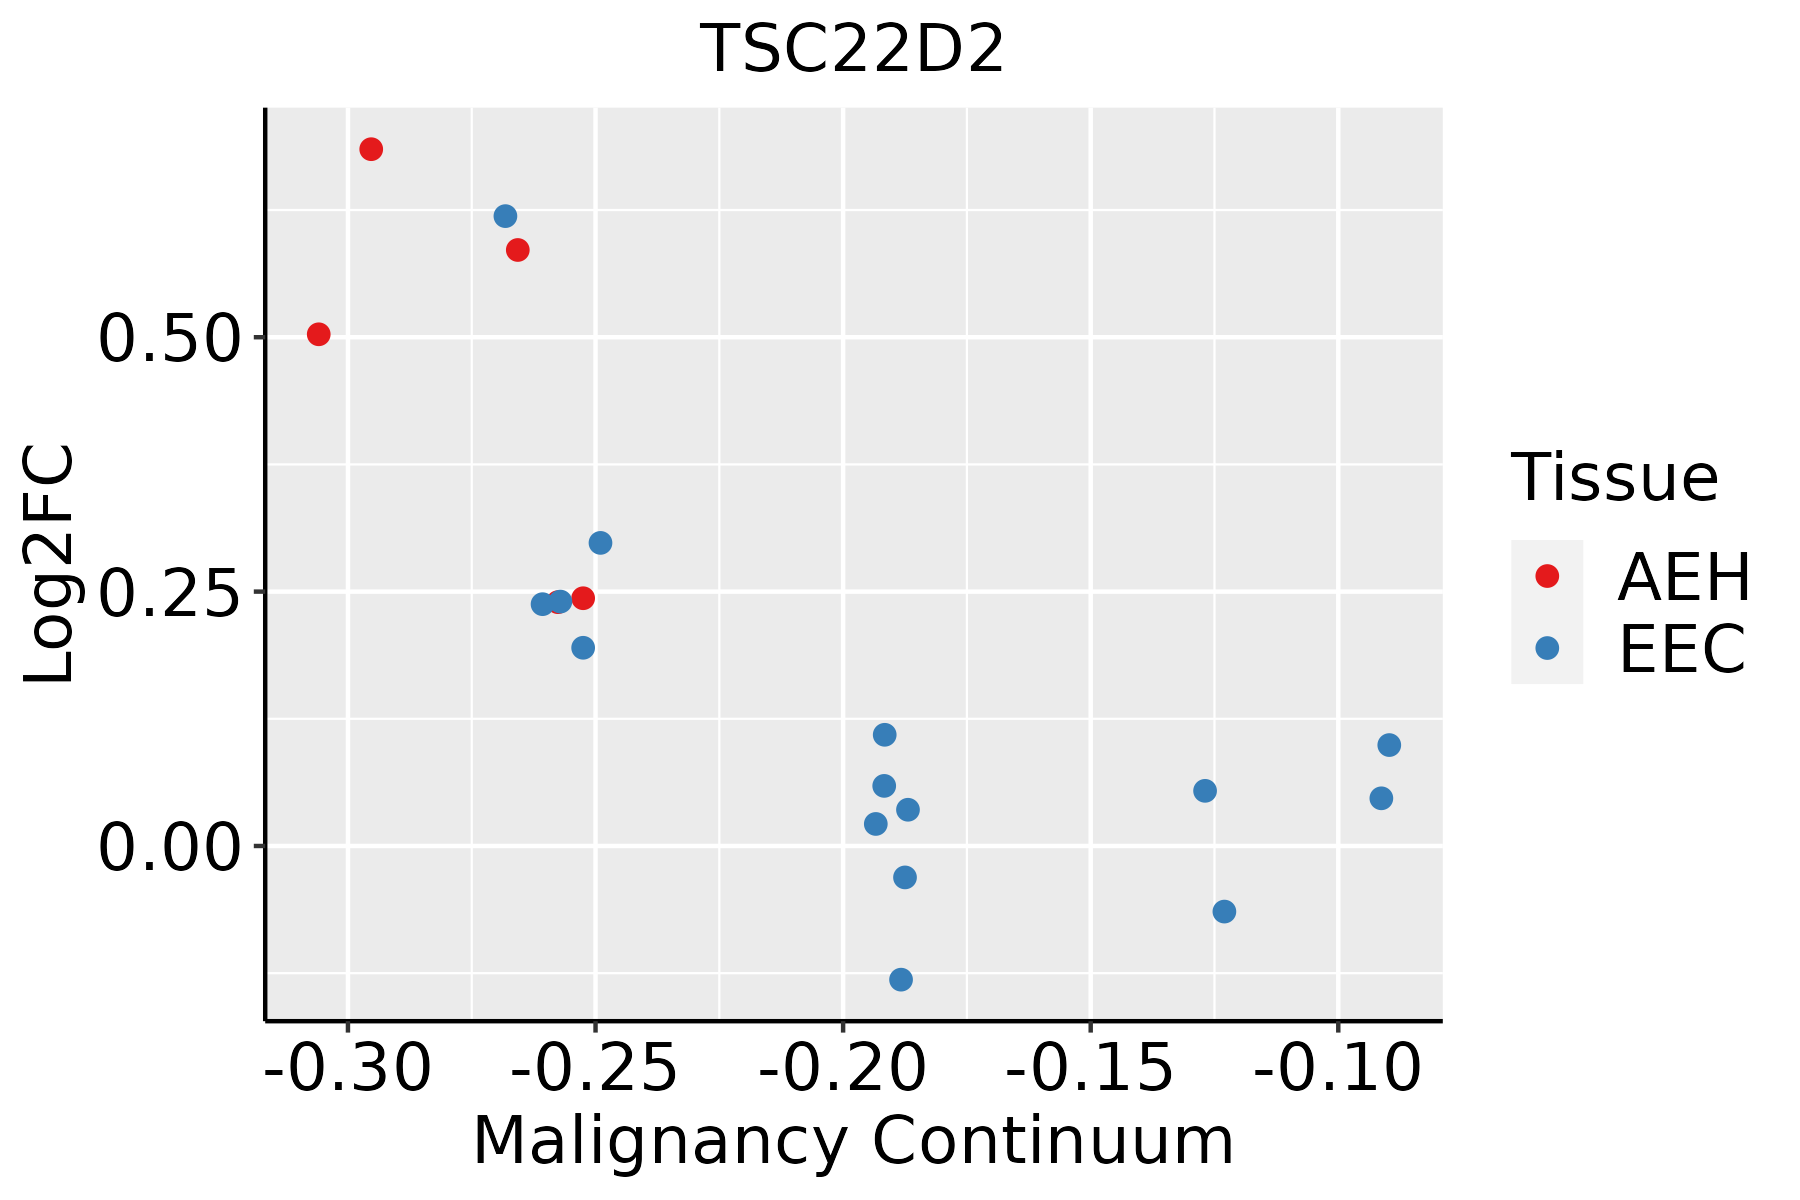 | AEH: Atypical endometrial hyperplasia |
| EEC: Endometrioid Cancer | ||
| Esophagus |  | ESCC: Esophageal squamous cell carcinoma |
| HGIN: High-grade intraepithelial neoplasias | ||
| LGIN: Low-grade intraepithelial neoplasias | ||
| Liver | 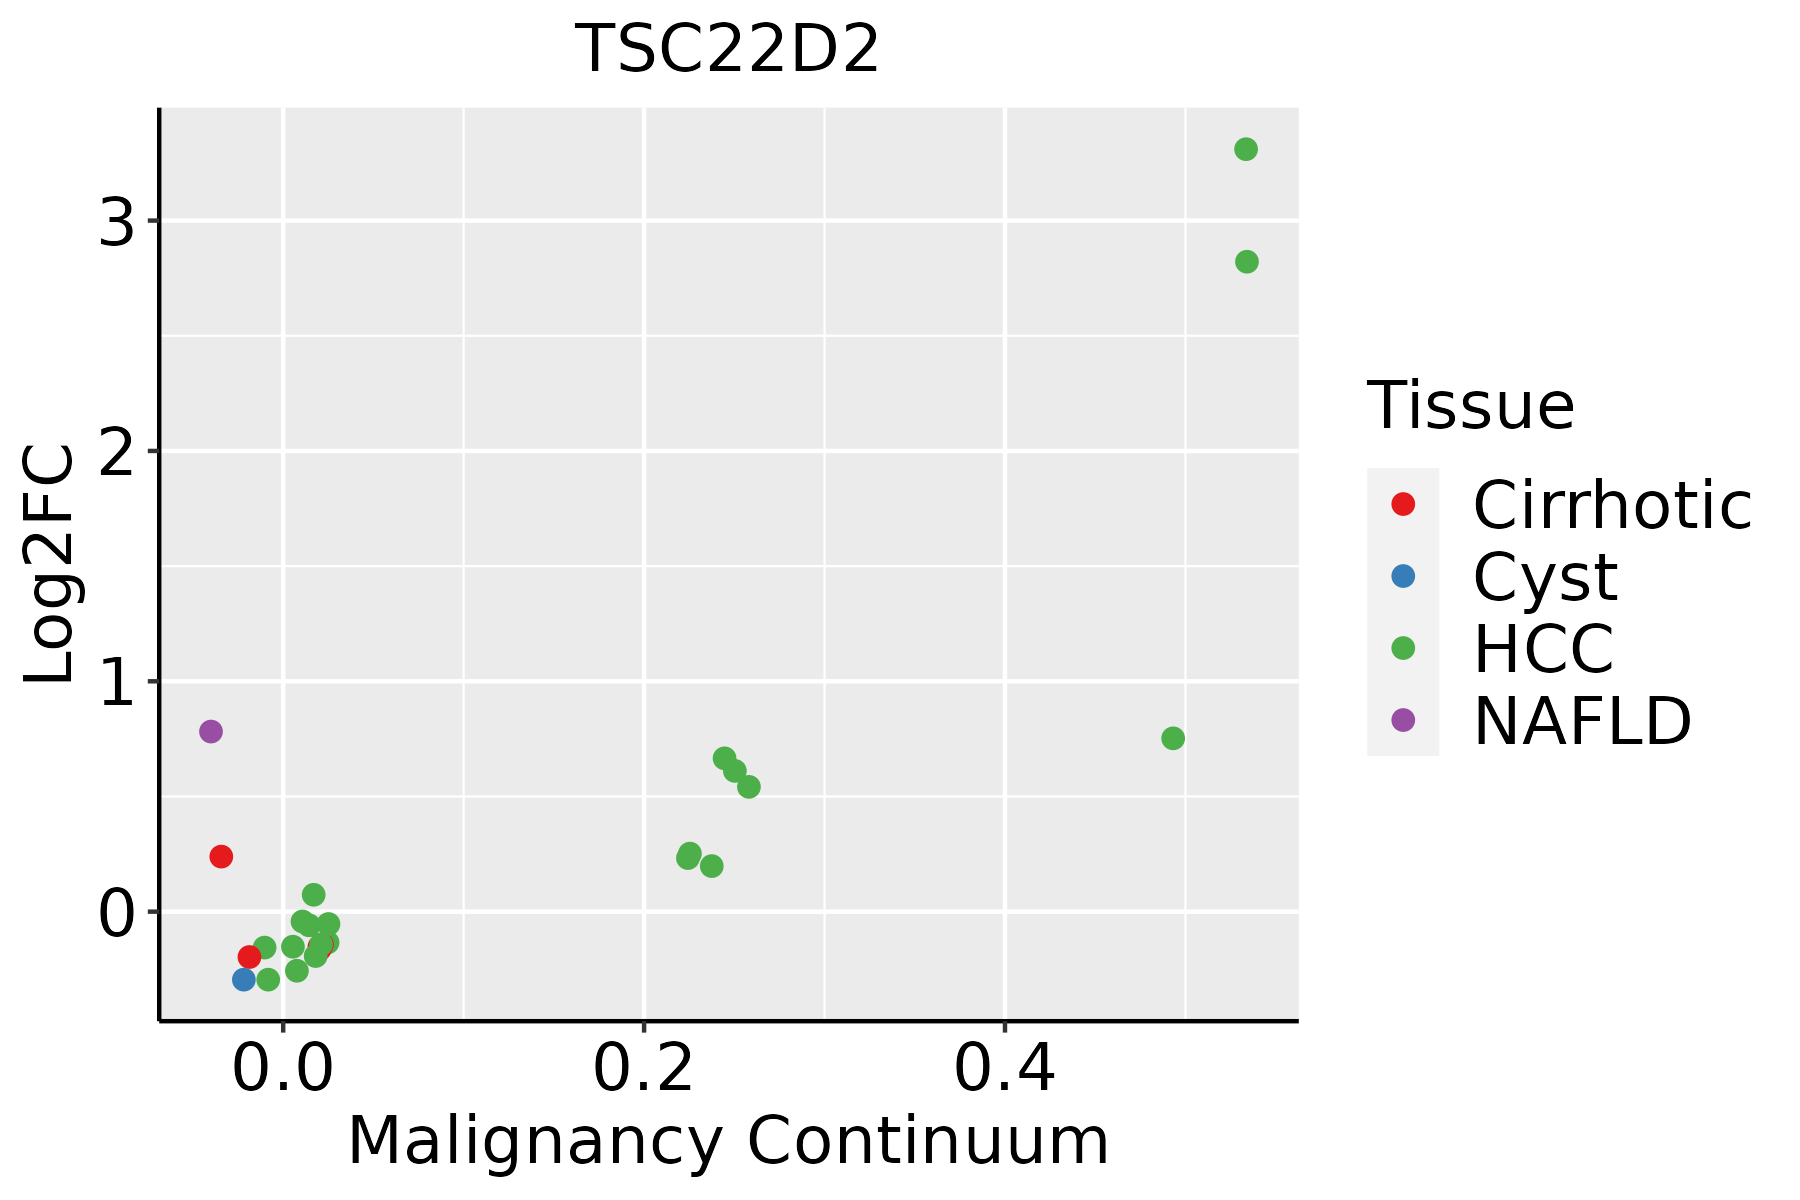 | HCC: Hepatocellular carcinoma |
| NAFLD: Non-alcoholic fatty liver disease | ||
| Lung | 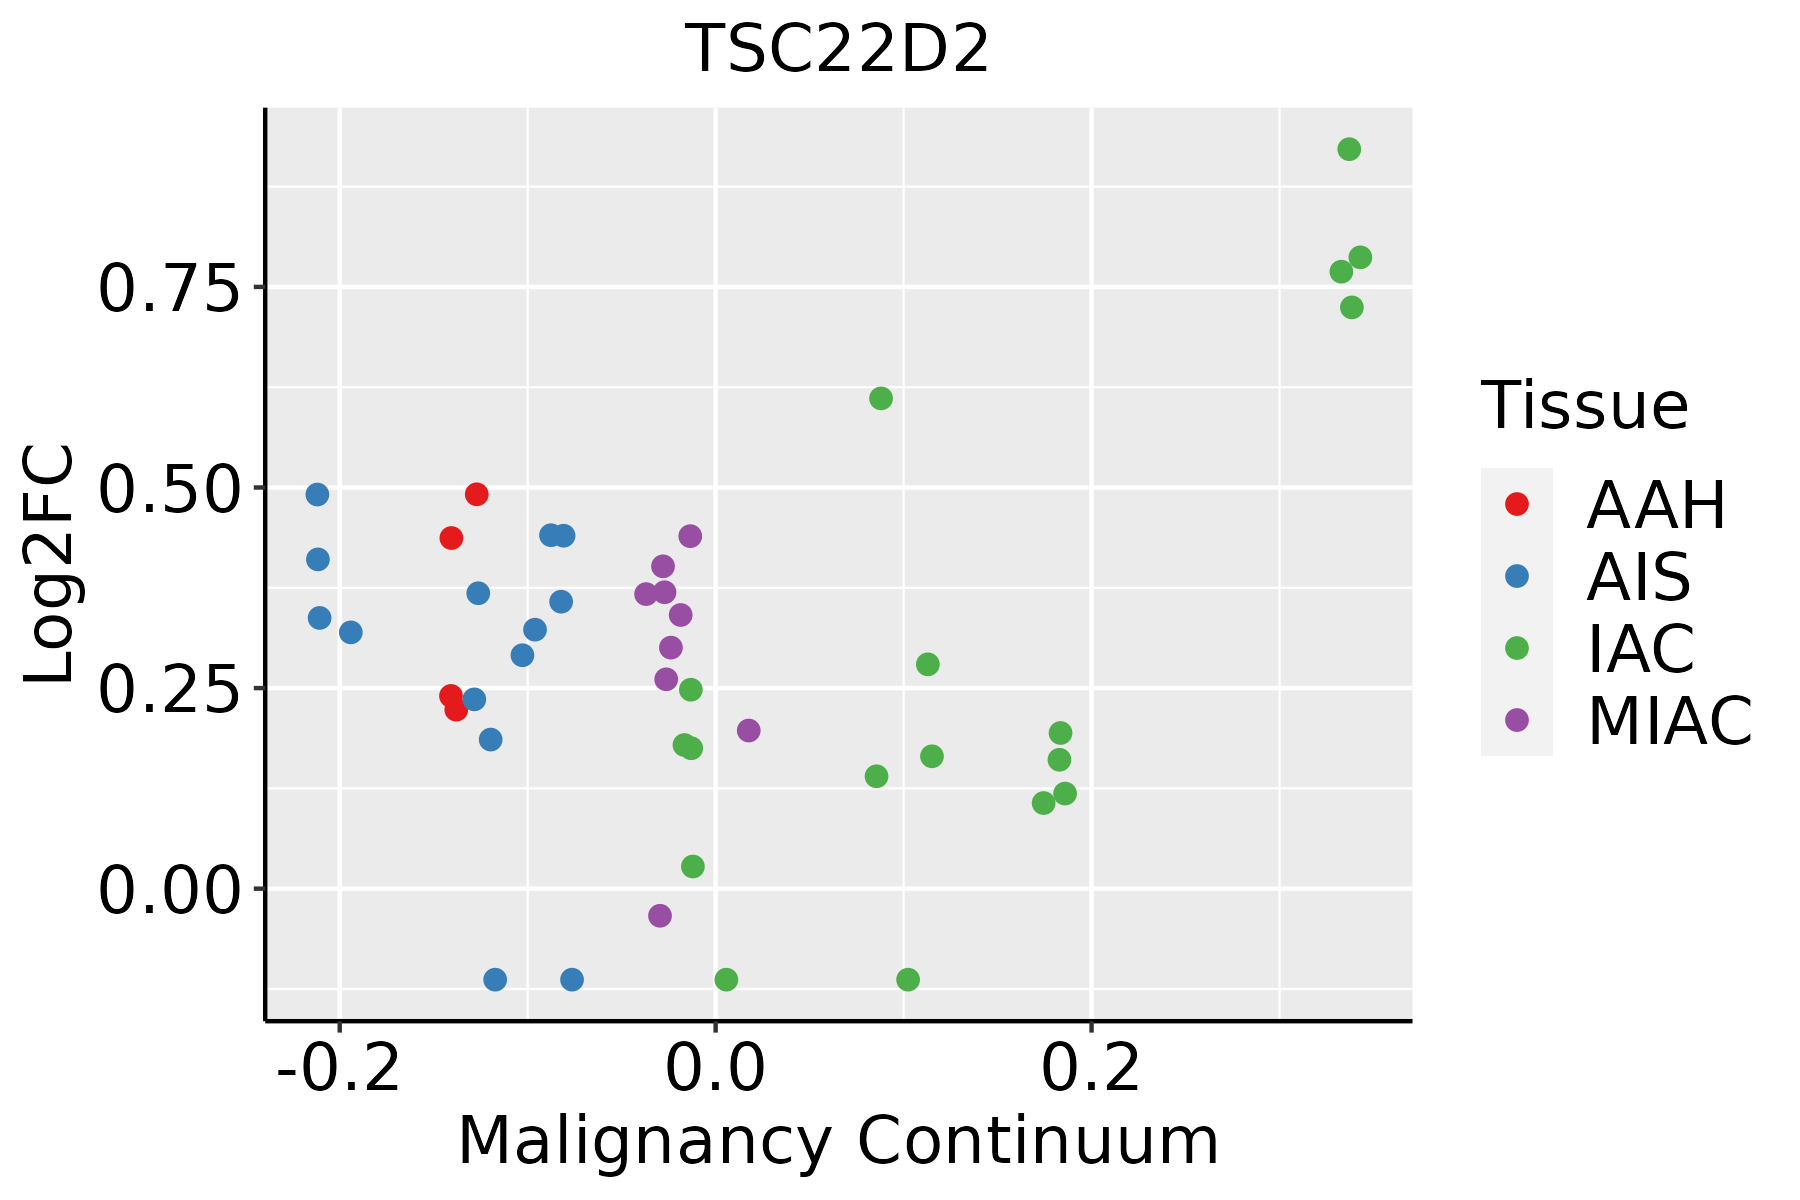 | AAH: Atypical adenomatous hyperplasia |
| AIS: Adenocarcinoma in situ | ||
| IAC: Invasive lung adenocarcinoma | ||
| MIA: Minimally invasive adenocarcinoma | ||
| Oral Cavity | 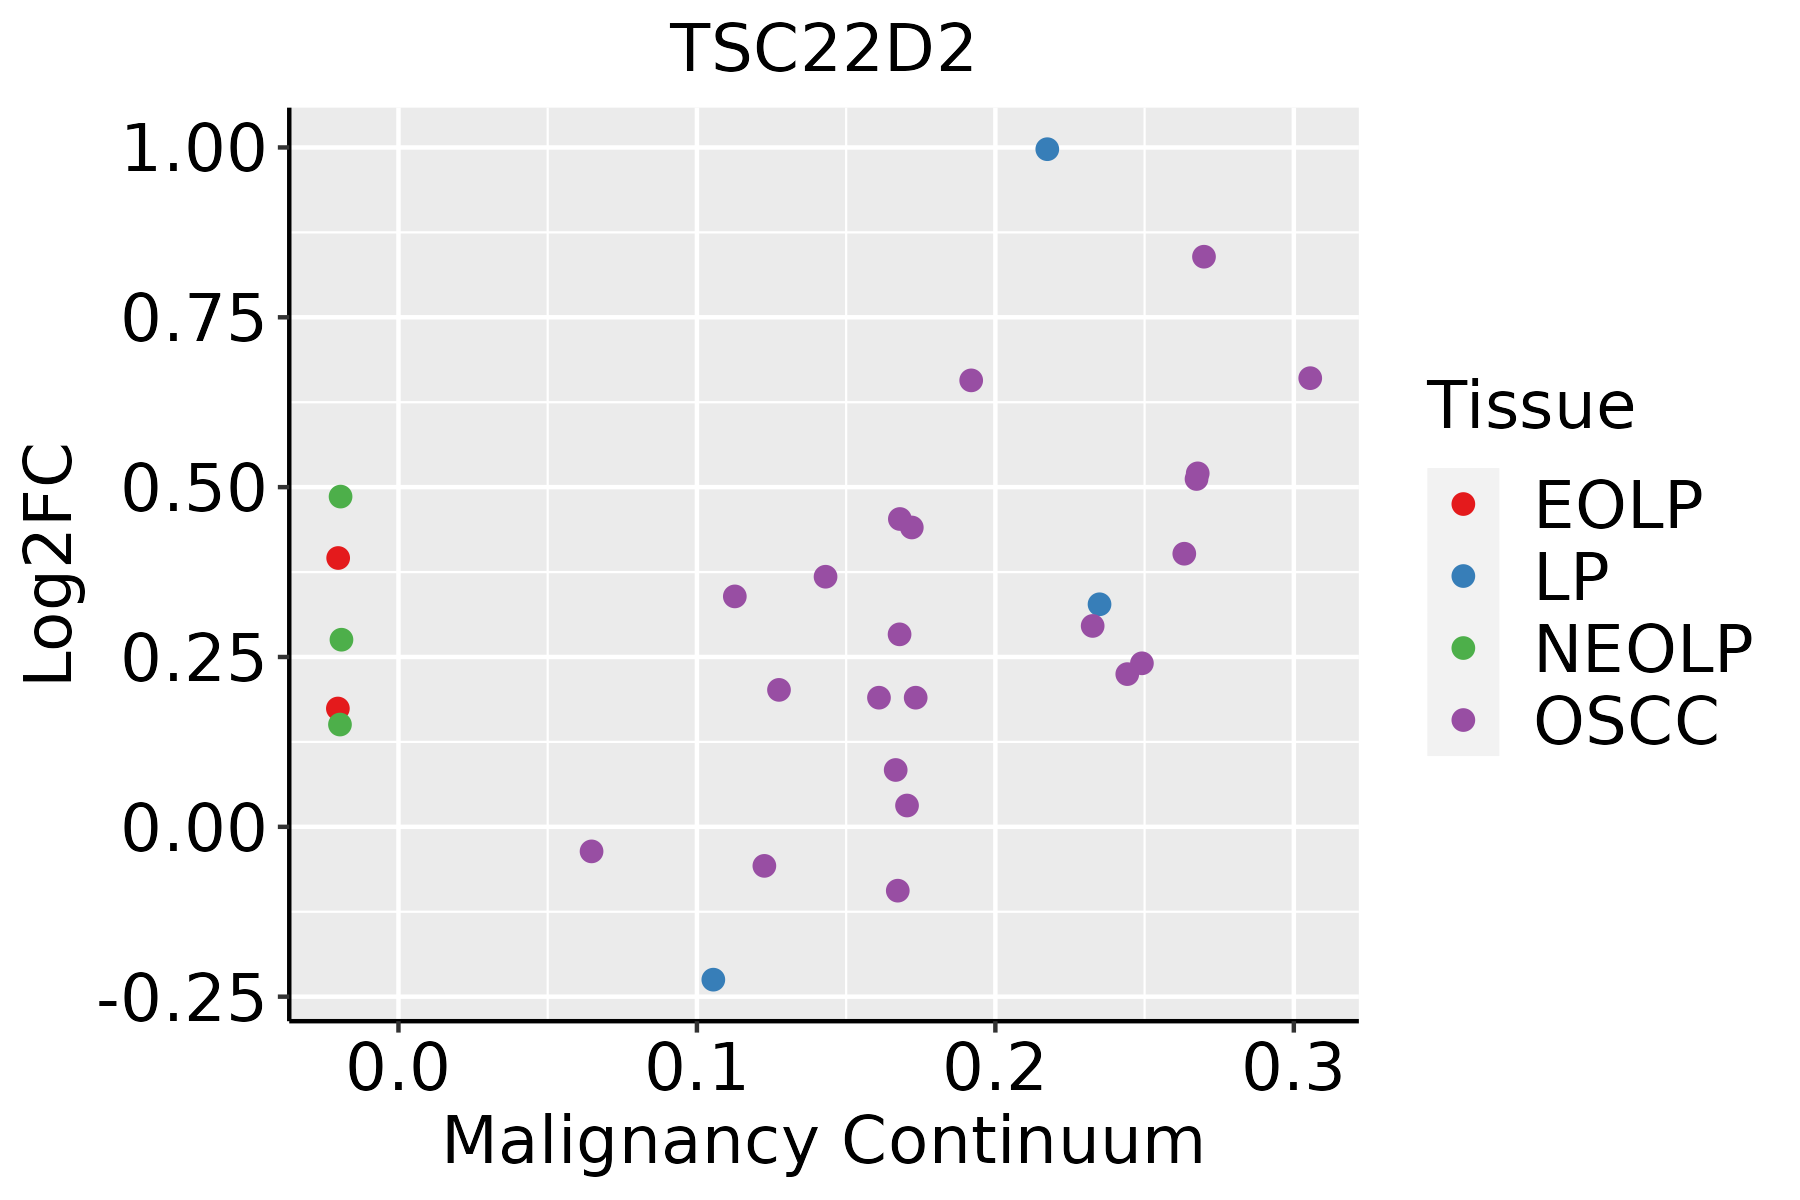 | EOLP: Erosive Oral lichen planus |
| LP: leukoplakia | ||
| NEOLP: Non-erosive oral lichen planus | ||
| OSCC: Oral squamous cell carcinoma | ||
| Prostate |  | BPH: Benign Prostatic Hyperplasia |
| ∗log2FC in expression of this searched gene in stem-like cells from each diseased tissue sample relative to stem-like cells in normal samples in each tissue plotted against the malignancy continuum. Samples are colored based on if they are from different disease stage. |
Top |
Malignant transformation related pathway analysis |
| Find out the enriched GO biological processes and KEGG pathways involved in transition from healthy to precancer to cancer |
| Tissue | Disease Stage | Enriched GO biological Processes |
| Colorectum | AD |  |
| Colorectum | SER |  |
| Colorectum | MSS |  |
| Colorectum | MSI-H |  |
| Colorectum | FAP |  |
| ∗Top 15 enriched GO BP terms are showed in the bar plot of each disease state in each tissue. Each row represents a significant GO biological process which is colored according to the -log10(p.adjust). |
| Page: 1 2 3 4 5 6 7 8 9 |
| GO ID | Tissue | Disease Stage | Description | Gene Ratio | Bg Ratio | pvalue | p.adjust | Count |
| GO:0006970 | Colorectum | SER | response to osmotic stress | 23/2897 | 84/18723 | 3.61e-03 | 3.03e-02 | 23 |
| GO:00069701 | Colorectum | FAP | response to osmotic stress | 25/2622 | 84/18723 | 1.43e-04 | 2.24e-03 | 25 |
| GO:00069704 | Endometrium | AEH | response to osmotic stress | 18/2100 | 84/18723 | 4.94e-03 | 3.12e-02 | 18 |
| GO:000697012 | Endometrium | EEC | response to osmotic stress | 19/2168 | 84/18723 | 2.98e-03 | 2.10e-02 | 19 |
| GO:00069707 | Esophagus | ESCC | response to osmotic stress | 57/8552 | 84/18723 | 3.26e-05 | 2.70e-04 | 57 |
| GO:00069703 | Liver | NAFLD | response to osmotic stress | 20/1882 | 84/18723 | 1.95e-04 | 3.41e-03 | 20 |
| GO:000697011 | Liver | Cirrhotic | response to osmotic stress | 34/4634 | 84/18723 | 1.06e-03 | 7.40e-03 | 34 |
| GO:00069702 | Liver | HCC | response to osmotic stress | 52/7958 | 84/18723 | 2.58e-04 | 1.92e-03 | 52 |
| GO:00069706 | Oral cavity | OSCC | response to osmotic stress | 50/7305 | 84/18723 | 1.11e-04 | 8.15e-04 | 50 |
| GO:000697014 | Oral cavity | LP | response to osmotic stress | 32/4623 | 84/18723 | 4.36e-03 | 2.79e-02 | 32 |
| GO:00069705 | Prostate | BPH | response to osmotic stress | 27/3107 | 84/18723 | 3.35e-04 | 2.52e-03 | 27 |
| GO:000697013 | Prostate | Tumor | response to osmotic stress | 26/3246 | 84/18723 | 1.58e-03 | 9.63e-03 | 26 |
| Page: 1 |
| Pathway ID | Tissue | Disease Stage | Description | Gene Ratio | Bg Ratio | pvalue | p.adjust | qvalue | Count |
| Page: 1 |
Top |
Cell-cell communication analysis |
| Identification of potential cell-cell interactions between two cell types and their ligand-receptor pairs for different disease states |
| Ligand | Receptor | LRpair | Pathway | Tissue | Disease Stage |
| Page: 1 |
Top |
Single-cell gene regulatory network inference analysis |
| Find out the significant the regulons (TFs) and the target genes of each regulon across cell types for different disease states |
| TF | Cell Type | Tissue | Disease Stage | Target Gene | RSS | Regulon Activity |
| ∗The dot plots of a searched regulon are shown for all cell subpopulations in each disease state of each tissue based on the regulon specific score inferred using pySCENIC and by calculating the average expression. |
| Page: 1 |
Top |
Somatic mutation of malignant transformation related genes |
| Annotation of somatic variants for genes involved in malignant transformation |
| Hugo Symbol | Variant Class | Variant Classification | dbSNP RS | HGVSc | HGVSp | HGVSp Short | SWISSPROT | BIOTYPE | SIFT | PolyPhen | Tumor Sample Barcode | Tissue | Histology | Sex | Age | Stage | Therapy Types | Drugs | Outcome |
| TSC22D2 | SNV | Missense_Mutation | c.2204N>A | p.Ser735Tyr | p.S735Y | O75157 | protein_coding | deleterious(0) | probably_damaging(0.996) | TCGA-AN-A046-01 | Breast | breast invasive carcinoma | Female | >=65 | I/II | Unknown | Unknown | SD | |
| TSC22D2 | SNV | Missense_Mutation | c.235N>C | p.Glu79Gln | p.E79Q | O75157 | protein_coding | tolerated(0.07) | probably_damaging(0.984) | TCGA-E2-A152-01 | Breast | breast invasive carcinoma | Female | <65 | I/II | Targeted Molecular therapy | trastuzumab | PD | |
| TSC22D2 | SNV | Missense_Mutation | c.205N>C | p.Glu69Gln | p.E69Q | O75157 | protein_coding | deleterious(0) | probably_damaging(0.991) | TCGA-DR-A0ZM-01 | Cervix | cervical & endocervical cancer | Female | <65 | III/IV | Unspecific | Cisplatin | SD | |
| TSC22D2 | SNV | Missense_Mutation | novel | c.250N>A | p.Val84Ile | p.V84I | O75157 | protein_coding | tolerated(0.06) | benign(0.007) | TCGA-VS-A8QH-01 | Cervix | cervical & endocervical cancer | Female | >=65 | I/II | Chemotherapy | gemcitabine | PD |
| TSC22D2 | SNV | Missense_Mutation | c.805N>G | p.Phe269Val | p.F269V | O75157 | protein_coding | tolerated(0.1) | benign(0.222) | TCGA-AA-3510-01 | Colorectum | colon adenocarcinoma | Male | >=65 | I/II | Unknown | Unknown | SD | |
| TSC22D2 | SNV | Missense_Mutation | novel | c.293N>T | p.Ala98Val | p.A98V | O75157 | protein_coding | tolerated(0.08) | benign(0) | TCGA-AA-3947-01 | Colorectum | colon adenocarcinoma | Female | <65 | I/II | Unknown | Unknown | SD |
| TSC22D2 | SNV | Missense_Mutation | c.2096N>T | p.Ser699Ile | p.S699I | O75157 | protein_coding | deleterious(0) | probably_damaging(0.998) | TCGA-AA-3977-01 | Colorectum | colon adenocarcinoma | Male | >=65 | I/II | Unknown | Unknown | SD | |
| TSC22D2 | SNV | Missense_Mutation | c.2204N>A | p.Ser735Tyr | p.S735Y | O75157 | protein_coding | deleterious(0) | probably_damaging(0.996) | TCGA-AA-A00N-01 | Colorectum | colon adenocarcinoma | Male | >=65 | I/II | Unknown | Unknown | PD | |
| TSC22D2 | SNV | Missense_Mutation | novel | c.237G>T | p.Glu79Asp | p.E79D | O75157 | protein_coding | tolerated(0.06) | possibly_damaging(0.727) | TCGA-AA-A010-01 | Colorectum | colon adenocarcinoma | Female | <65 | I/II | Chemotherapy | folinic | CR |
| TSC22D2 | SNV | Missense_Mutation | novel | c.565G>A | p.Asp189Asn | p.D189N | O75157 | protein_coding | deleterious(0.01) | probably_damaging(0.909) | TCGA-AA-A02E-01 | Colorectum | colon adenocarcinoma | Female | >=65 | III/IV | Unknown | Unknown | PD |
| Page: 1 2 3 4 5 6 |
Top |
Related drugs of malignant transformation related genes |
| Identification of chemicals and drugs interact with genes involved in malignant transfromation |
| (DGIdb 4.0) |
| Entrez ID | Symbol | Category | Interaction Types | Drug Claim Name | Drug Name | PMIDs |
| Page: 1 |

Copyright 2023-Present -The University of Texas Health Science Center at Houston |