| Entrez ID | Symbol | Replicates | Species | Organ | Tissue | Adj P-value | Log2FC | Malignancy |
| 79002 | TRIR | GSM5353215_PA_AUG_PB_1B_S2 | Human | Prostate | Tumor | 6.15e-06 | -8.20e-01 | 0.1557 |
| 79002 | TRIR | GSM5353216_PA_PB1A_Pool_1_3_S50_L002 | Human | Prostate | Tumor | 5.12e-05 | -8.20e-01 | 0.159 |
| 79002 | TRIR | GSM5353217_PA_PB1A_Pool_2_S107_L004 | Human | Prostate | Tumor | 3.64e-02 | -8.20e-01 | 0.156 |
| 79002 | TRIR | GSM5353218_PA_PB1B_Pool_1_2_S74_L003 | Human | Prostate | Tumor | 9.11e-04 | -8.20e-01 | 0.1479 |
| 79002 | TRIR | GSM5353220_PA_PB1B_Pool_3_S51_L002 | Human | Prostate | Tumor | 5.12e-05 | -8.20e-01 | 0.1531 |
| 79002 | TRIR | GSM5353221_PA_PB2A_Pool_1_3_S25_L001 | Human | Prostate | Tumor | 7.05e-20 | -8.20e-01 | 0.1633 |
| 79002 | TRIR | GSM5353222_PA_PB2B_Pool_1_3_S52_L002 | Human | Prostate | Tumor | 8.48e-28 | -8.20e-01 | 0.1608 |
| 79002 | TRIR | GSM5353223_PA_PB2B_Pool_2_S26_L001 | Human | Prostate | Tumor | 7.53e-17 | -8.20e-01 | 0.1604 |
| 79002 | TRIR | GSM5353224_PA_PR5186_Pool_1_2_3_S27_L001 | Human | Prostate | Tumor | 3.97e-18 | -8.20e-01 | 0.1621 |
| 79002 | TRIR | GSM5353225_PA_PR5196-1_Pool_1_2_3_S53_L002 | Human | Prostate | Tumor | 1.72e-09 | -8.20e-01 | 0.1619 |
| 79002 | TRIR | GSM5353226_PA_PR5196-2_Pool_1_2_3_S54_L002 | Human | Prostate | Tumor | 6.15e-06 | -8.20e-01 | 0.159 |
| 79002 | TRIR | GSM5353227_PA_PR5199-193K_Pool_1_2_3_S55_L002 | Human | Prostate | Tumor | 7.37e-21 | -8.20e-01 | 0.1602 |
| 79002 | TRIR | GSM5353228_PA_PR5199-640K_Pool_1_3_S108_L004 | Human | Prostate | Tumor | 8.22e-03 | -8.20e-01 | 0.1537 |
| 79002 | TRIR | GSM5353232_PA_PR5249_T1_S3_L001 | Human | Prostate | Tumor | 1.05e-04 | -8.20e-01 | 0.1439 |
| 79002 | TRIR | GSM5353236_PA_PR5251_T1_S7_L001 | Human | Prostate | Tumor | 2.37e-10 | -8.20e-01 | 0.1608 |
| 79002 | TRIR | GSM5353237_PA_PR5251_T2_S8_L001 | Human | Prostate | Tumor | 6.15e-06 | -8.20e-01 | 0.1622 |
| 79002 | TRIR | GSM5353240_PA_PR5254_T1_S15_L001 | Human | Prostate | Tumor | 7.39e-32 | -8.20e-01 | 0.1575 |
| 79002 | TRIR | GSM5353243_PA_PR5261_T1_S23_L002 | Human | Prostate | Tumor | 6.65e-35 | -8.20e-01 | 0.1545 |
| 79002 | TRIR | GSM5353244_PA_PR5261_T2_S24_L002 | Human | Prostate | Tumor | 3.91e-27 | -8.20e-01 | 0.1569 |
| 79002 | TRIR | GSM5353247_PA_PR5269_3_S27_L002 | Human | Prostate | Tumor | 3.64e-02 | -8.20e-01 | 0.1532 |
| Tissue | Expression Dynamics | Abbreviation |
| Breast | 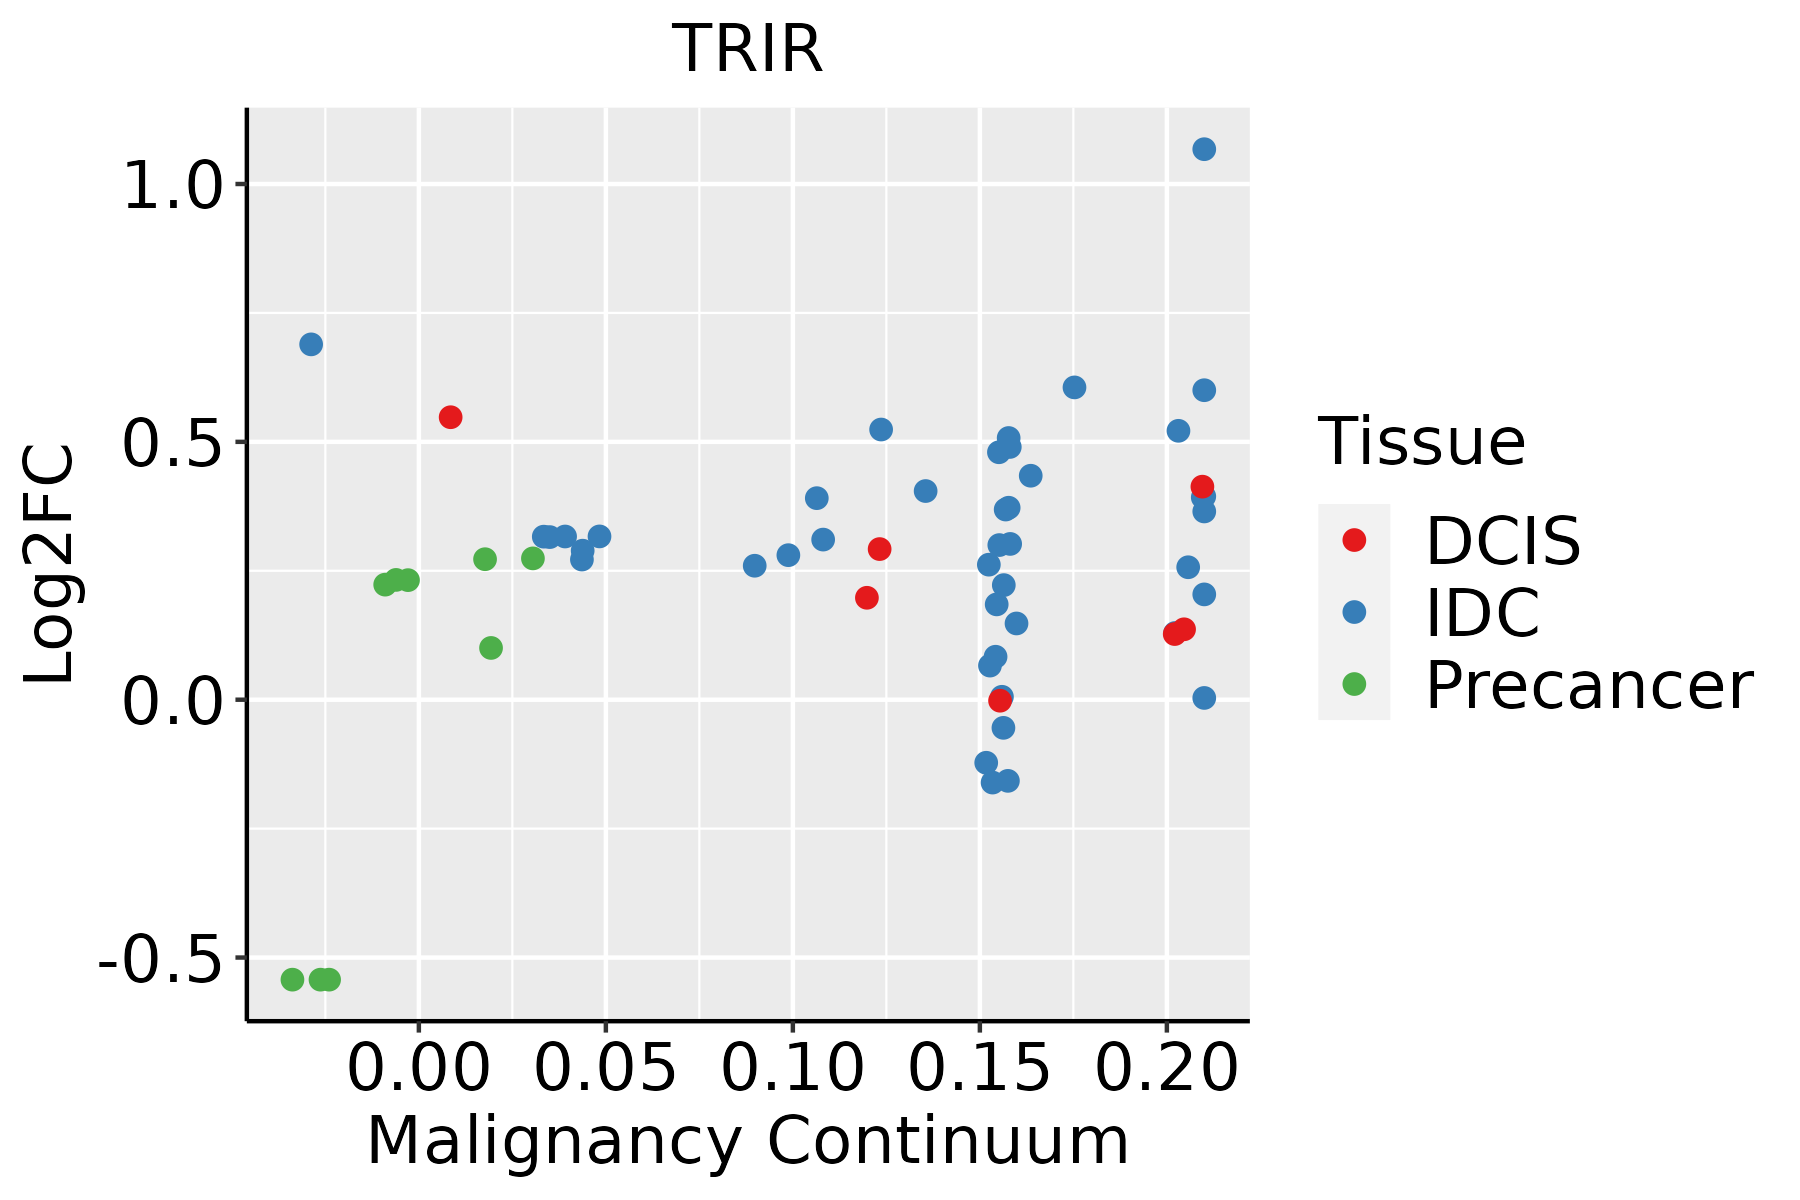 | IDC: Invasive ductal carcinoma |
| DCIS: Ductal carcinoma in situ |
| Precancer(BRCA1-mut): Precancerous lesion from BRCA1 mutation carriers |
| Cervix | 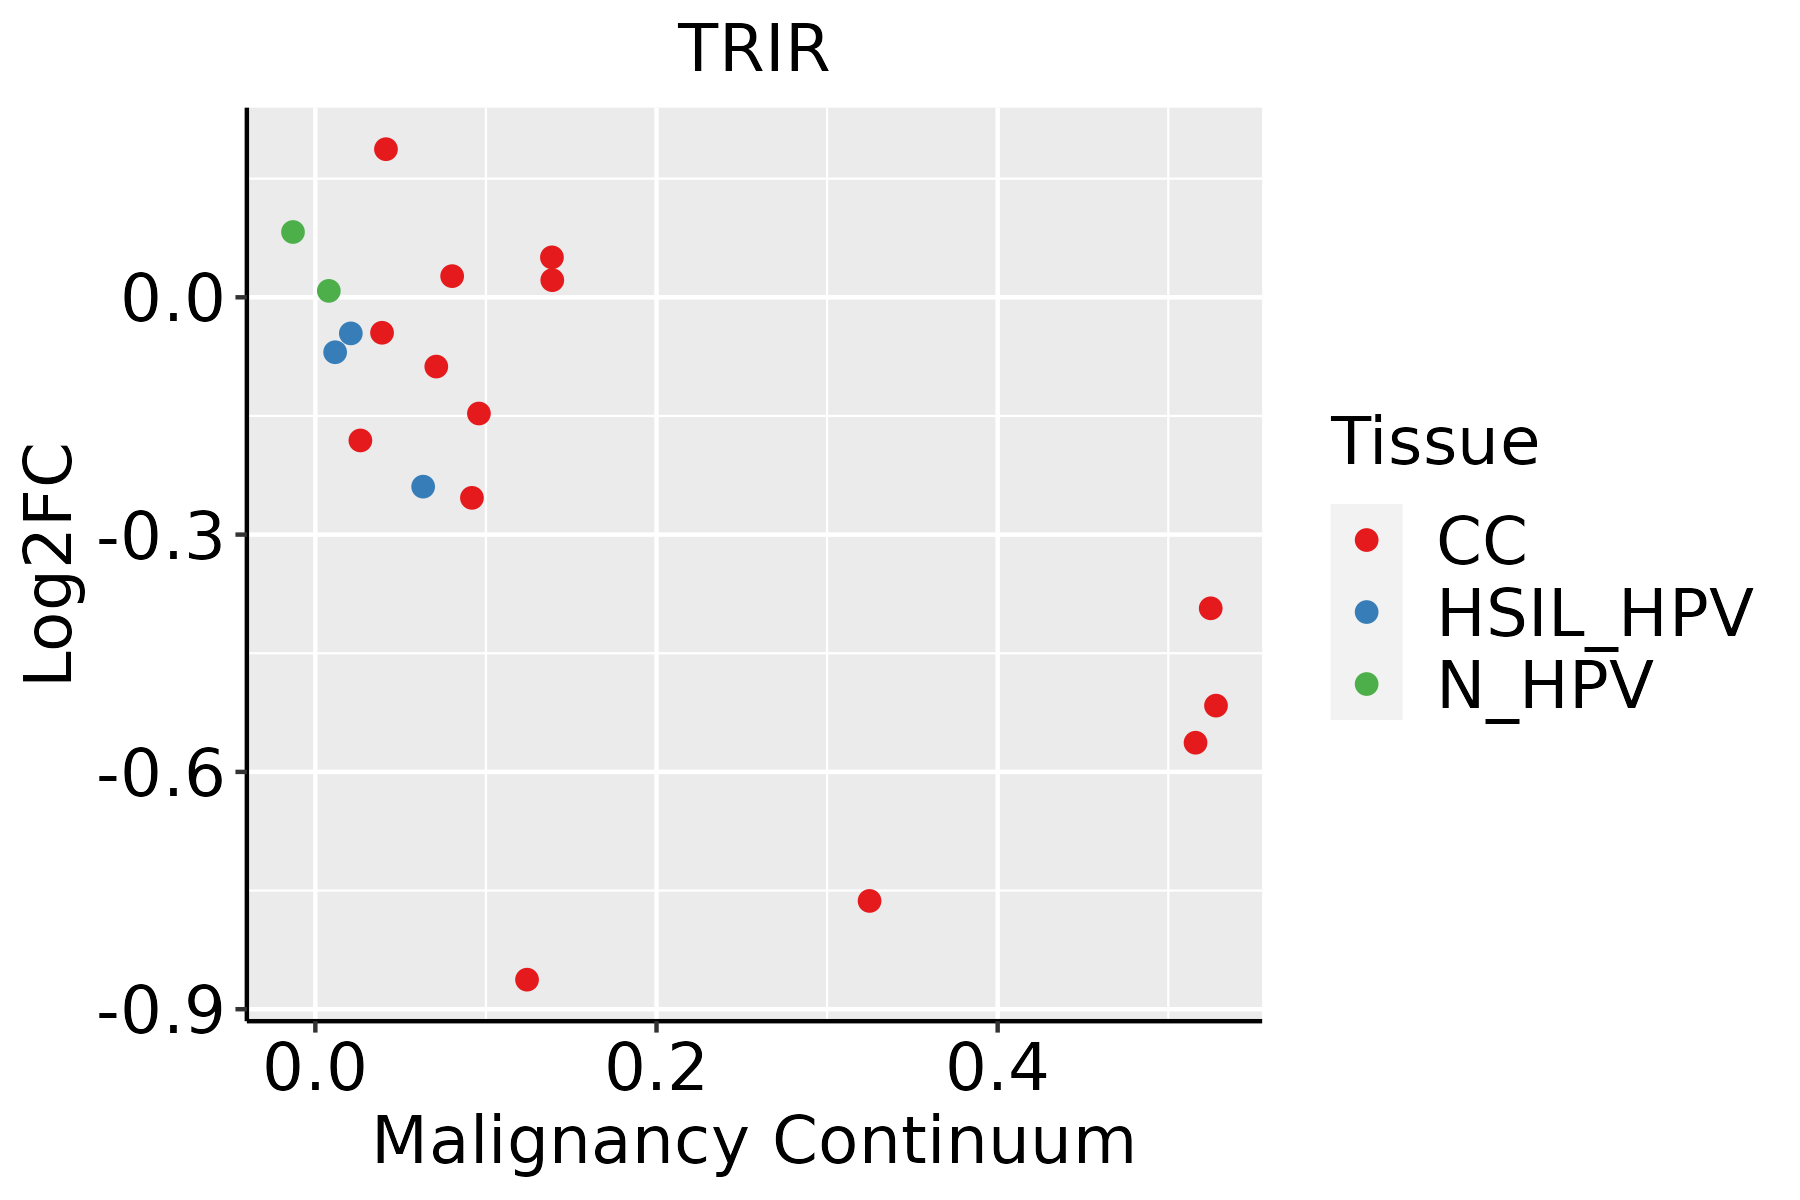 | CC: Cervix cancer |
| HSIL_HPV: HPV-infected high-grade squamous intraepithelial lesions |
| N_HPV: HPV-infected normal cervix |
| Colorectum (GSE201348) |  | FAP: Familial adenomatous polyposis |
| CRC: Colorectal cancer |
| Colorectum (HTA11) |  | AD: Adenomas |
| SER: Sessile serrated lesions |
| MSI-H: Microsatellite-high colorectal cancer |
| MSS: Microsatellite stable colorectal cancer |
| Endometrium | 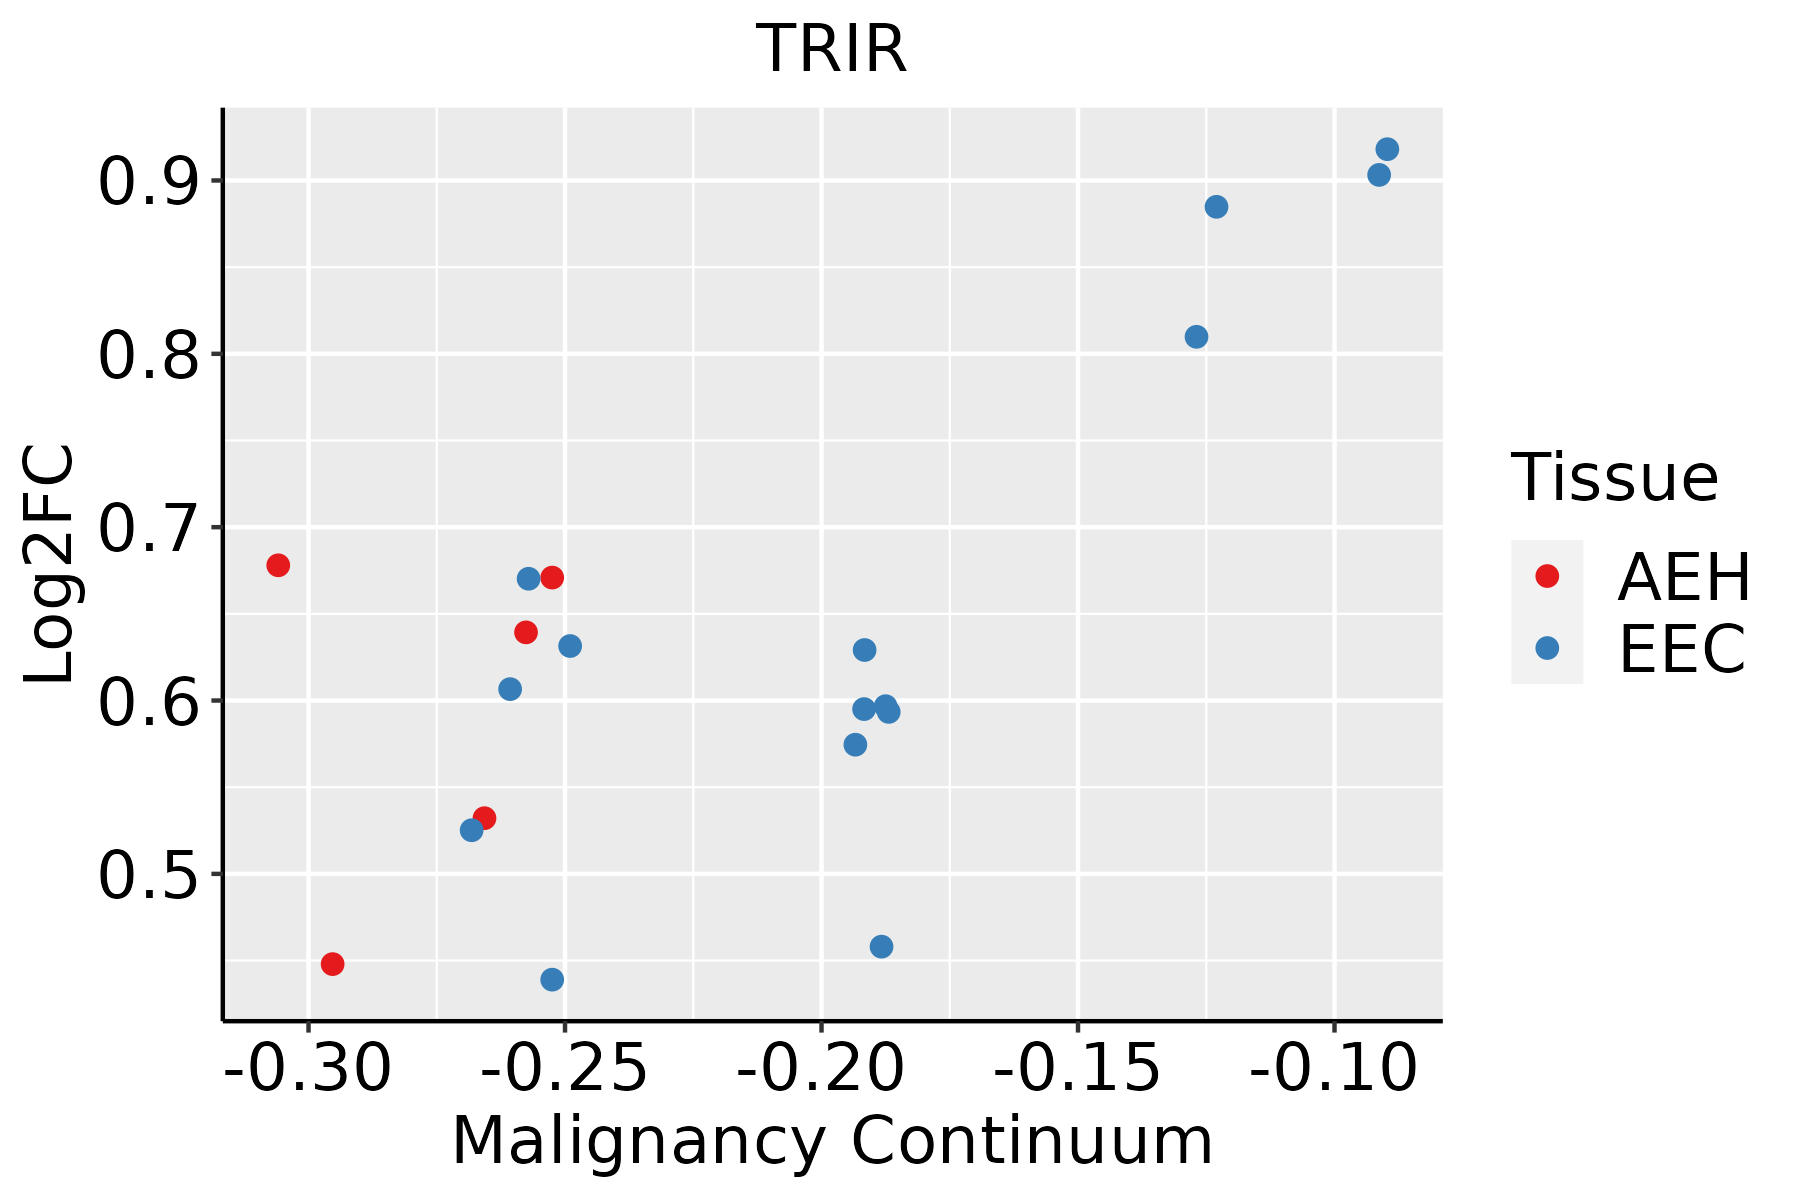 | AEH: Atypical endometrial hyperplasia |
| EEC: Endometrioid Cancer |
| Esophagus | 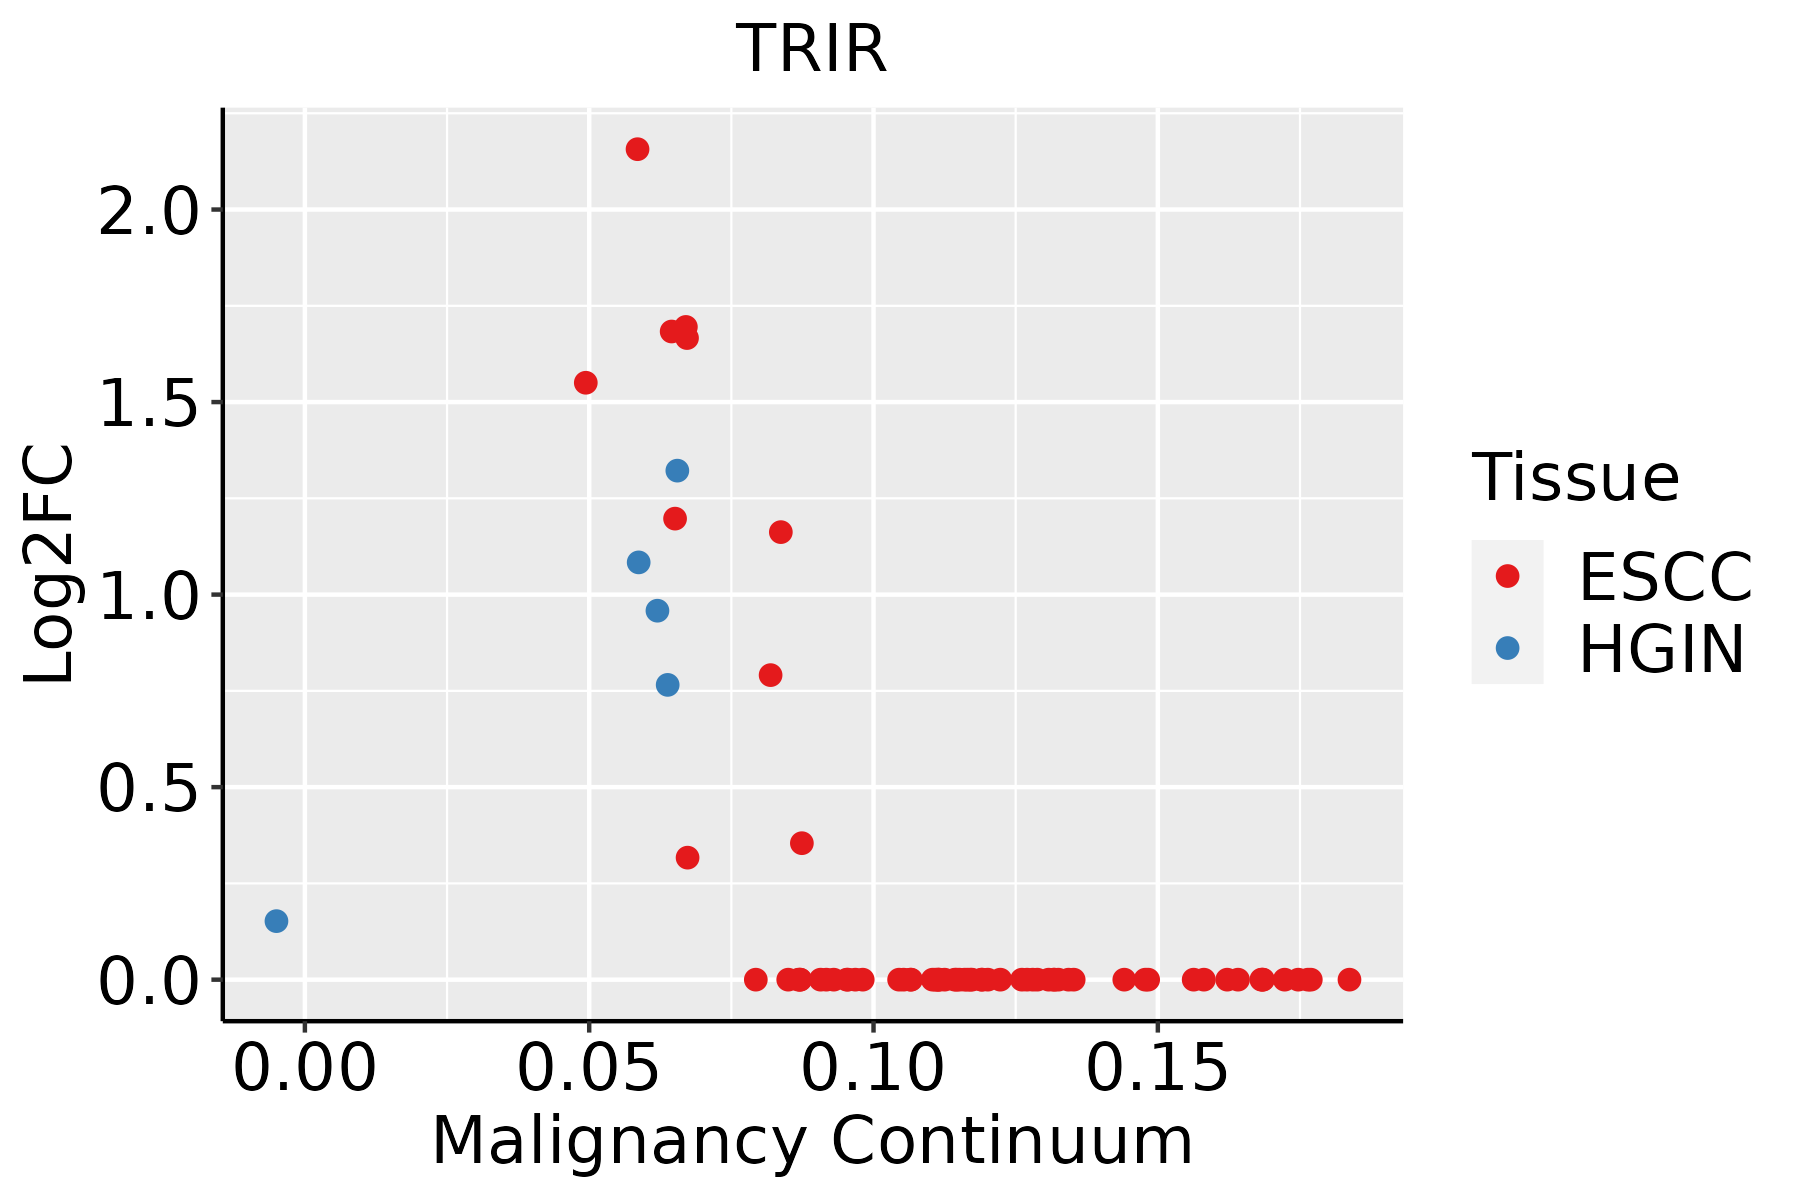 | ESCC: Esophageal squamous cell carcinoma |
| HGIN: High-grade intraepithelial neoplasias |
| LGIN: Low-grade intraepithelial neoplasias |
| GC | 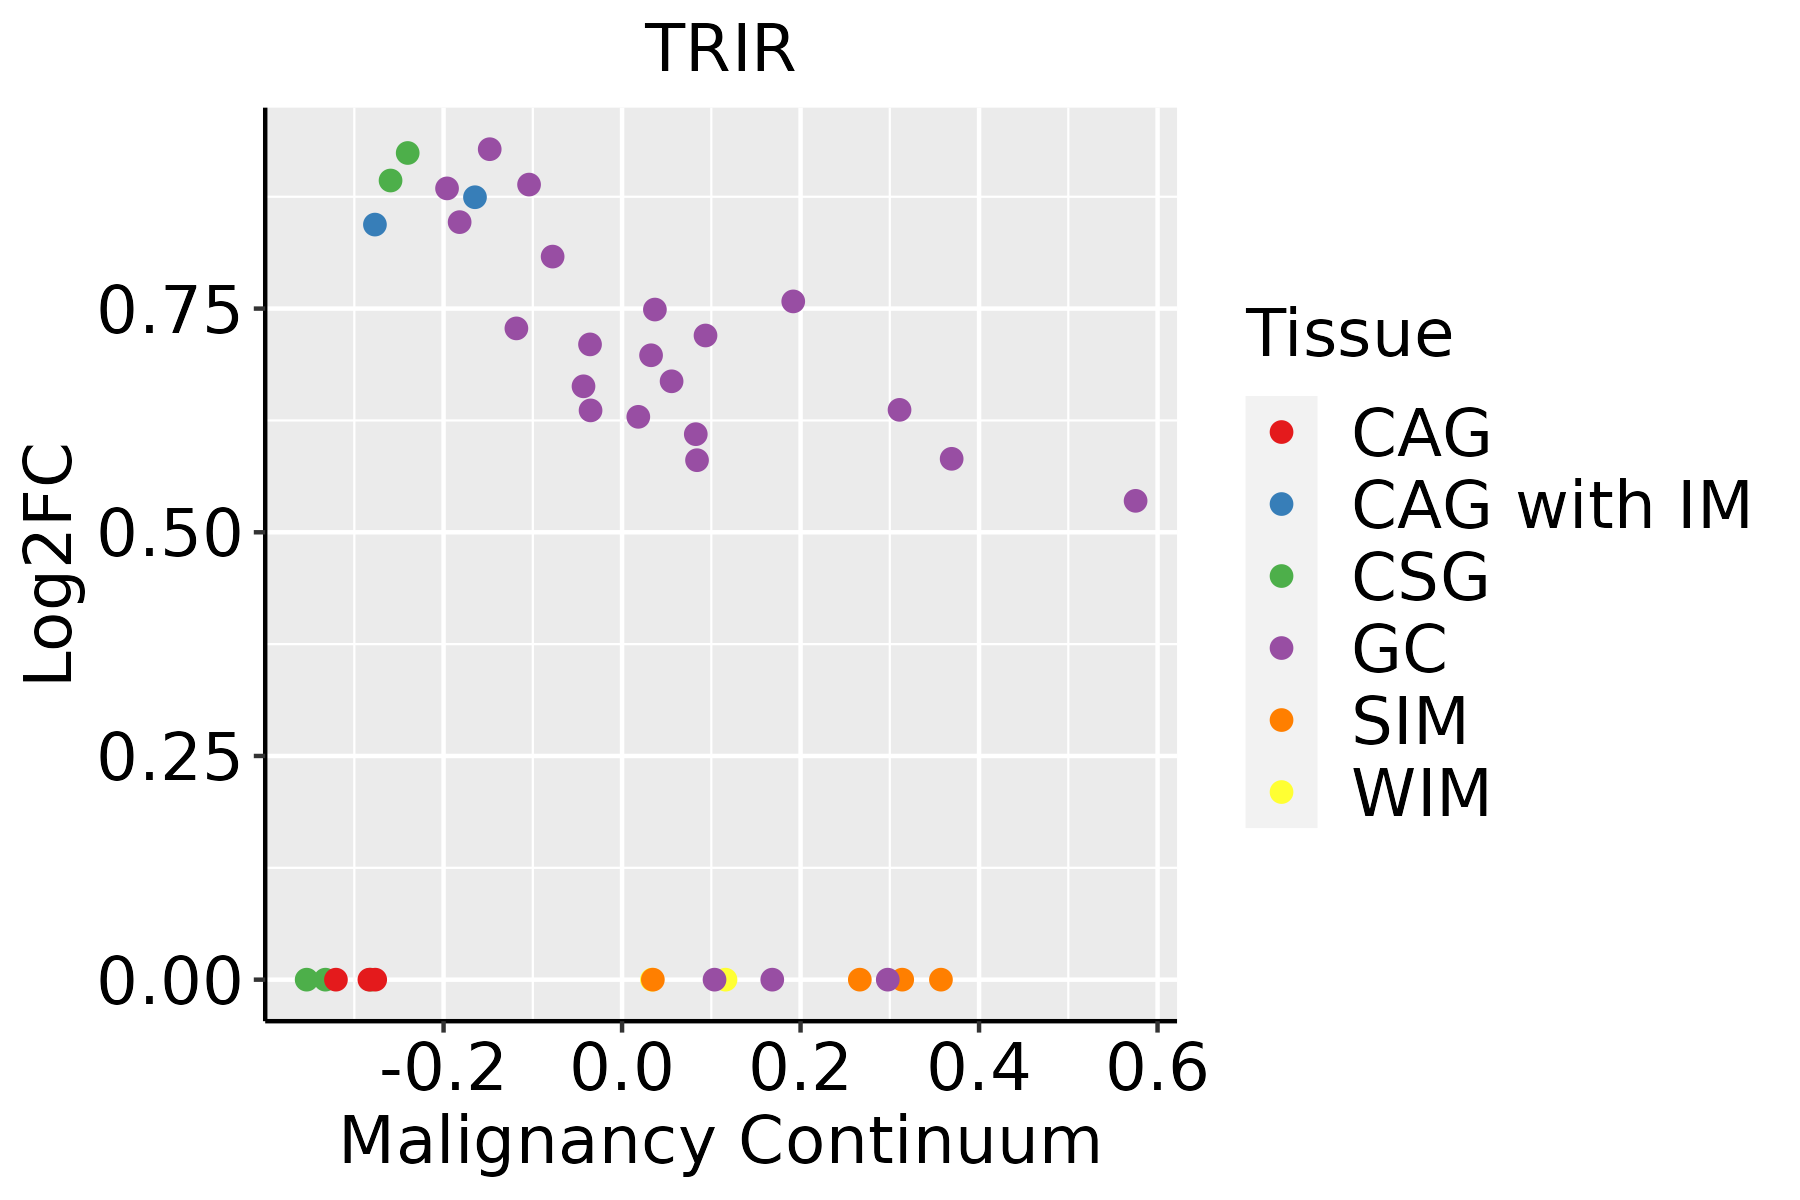 | CAG: Chronic atrophic gastritis |
| CAG with IM: Chronic atrophic gastritis with intestinal metaplasia |
| CSG: Chronic superficial gastritis |
| GC: Gastric cancer |
| SIM: Severe intestinal metaplasia |
| WIM: Wild intestinal metaplasia |
| Liver | 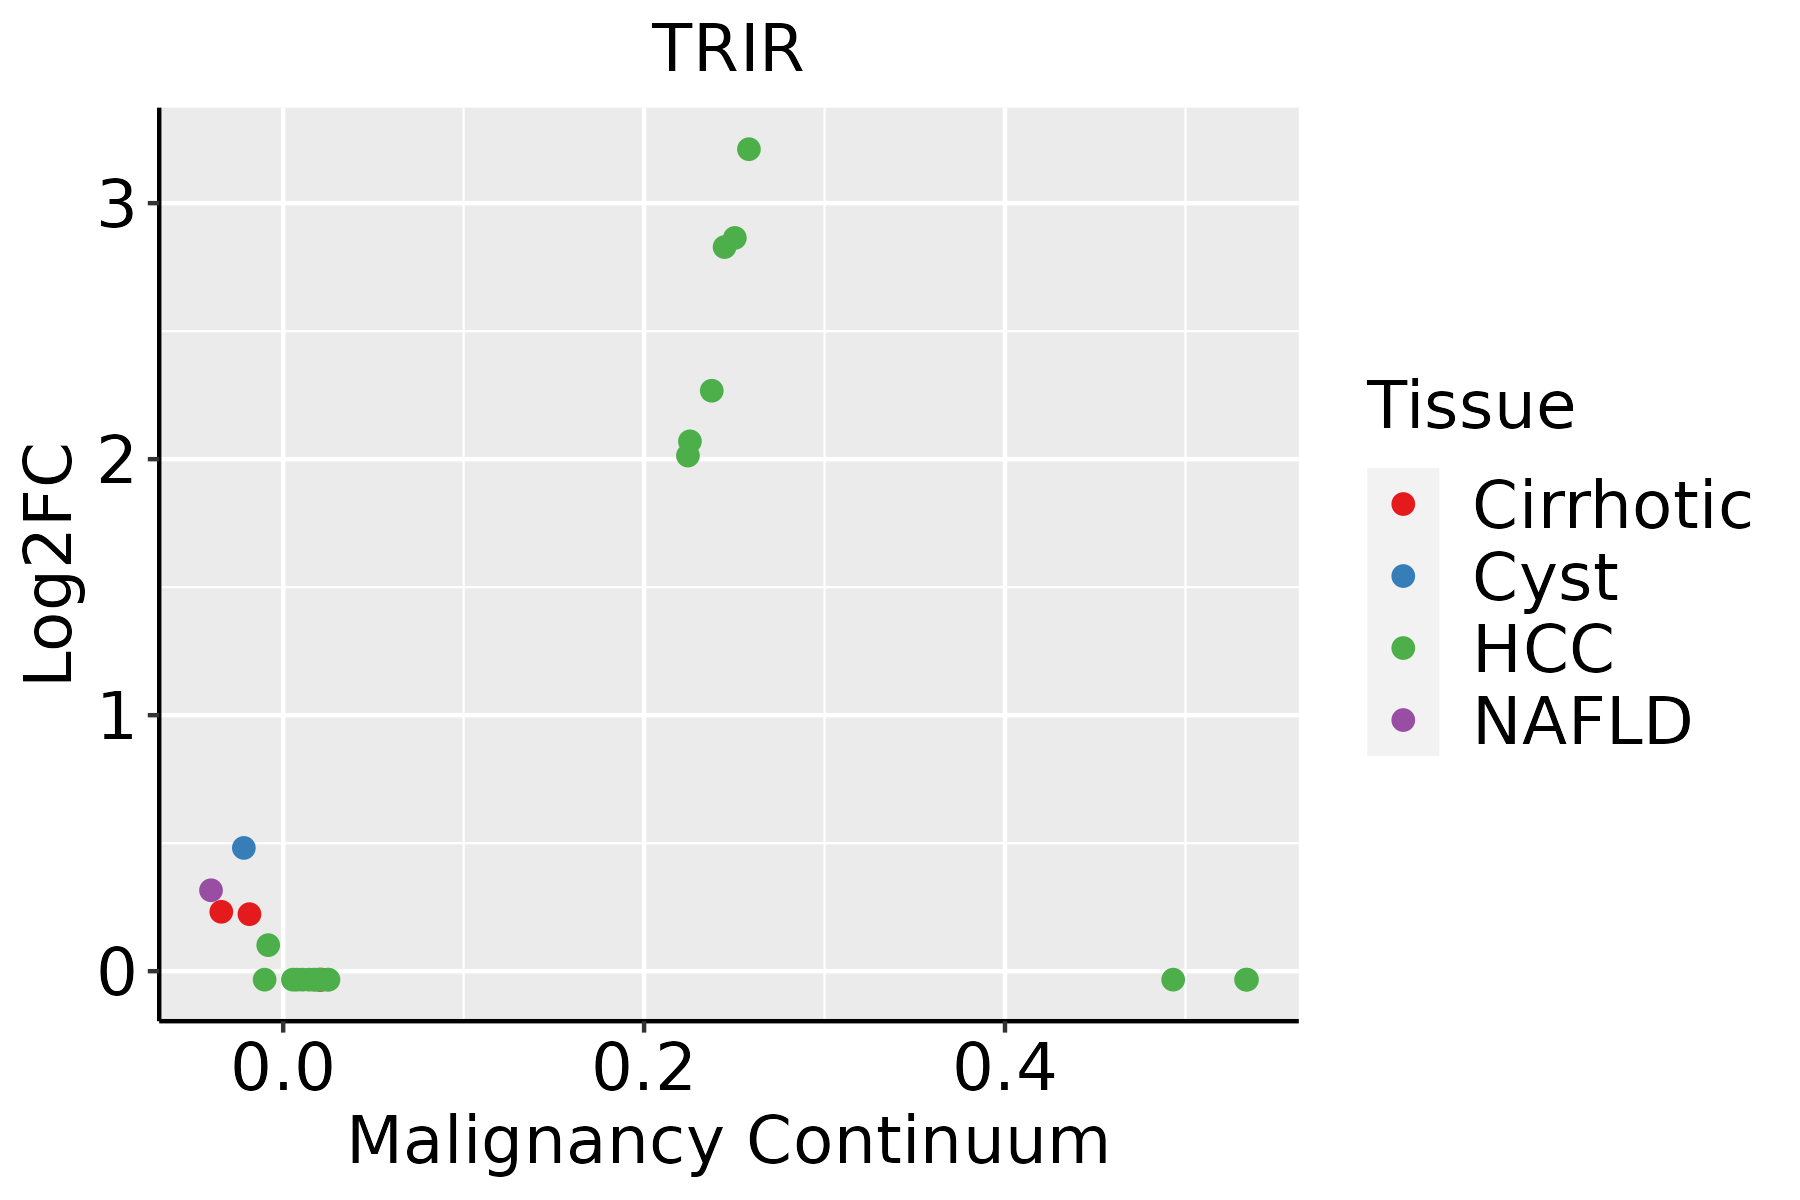 | HCC: Hepatocellular carcinoma |
| NAFLD: Non-alcoholic fatty liver disease |
| Prostate | 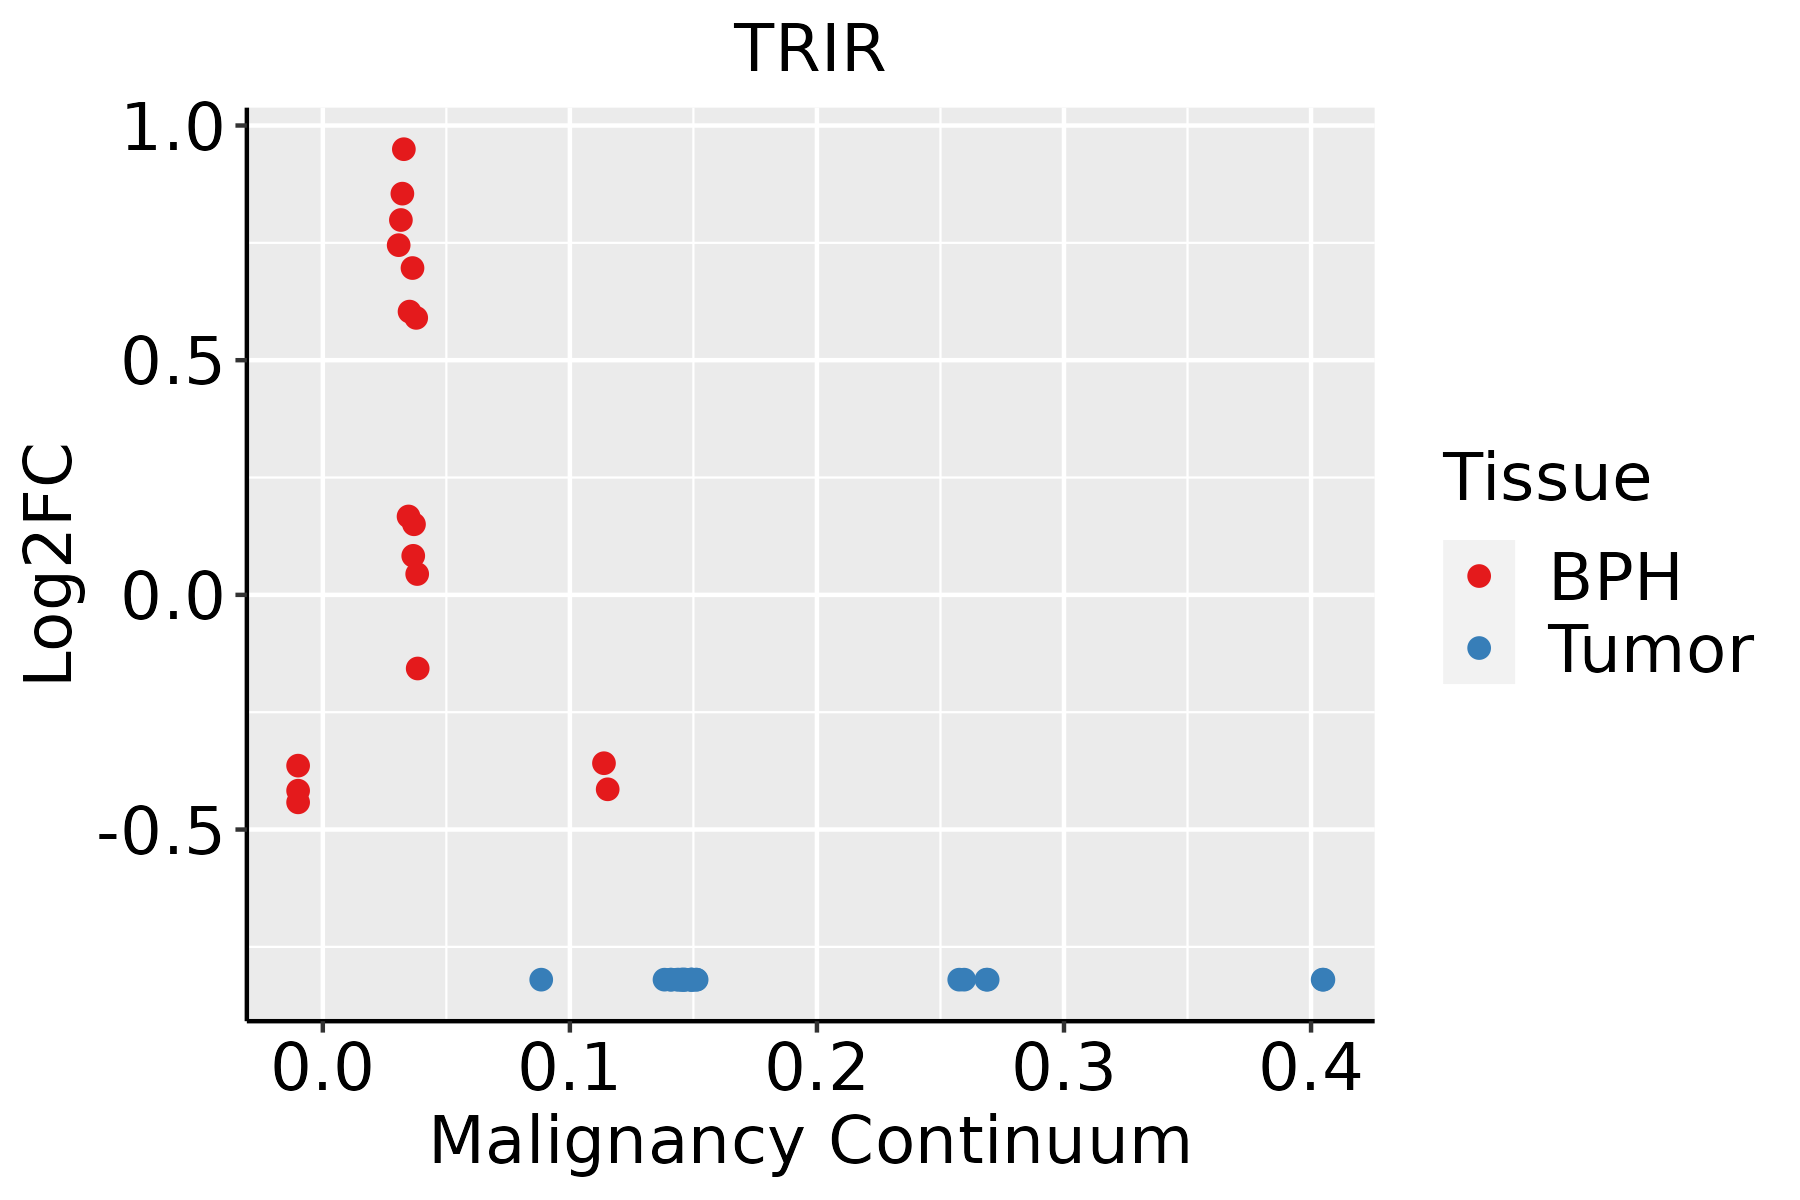 | BPH: Benign Prostatic Hyperplasia |
| Thyroid |  | ATC: Anaplastic thyroid cancer |
| HT: Hashimoto's thyroiditis |
| PTC: Papillary thyroid cancer |
| GO ID | Tissue | Disease Stage | Description | Gene Ratio | Bg Ratio | pvalue | p.adjust | Count |
| GO:00160726 | Breast | Precancer | rRNA metabolic process | 36/1080 | 236/18723 | 8.59e-08 | 4.84e-06 | 36 |
| GO:00064018 | Breast | Precancer | RNA catabolic process | 34/1080 | 278/18723 | 2.88e-05 | 6.39e-04 | 34 |
| GO:00346558 | Breast | Precancer | nucleobase-containing compound catabolic process | 42/1080 | 407/18723 | 1.91e-04 | 3.06e-03 | 42 |
| GO:00467007 | Breast | Precancer | heterocycle catabolic process | 44/1080 | 445/18723 | 3.49e-04 | 4.88e-03 | 44 |
| GO:00442708 | Breast | Precancer | cellular nitrogen compound catabolic process | 44/1080 | 451/18723 | 4.64e-04 | 6.12e-03 | 44 |
| GO:00194397 | Breast | Precancer | aromatic compound catabolic process | 44/1080 | 467/18723 | 9.55e-04 | 1.07e-02 | 44 |
| GO:00346604 | Breast | Precancer | ncRNA metabolic process | 45/1080 | 485/18723 | 1.15e-03 | 1.26e-02 | 45 |
| GO:19013617 | Breast | Precancer | organic cyclic compound catabolic process | 45/1080 | 495/18723 | 1.73e-03 | 1.74e-02 | 45 |
| GO:001607214 | Breast | IDC | rRNA metabolic process | 36/1434 | 236/18723 | 5.48e-05 | 1.17e-03 | 36 |
| GO:000640113 | Breast | IDC | RNA catabolic process | 38/1434 | 278/18723 | 3.54e-04 | 5.16e-03 | 38 |
| GO:190136112 | Breast | IDC | organic cyclic compound catabolic process | 56/1434 | 495/18723 | 2.12e-03 | 1.99e-02 | 56 |
| GO:004670012 | Breast | IDC | heterocycle catabolic process | 51/1434 | 445/18723 | 2.51e-03 | 2.25e-02 | 51 |
| GO:003465513 | Breast | IDC | nucleobase-containing compound catabolic process | 47/1434 | 407/18723 | 3.12e-03 | 2.63e-02 | 47 |
| GO:004427012 | Breast | IDC | cellular nitrogen compound catabolic process | 50/1434 | 451/18723 | 5.29e-03 | 3.93e-02 | 50 |
| GO:001943912 | Breast | IDC | aromatic compound catabolic process | 51/1434 | 467/18723 | 6.54e-03 | 4.59e-02 | 51 |
| GO:001607222 | Breast | DCIS | rRNA metabolic process | 36/1390 | 236/18723 | 2.86e-05 | 6.42e-04 | 36 |
| GO:000640123 | Breast | DCIS | RNA catabolic process | 38/1390 | 278/18723 | 1.91e-04 | 3.08e-03 | 38 |
| GO:003465522 | Breast | DCIS | nucleobase-containing compound catabolic process | 47/1390 | 407/18723 | 1.69e-03 | 1.68e-02 | 47 |
| GO:190136122 | Breast | DCIS | organic cyclic compound catabolic process | 55/1390 | 495/18723 | 1.75e-03 | 1.71e-02 | 55 |
| GO:004670022 | Breast | DCIS | heterocycle catabolic process | 50/1390 | 445/18723 | 2.19e-03 | 2.03e-02 | 50 |


