
|
|||||
|
 | |
| |
| |
| |
| |
| |
|
Gene: TMEM256 |
Gene summary for TMEM256 |
| Gene information | Species | Human | Gene symbol | TMEM256 | Gene ID | 254863 |
| Gene name | transmembrane protein 256 | |
| Gene Alias | C17orf61 | |
| Cytomap | 17p13.1 | |
| Gene Type | protein-coding | GO ID | GO:0008150 | UniProtAcc | Q8N2U0 |
Top |
Malignant transformation analysis |
| Identification of the aberrant gene expression in precancerous and cancerous lesions by comparing the gene expression of stem-like cells in diseased tissues with normal stem cells |
| Entrez ID | Symbol | Replicates | Species | Organ | Tissue | Adj P-value | Log2FC | Malignancy |
| 254863 | TMEM256 | C21 | Human | Oral cavity | OSCC | 4.09e-51 | 2.16e+00 | 0.2678 |
| 254863 | TMEM256 | C30 | Human | Oral cavity | OSCC | 1.41e-59 | 3.54e+00 | 0.3055 |
| 254863 | TMEM256 | C38 | Human | Oral cavity | OSCC | 2.55e-10 | 1.33e+00 | 0.172 |
| 254863 | TMEM256 | C43 | Human | Oral cavity | OSCC | 1.51e-14 | 4.21e-01 | 0.1704 |
| 254863 | TMEM256 | C46 | Human | Oral cavity | OSCC | 8.72e-18 | 5.83e-01 | 0.1673 |
| 254863 | TMEM256 | C51 | Human | Oral cavity | OSCC | 1.14e-29 | 1.83e+00 | 0.2674 |
| 254863 | TMEM256 | C57 | Human | Oral cavity | OSCC | 5.07e-18 | 7.13e-01 | 0.1679 |
| 254863 | TMEM256 | C06 | Human | Oral cavity | OSCC | 8.48e-10 | 1.52e+00 | 0.2699 |
| 254863 | TMEM256 | C07 | Human | Oral cavity | OSCC | 3.07e-12 | 2.46e+00 | 0.2491 |
| 254863 | TMEM256 | C08 | Human | Oral cavity | OSCC | 3.17e-92 | 1.91e+00 | 0.1919 |
| 254863 | TMEM256 | C09 | Human | Oral cavity | OSCC | 2.85e-40 | 1.29e+00 | 0.1431 |
| 254863 | TMEM256 | LN22 | Human | Oral cavity | OSCC | 2.17e-10 | 1.36e+00 | 0.1733 |
| 254863 | TMEM256 | LN46 | Human | Oral cavity | OSCC | 1.96e-03 | 4.57e-01 | 0.1666 |
| 254863 | TMEM256 | LP15 | Human | Oral cavity | LP | 7.16e-16 | 2.44e+00 | 0.2174 |
| 254863 | TMEM256 | LP17 | Human | Oral cavity | LP | 7.48e-05 | 1.04e+00 | 0.2349 |
| 254863 | TMEM256 | SYSMH1 | Human | Oral cavity | OSCC | 5.30e-27 | 9.55e-01 | 0.1127 |
| 254863 | TMEM256 | SYSMH2 | Human | Oral cavity | OSCC | 3.99e-21 | 1.02e+00 | 0.2326 |
| 254863 | TMEM256 | SYSMH3 | Human | Oral cavity | OSCC | 6.69e-42 | 2.36e+00 | 0.2442 |
| 254863 | TMEM256 | SYSMH4 | Human | Oral cavity | OSCC | 9.47e-07 | 1.88e-01 | 0.1226 |
| 254863 | TMEM256 | SYSMH5 | Human | Oral cavity | OSCC | 4.57e-09 | 5.03e-01 | 0.0647 |
| Page: 1 2 3 4 5 6 7 8 9 10 11 |
| Tissue | Expression Dynamics | Abbreviation |
| Colorectum (GSE201348) |  | FAP: Familial adenomatous polyposis |
| CRC: Colorectal cancer | ||
| Colorectum (HTA11) |  | AD: Adenomas |
| SER: Sessile serrated lesions | ||
| MSI-H: Microsatellite-high colorectal cancer | ||
| MSS: Microsatellite stable colorectal cancer | ||
| Endometrium | 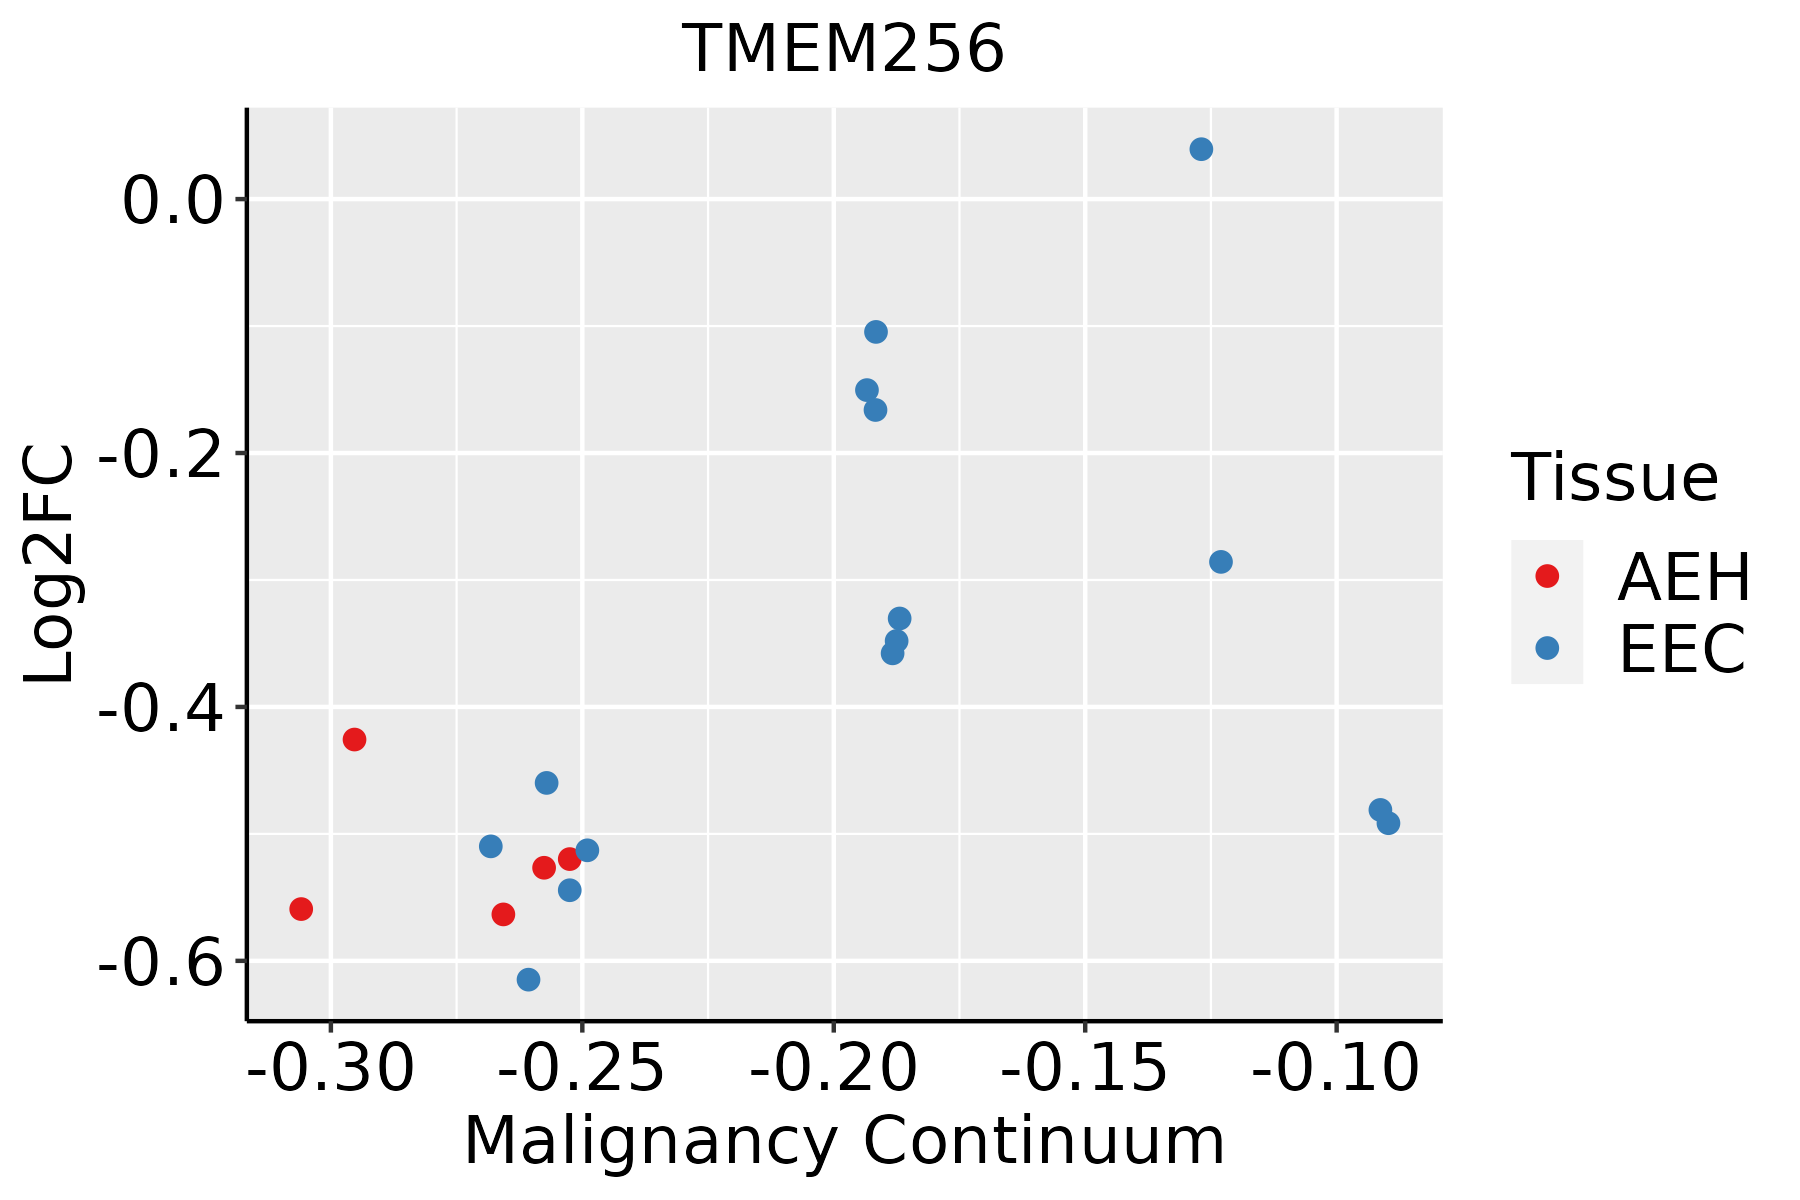 | AEH: Atypical endometrial hyperplasia |
| EEC: Endometrioid Cancer | ||
| Esophagus | 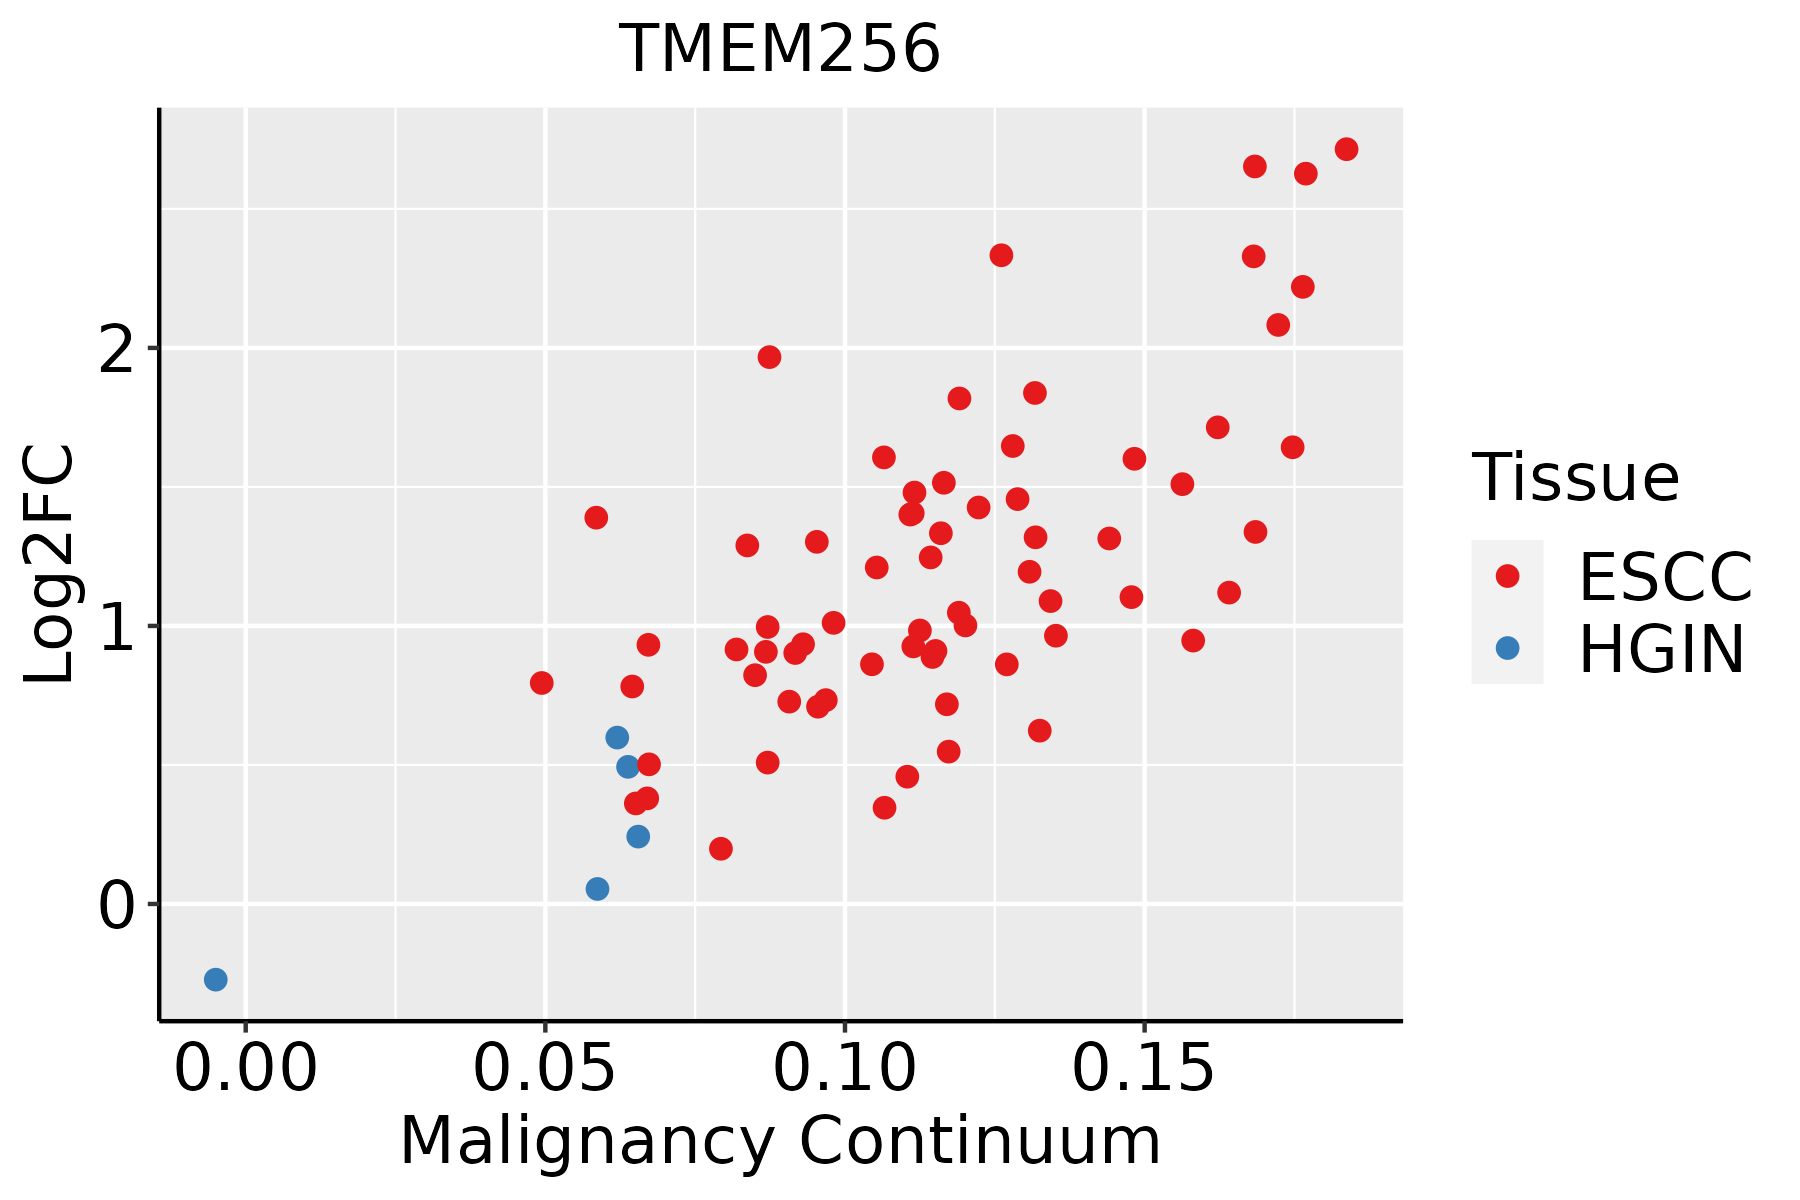 | ESCC: Esophageal squamous cell carcinoma |
| HGIN: High-grade intraepithelial neoplasias | ||
| LGIN: Low-grade intraepithelial neoplasias | ||
| GC |  | CAG: Chronic atrophic gastritis |
| CAG with IM: Chronic atrophic gastritis with intestinal metaplasia | ||
| CSG: Chronic superficial gastritis | ||
| GC: Gastric cancer | ||
| SIM: Severe intestinal metaplasia | ||
| WIM: Wild intestinal metaplasia | ||
| Liver | 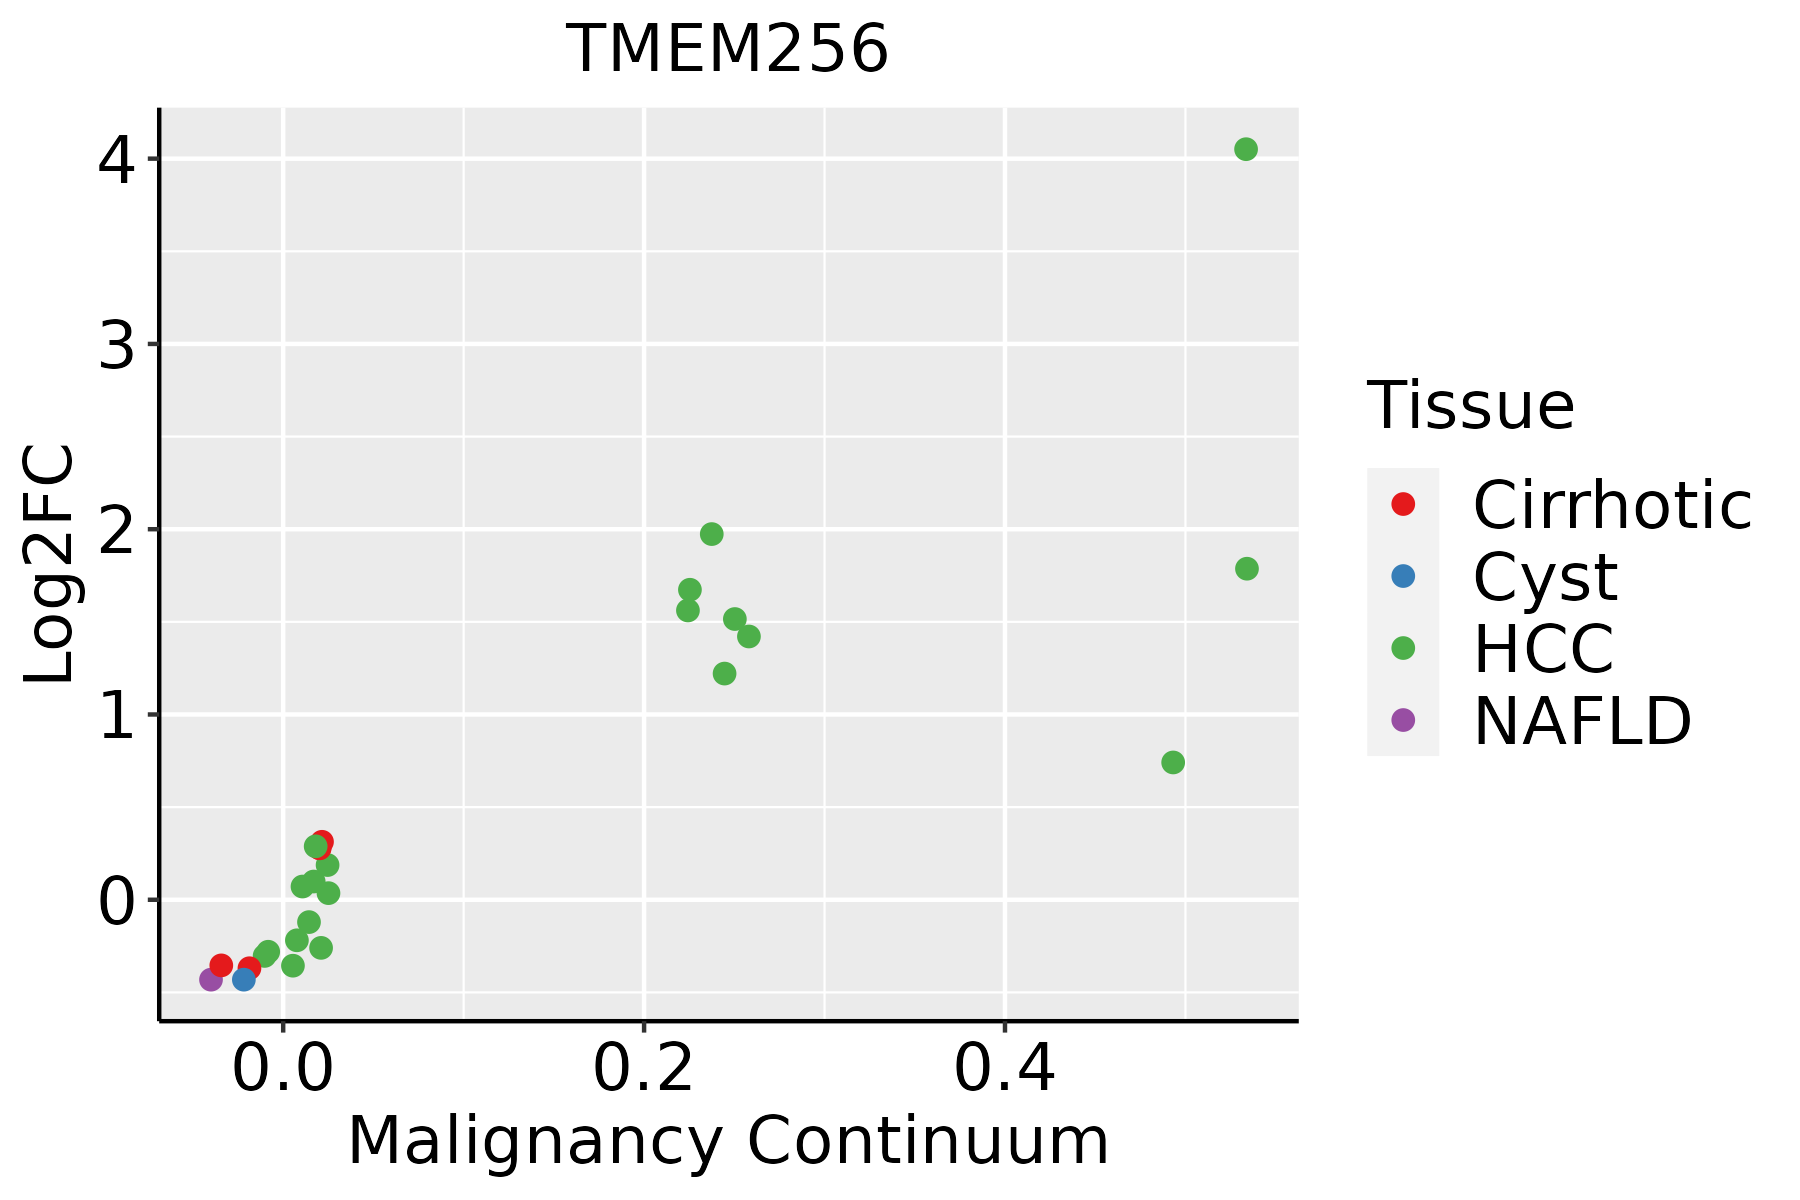 | HCC: Hepatocellular carcinoma |
| NAFLD: Non-alcoholic fatty liver disease | ||
| Oral Cavity |  | EOLP: Erosive Oral lichen planus |
| LP: leukoplakia | ||
| NEOLP: Non-erosive oral lichen planus | ||
| OSCC: Oral squamous cell carcinoma | ||
| Prostate |  | BPH: Benign Prostatic Hyperplasia |
| Skin | 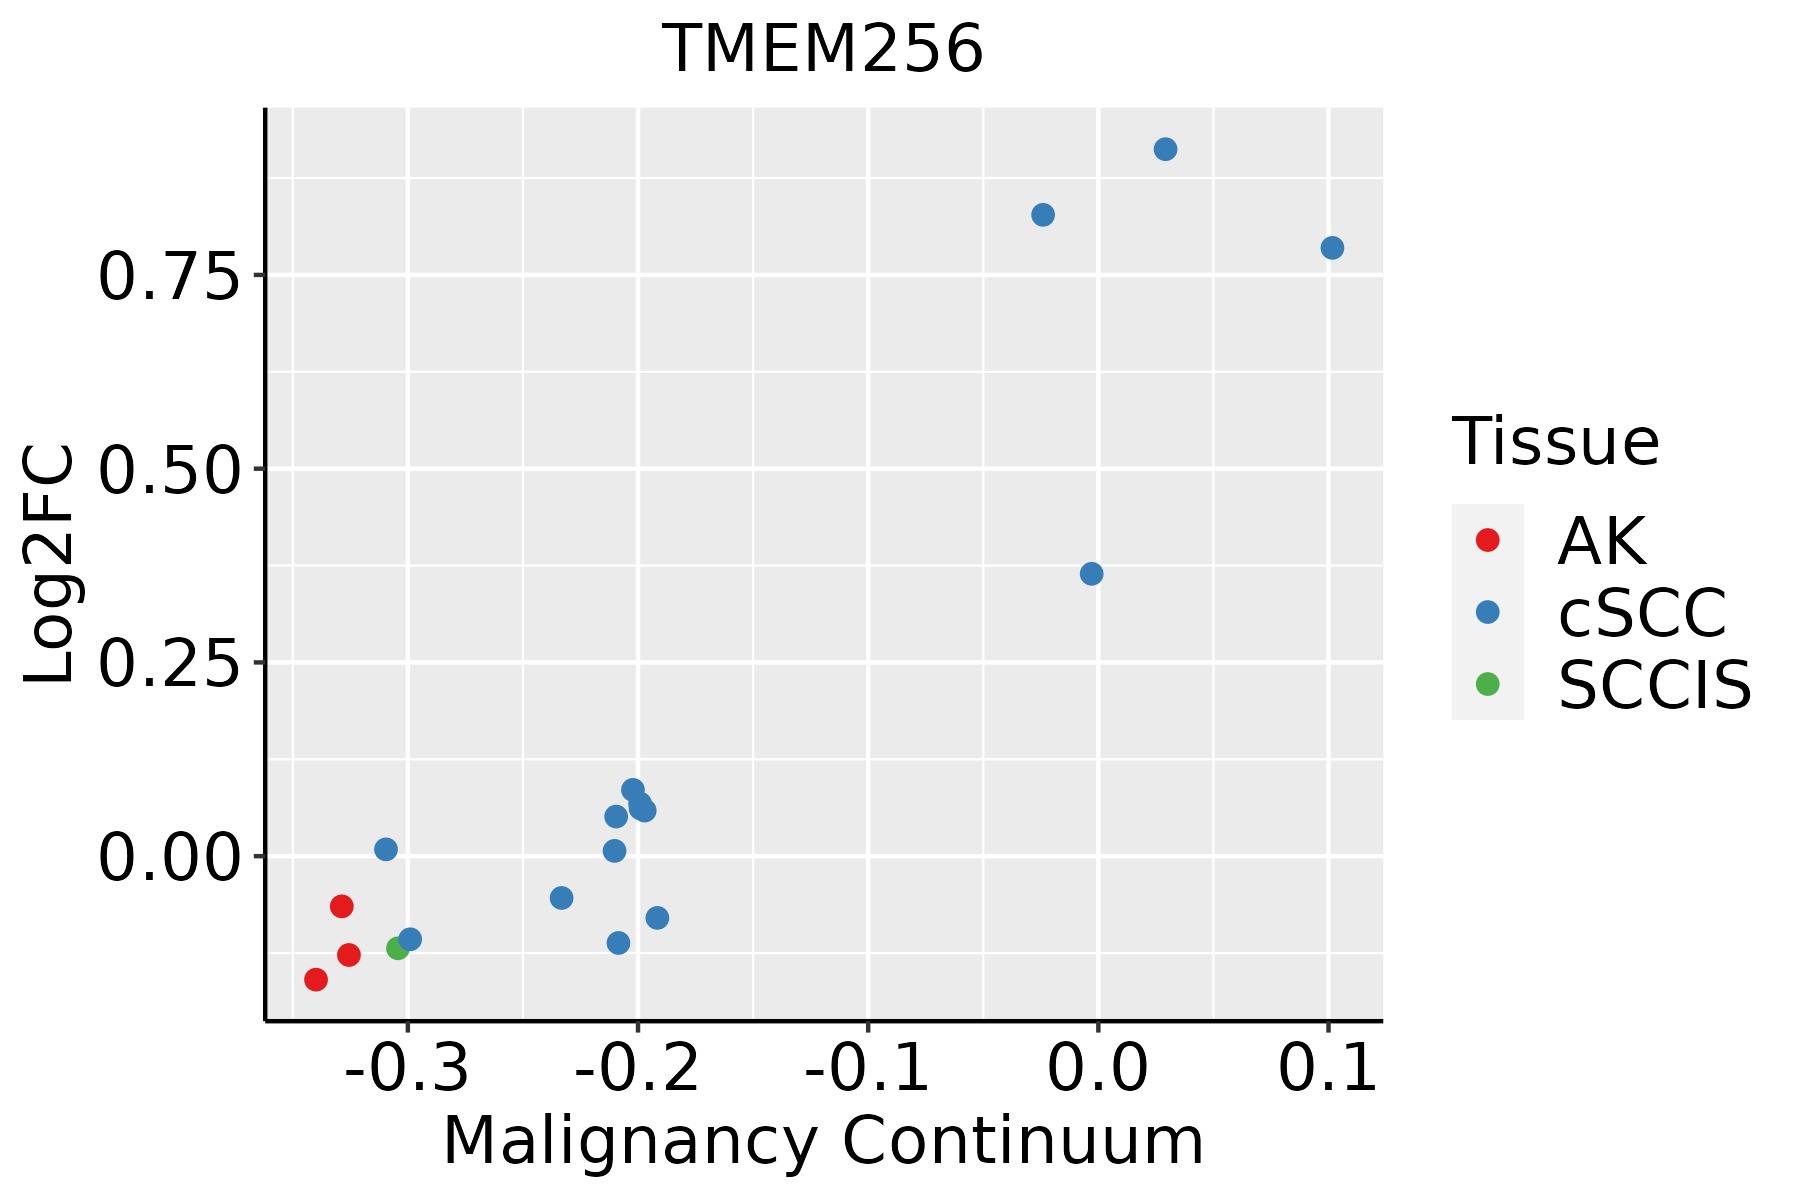 | AK: Actinic keratosis |
| cSCC: Cutaneous squamous cell carcinoma | ||
| SCCIS:squamous cell carcinoma in situ | ||
| Thyroid |  | ATC: Anaplastic thyroid cancer |
| HT: Hashimoto's thyroiditis | ||
| PTC: Papillary thyroid cancer |
| ∗log2FC in expression of this searched gene in stem-like cells from each diseased tissue sample relative to stem-like cells in normal samples in each tissue plotted against the malignancy continuum. Samples are colored based on if they are from different disease stage. |
Top |
Malignant transformation related pathway analysis |
| Find out the enriched GO biological processes and KEGG pathways involved in transition from healthy to precancer to cancer |
| Tissue | Disease Stage | Enriched GO biological Processes |
| Colorectum | AD |  |
| Colorectum | SER |  |
| Colorectum | MSS |  |
| Colorectum | MSI-H |  |
| Colorectum | FAP |  |
| ∗Top 15 enriched GO BP terms are showed in the bar plot of each disease state in each tissue. Each row represents a significant GO biological process which is colored according to the -log10(p.adjust). |
| Page: 1 2 3 4 5 6 7 8 9 |
| GO ID | Tissue | Disease Stage | Description | Gene Ratio | Bg Ratio | pvalue | p.adjust | Count |
| Page: 1 |
| Pathway ID | Tissue | Disease Stage | Description | Gene Ratio | Bg Ratio | pvalue | p.adjust | qvalue | Count |
| Page: 1 |
Top |
Cell-cell communication analysis |
| Identification of potential cell-cell interactions between two cell types and their ligand-receptor pairs for different disease states |
| Ligand | Receptor | LRpair | Pathway | Tissue | Disease Stage |
| Page: 1 |
Top |
Single-cell gene regulatory network inference analysis |
| Find out the significant the regulons (TFs) and the target genes of each regulon across cell types for different disease states |
| TF | Cell Type | Tissue | Disease Stage | Target Gene | RSS | Regulon Activity |
| ∗The dot plots of a searched regulon are shown for all cell subpopulations in each disease state of each tissue based on the regulon specific score inferred using pySCENIC and by calculating the average expression. |
| Page: 1 |
Top |
Somatic mutation of malignant transformation related genes |
| Annotation of somatic variants for genes involved in malignant transformation |
| Hugo Symbol | Variant Class | Variant Classification | dbSNP RS | HGVSc | HGVSp | HGVSp Short | SWISSPROT | BIOTYPE | SIFT | PolyPhen | Tumor Sample Barcode | Tissue | Histology | Sex | Age | Stage | Therapy Types | Drugs | Outcome |
| TMEM256 | SNV | Missense_Mutation | rs767052290 | c.8N>A | p.Gly3Glu | p.G3E | Q8N2U0 | protein_coding | tolerated(0.37) | benign(0.051) | TCGA-OL-A66J-01 | Breast | breast invasive carcinoma | Female | >=65 | I/II | Unknown | Unknown | SD |
| TMEM256 | SNV | Missense_Mutation | c.236N>A | p.Cys79Tyr | p.C79Y | Q8N2U0 | protein_coding | deleterious(0) | probably_damaging(0.996) | TCGA-CM-6168-01 | Colorectum | colon adenocarcinoma | Female | >=65 | I/II | Unknown | Unknown | SD | |
| TMEM256 | SNV | Missense_Mutation | c.176C>T | p.Pro59Leu | p.P59L | Q8N2U0 | protein_coding | deleterious(0) | probably_damaging(0.928) | TCGA-AP-A0LM-01 | Endometrium | uterine corpus endometrioid carcinoma | Female | <65 | III/IV | Chemotherapy | cisplatin | SD | |
| TMEM256 | SNV | Missense_Mutation | c.275G>T | p.Ser92Ile | p.S92I | Q8N2U0 | protein_coding | tolerated(0.09) | benign(0.36) | TCGA-AX-A06F-01 | Endometrium | uterine corpus endometrioid carcinoma | Female | <65 | III/IV | Chemotherapy | carboplatin | SD | |
| TMEM256 | SNV | Missense_Mutation | novel | c.129G>T | p.Lys43Asn | p.K43N | Q8N2U0 | protein_coding | tolerated(0.07) | benign(0.315) | TCGA-AX-A2HC-01 | Endometrium | uterine corpus endometrioid carcinoma | Female | <65 | III/IV | Chemotherapy | paclitaxel | PD |
| TMEM256 | SNV | Missense_Mutation | c.275N>A | p.Ser92Asn | p.S92N | Q8N2U0 | protein_coding | tolerated(0.26) | benign(0.257) | TCGA-BG-A2L7-01 | Endometrium | uterine corpus endometrioid carcinoma | Female | >=65 | I/II | Chemotherapy | carboplatin | CR | |
| TMEM256 | SNV | Missense_Mutation | c.52N>A | p.Ala18Thr | p.A18T | Q8N2U0 | protein_coding | tolerated(0.7) | benign(0.01) | TCGA-86-A4D0-01 | Lung | lung adenocarcinoma | Male | <65 | I/II | Chemotherapy | etoposide | CR | |
| TMEM256 | SNV | Missense_Mutation | novel | c.124G>C | p.Asp42His | p.D42H | Q8N2U0 | protein_coding | deleterious(0.01) | possibly_damaging(0.677) | TCGA-91-6830-01 | Lung | lung adenocarcinoma | Female | >=65 | I/II | Unknown | Unknown | PD |
| TMEM256 | SNV | Missense_Mutation | novel | c.282G>C | p.Gln94His | p.Q94H | Q8N2U0 | protein_coding | tolerated(0.1) | possibly_damaging(0.77) | TCGA-85-7710-01 | Lung | lung squamous cell carcinoma | Female | <65 | I/II | Unknown | Unknown | SD |
| TMEM256 | SNV | Missense_Mutation | c.185G>C | p.Arg62Thr | p.R62T | Q8N2U0 | protein_coding | deleterious(0.01) | benign(0.255) | TCGA-85-7710-01 | Lung | lung squamous cell carcinoma | Female | <65 | I/II | Unknown | Unknown | SD |
| Page: 1 |
Top |
Related drugs of malignant transformation related genes |
| Identification of chemicals and drugs interact with genes involved in malignant transfromation |
| (DGIdb 4.0) |
| Entrez ID | Symbol | Category | Interaction Types | Drug Claim Name | Drug Name | PMIDs |
| Page: 1 |

Copyright 2023-Present -The University of Texas Health Science Center at Houston |