Schematic overview of the cellular and molecular mechanisms involved in the cancer progression, including the proposed cellular and molecular mechanisms in cancer cells trajectory. AT1: alveolar type 1 cells; AT2: alveolar type 2 cells; AAH: atypical adenomatous hyperplasia; AIS: adenocarcinoma in situ; MIA: minimally invasive adenocarcinoma; IA: invasive adenocarcinoma; EMT: epithelial-mesenchymal transition

Home

Download

Statistics

Help

Contact

Center for Computational Systems Medicine
leaf

Gene summary

leaf

Malignant transformation analysis

leaf

Malignant transformation related pathway analysis

leaf

Cell-cell communication analysis

leaf

Single-cell gene regulatory network inference analysis

leaf

Somatic mutation of malignant transformation related genes

leaf

Related drugs of malignant transformation related genes

Gene: SEPT2

Gene summary for SEPT2

check button Gene summary.

Gene informationSpeciesHuman
Gene symbol

SEPT2

Gene ID

4735

Gene nameseptin 2
Gene AliasDIFF6
Cytomap2q37.3
Gene Typeprotein-coding
GO ID

GO:0000003

UniProtAcc

Q15019


Top

Malignant transformation analysis

check button Identification of the aberrant gene expression in precancerous and cancerous lesions by comparing the gene expression of stem-like cells in diseased tissues with normal stem cells
check button Malignant transformation involving gene list.
Entrez IDSymbolReplicatesSpeciesOrganTissueAdj P-valueLog2FCMalignancy
4735SEPT2P130T-EHumanEsophagusESCC3.64e-671.98e+000.1676
4735SEPT2S41HumanLiverCirrhotic1.47e-02-4.63e-01-0.0343
4735SEPT2S43HumanLiverCirrhotic1.78e-25-4.63e-01-0.0187
4735SEPT2HCC1_MengHumanLiverHCC9.30e-39-2.64e-010.0246
4735SEPT2HCC2_MengHumanLiverHCC2.28e-273.48e-030.0107
4735SEPT2cirrhotic1HumanLiverCirrhotic2.96e-05-3.64e-020.0202
4735SEPT2cirrhotic2HumanLiverCirrhotic1.70e-102.21e-010.0201
4735SEPT2cirrhotic3HumanLiverCirrhotic2.45e-063.90e-020.0215
4735SEPT2p6HumanLiverCyst1.47e-02-4.63e-01-0.0218
4735SEPT2HCC1HumanLiverHCC5.25e-04-4.63e-010.5336
4735SEPT2HCC2HumanLiverHCC3.51e-06-4.63e-010.5341
4735SEPT2HCC5HumanLiverHCC2.08e-09-4.63e-010.4932
4735SEPT2Pt13.bHumanLiverHCC1.09e-139.83e-020.0251
4735SEPT2Pt14.aHumanLiverHCC5.86e-052.10e-010.0169
4735SEPT2S014HumanLiverHCC6.57e-201.22e+000.2254
4735SEPT2S015HumanLiverHCC1.29e-231.59e+000.2375
4735SEPT2S016HumanLiverHCC9.92e-281.50e+000.2243
4735SEPT2S027HumanLiverHCC3.59e-048.49e-010.2446
4735SEPT2S028HumanLiverHCC1.79e-161.19e+000.2503
4735SEPT2S029HumanLiverHCC3.13e-088.66e-010.2581
Page: 1 2 3 4 5 6 7 8 9 10 11 12 13 

check button Transcriptomic changes along malignancy continuum.
TissueExpression DynamicsAbbreviation
Colorectum (GSE201348)The image shows the transcriptomic changes along malignancy continuum.log2FC in expression of this searched gene in stem-like cells from each diseased tissue sample relative to stem-like cells in normal samples in each tissue plotted against the malignancy continuum. Samples are colored based on if they are from different disease stage.FAP: Familial adenomatous polyposis
CRC: Colorectal cancer
Colorectum (HTA11)The image shows the transcriptomic changes along malignancy continuum.log2FC in expression of this searched gene in stem-like cells from each diseased tissue sample relative to stem-like cells in normal samples in each tissue plotted against the malignancy continuum. Samples are colored based on if they are from different disease stage.AD: Adenomas
SER: Sessile serrated lesions
MSI-H: Microsatellite-high colorectal cancer
MSS: Microsatellite stable colorectal cancer
EndometriumThe image shows the transcriptomic changes along malignancy continuum.log2FC in expression of this searched gene in stem-like cells from each diseased tissue sample relative to stem-like cells in normal samples in each tissue plotted against the malignancy continuum. Samples are colored based on if they are from different disease stage.
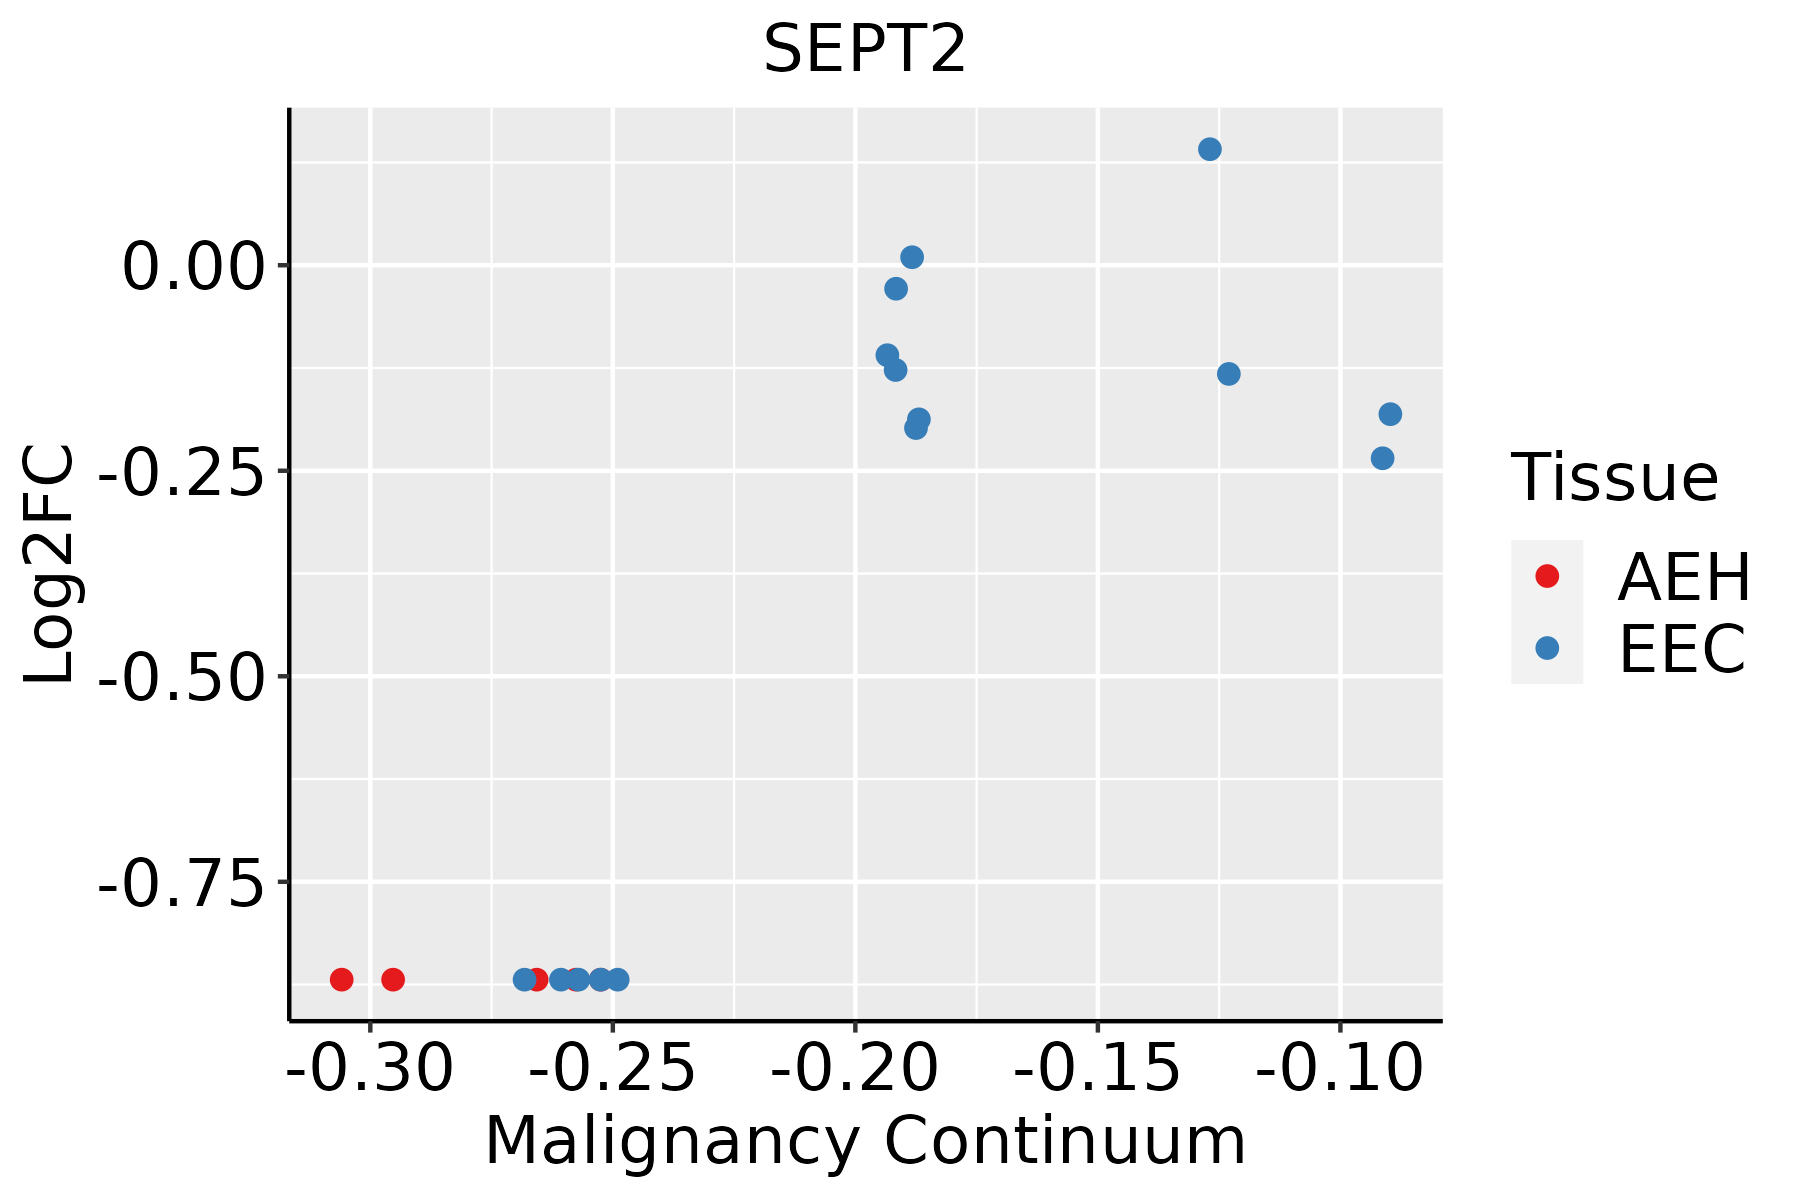
AEH: Atypical endometrial hyperplasia
EEC: Endometrioid Cancer
EsophagusThe image shows the transcriptomic changes along malignancy continuum.log2FC in expression of this searched gene in stem-like cells from each diseased tissue sample relative to stem-like cells in normal samples in each tissue plotted against the malignancy continuum. Samples are colored based on if they are from different disease stage.
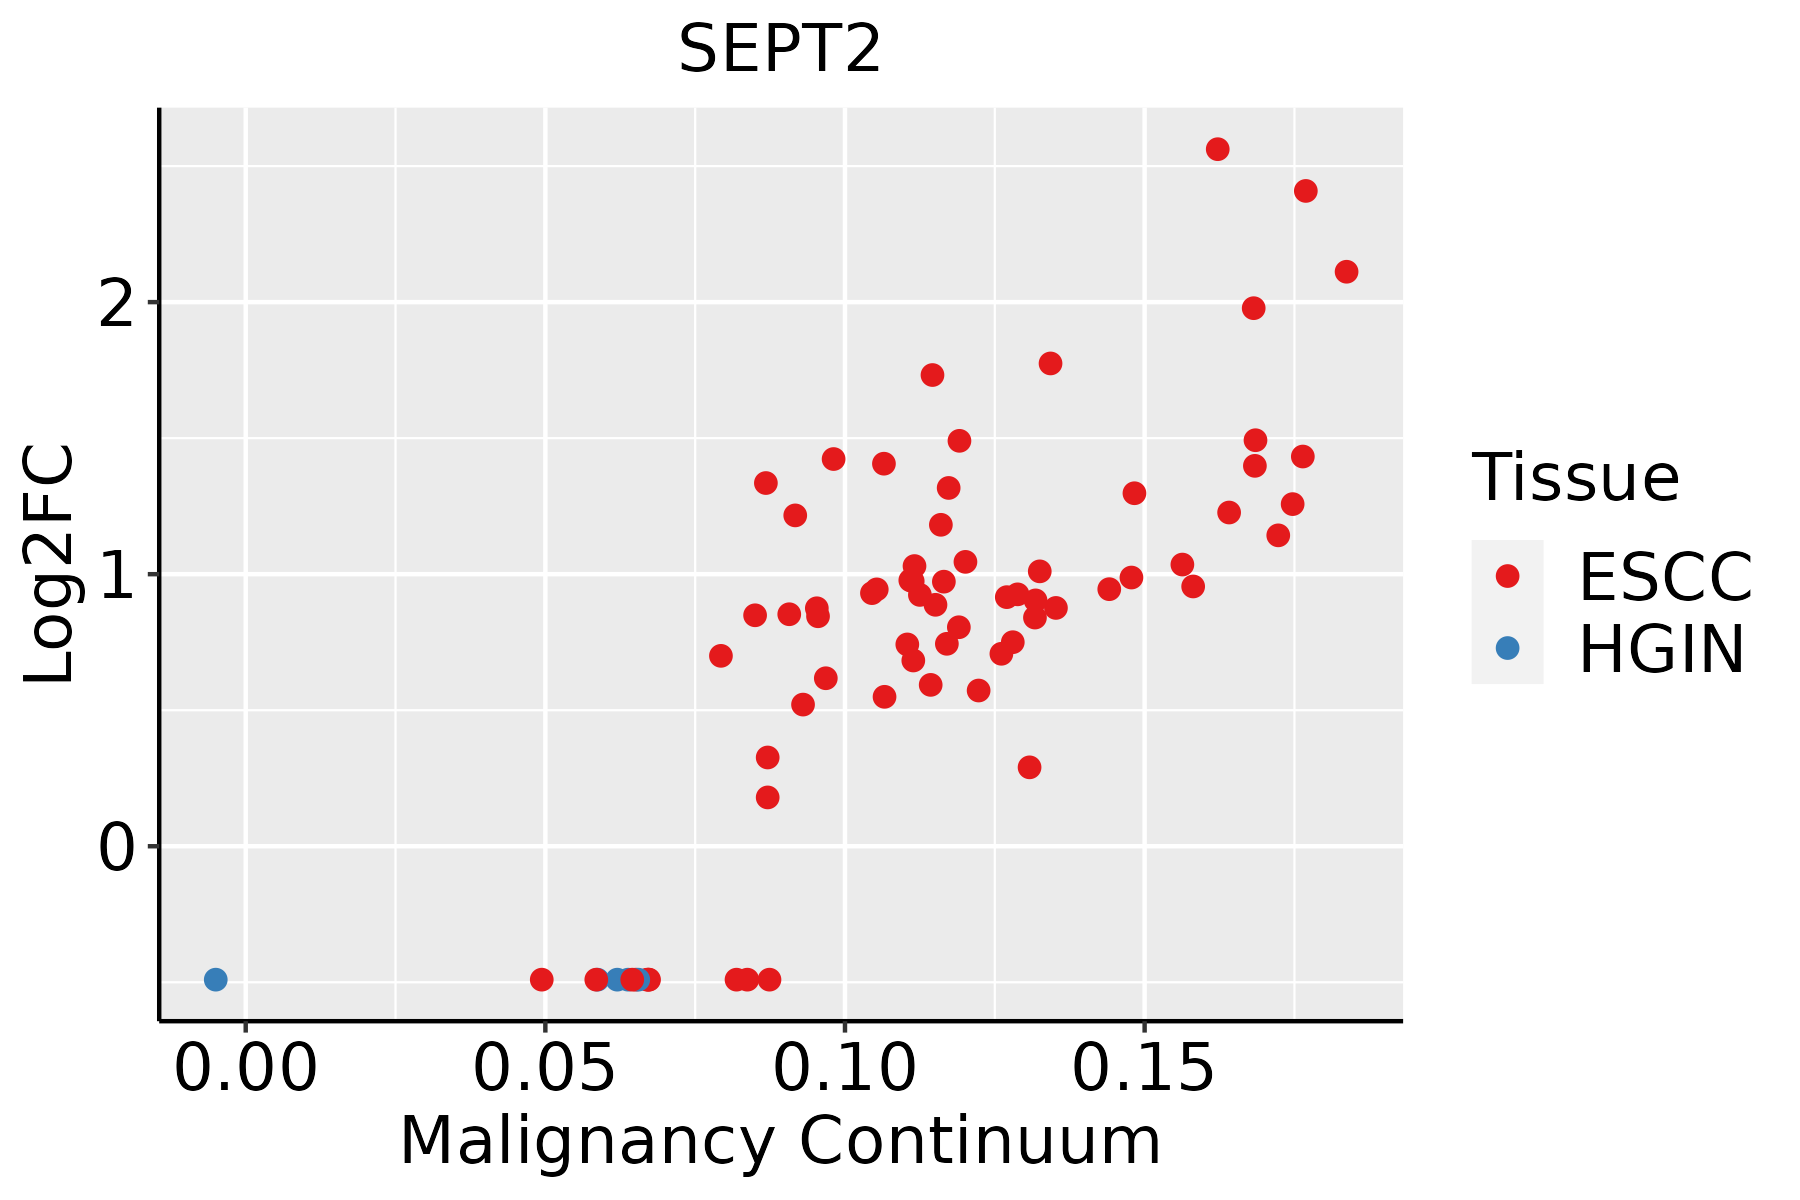
ESCC: Esophageal squamous cell carcinoma
HGIN: High-grade intraepithelial neoplasias
LGIN: Low-grade intraepithelial neoplasias
LiverThe image shows the transcriptomic changes along malignancy continuum.log2FC in expression of this searched gene in stem-like cells from each diseased tissue sample relative to stem-like cells in normal samples in each tissue plotted against the malignancy continuum. Samples are colored based on if they are from different disease stage.
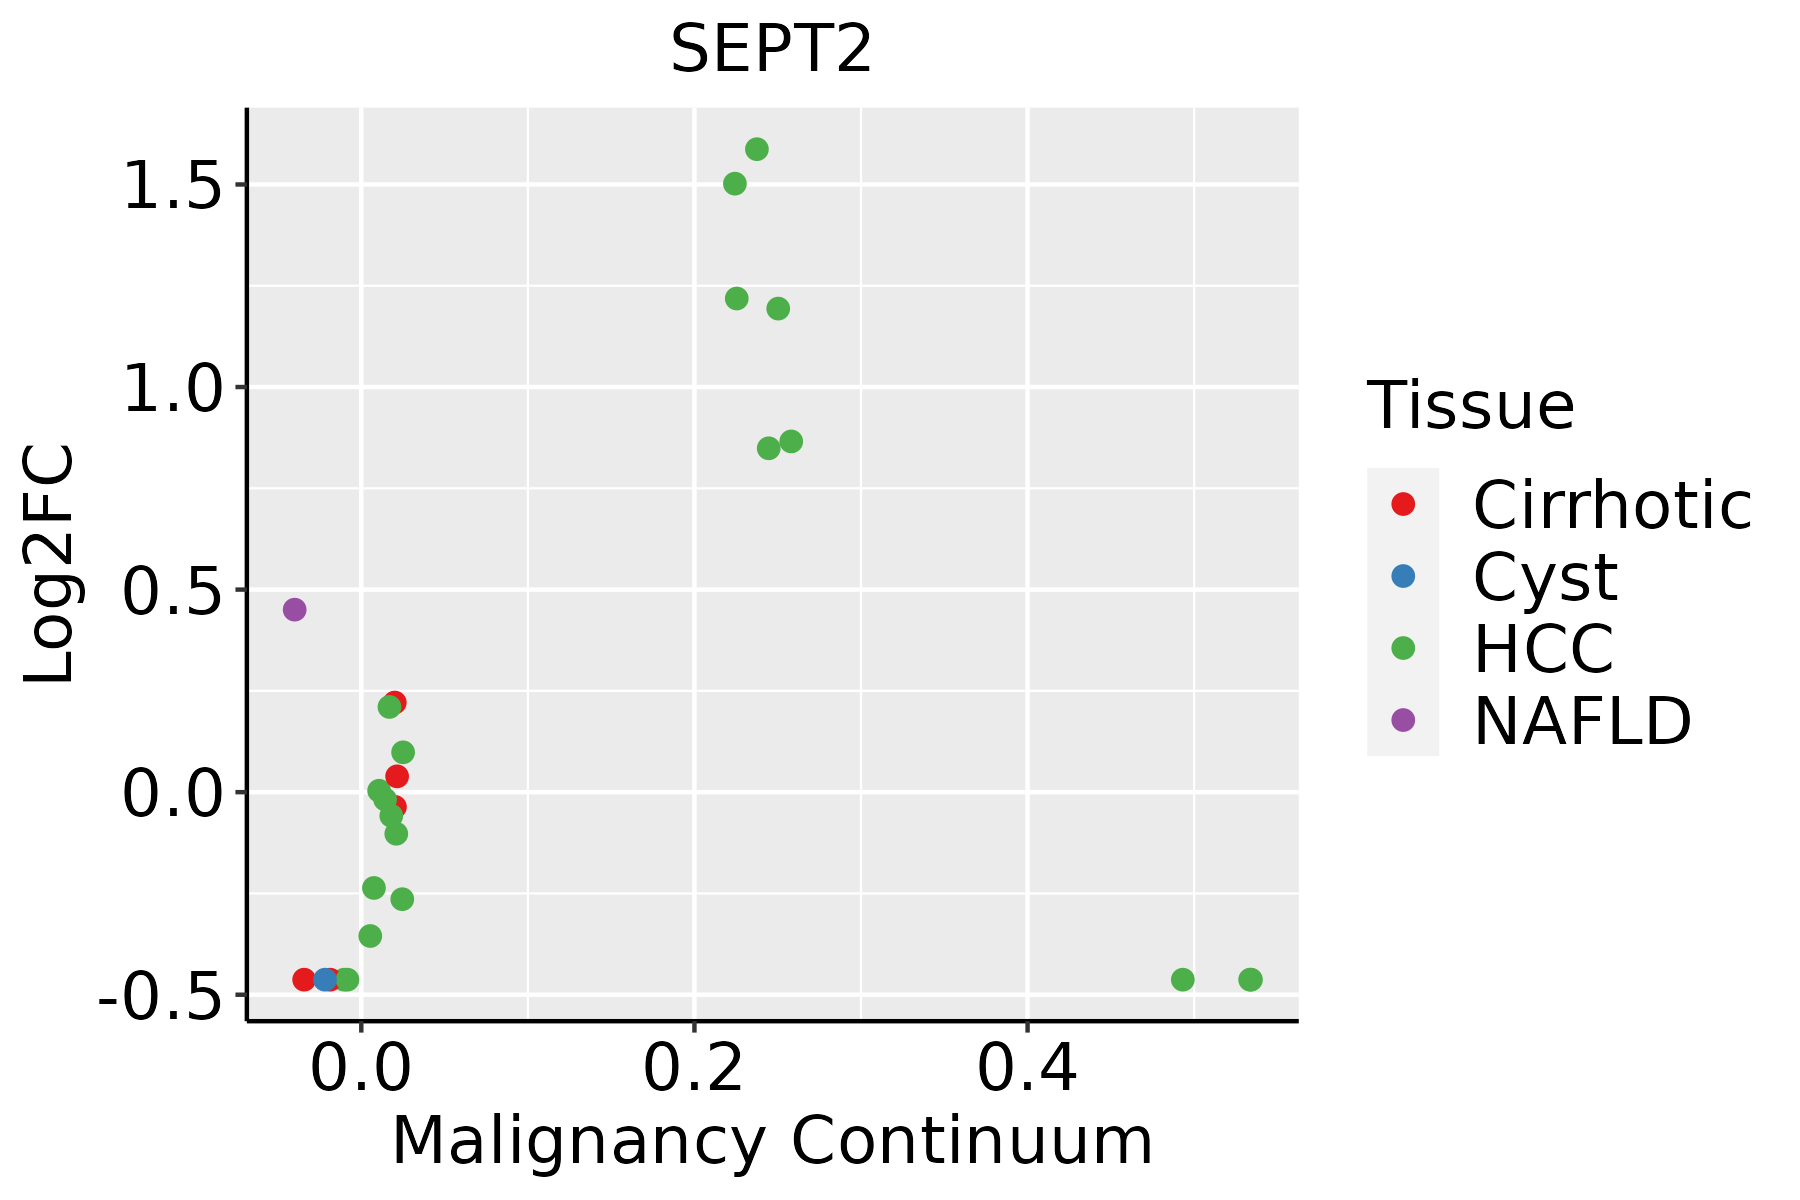
HCC: Hepatocellular carcinoma
NAFLD: Non-alcoholic fatty liver disease
LungThe image shows the transcriptomic changes along malignancy continuum.log2FC in expression of this searched gene in stem-like cells from each diseased tissue sample relative to stem-like cells in normal samples in each tissue plotted against the malignancy continuum. Samples are colored based on if they are from different disease stage.AAH: Atypical adenomatous hyperplasia
AIS: Adenocarcinoma in situ
IAC: Invasive lung adenocarcinoma
MIA: Minimally invasive adenocarcinoma
Oral CavityThe image shows the transcriptomic changes along malignancy continuum.log2FC in expression of this searched gene in stem-like cells from each diseased tissue sample relative to stem-like cells in normal samples in each tissue plotted against the malignancy continuum. Samples are colored based on if they are from different disease stage.
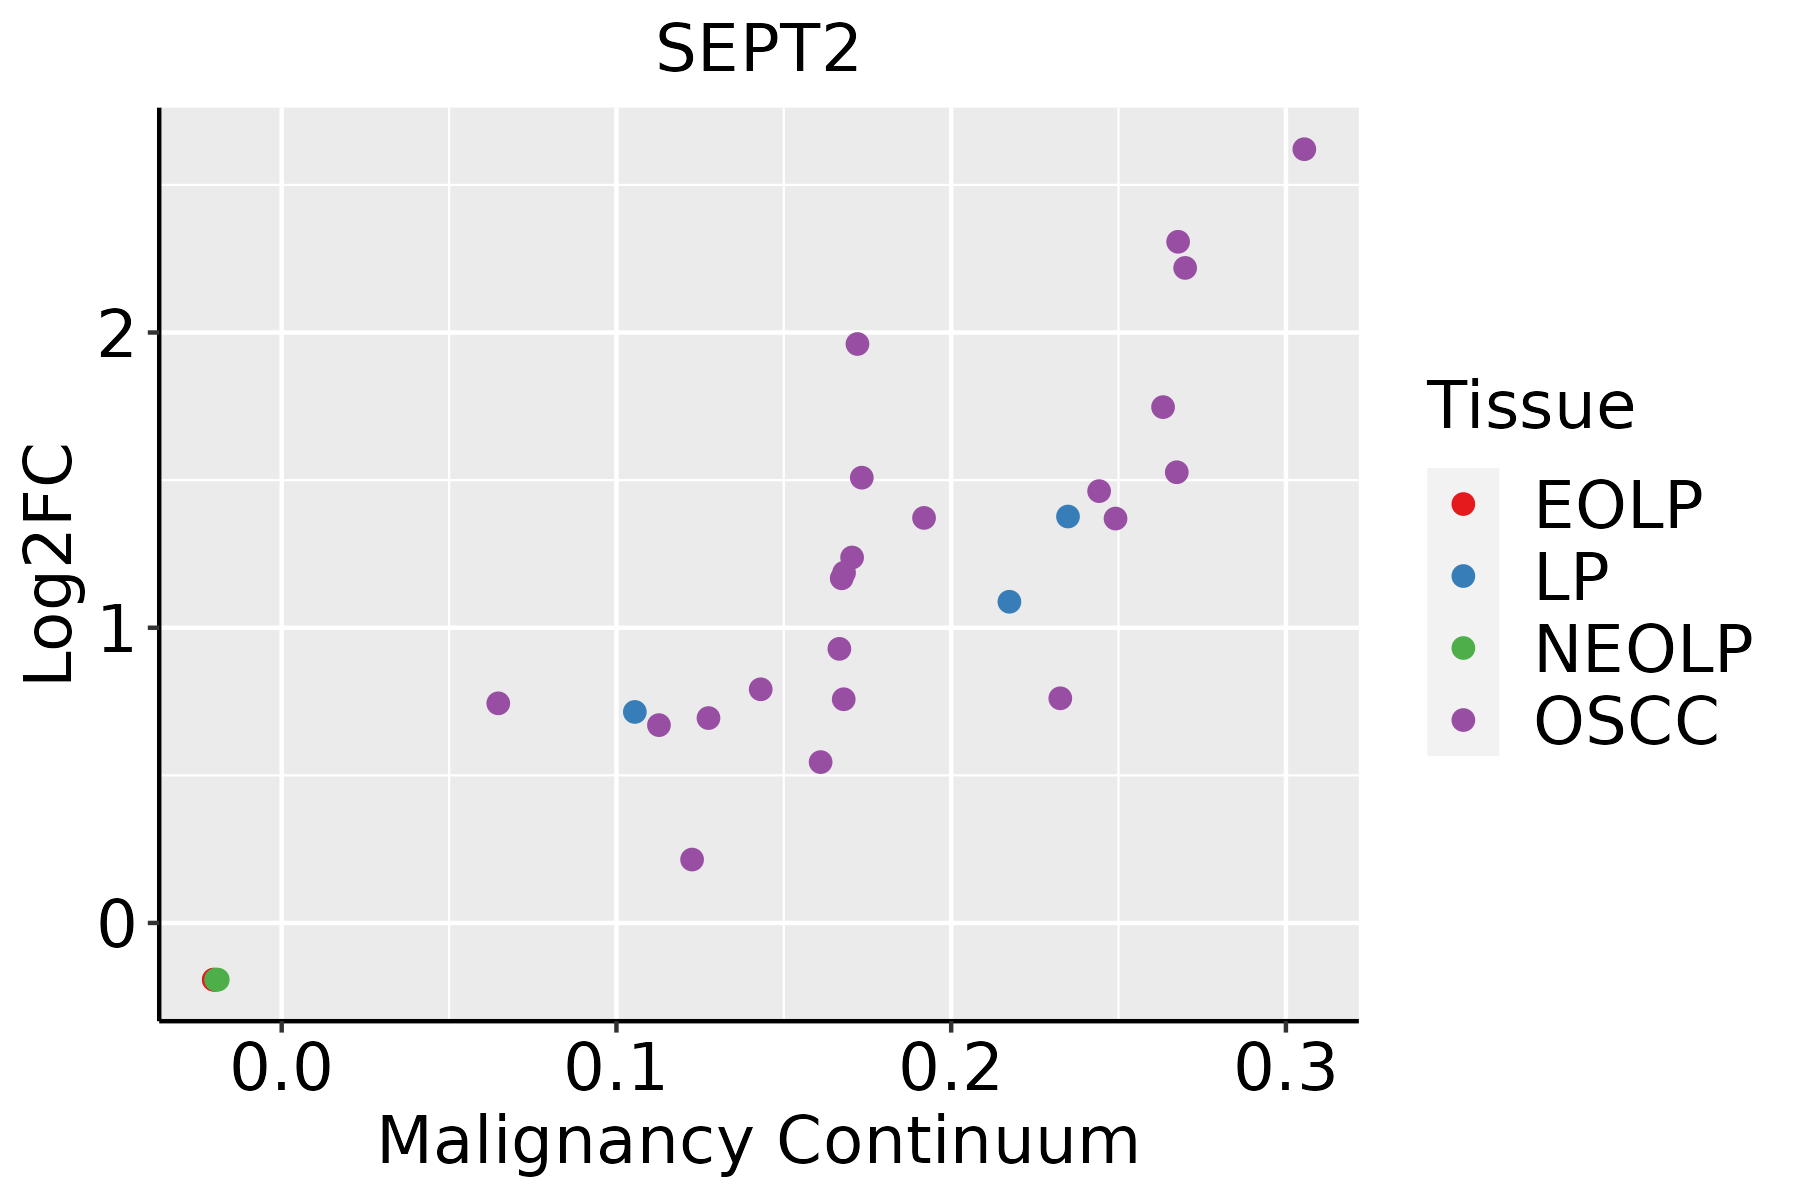
EOLP: Erosive Oral lichen planus
LP: leukoplakia
NEOLP: Non-erosive oral lichen planus
OSCC: Oral squamous cell carcinoma
ProstateThe image shows the transcriptomic changes along malignancy continuum.log2FC in expression of this searched gene in stem-like cells from each diseased tissue sample relative to stem-like cells in normal samples in each tissue plotted against the malignancy continuum. Samples are colored based on if they are from different disease stage.
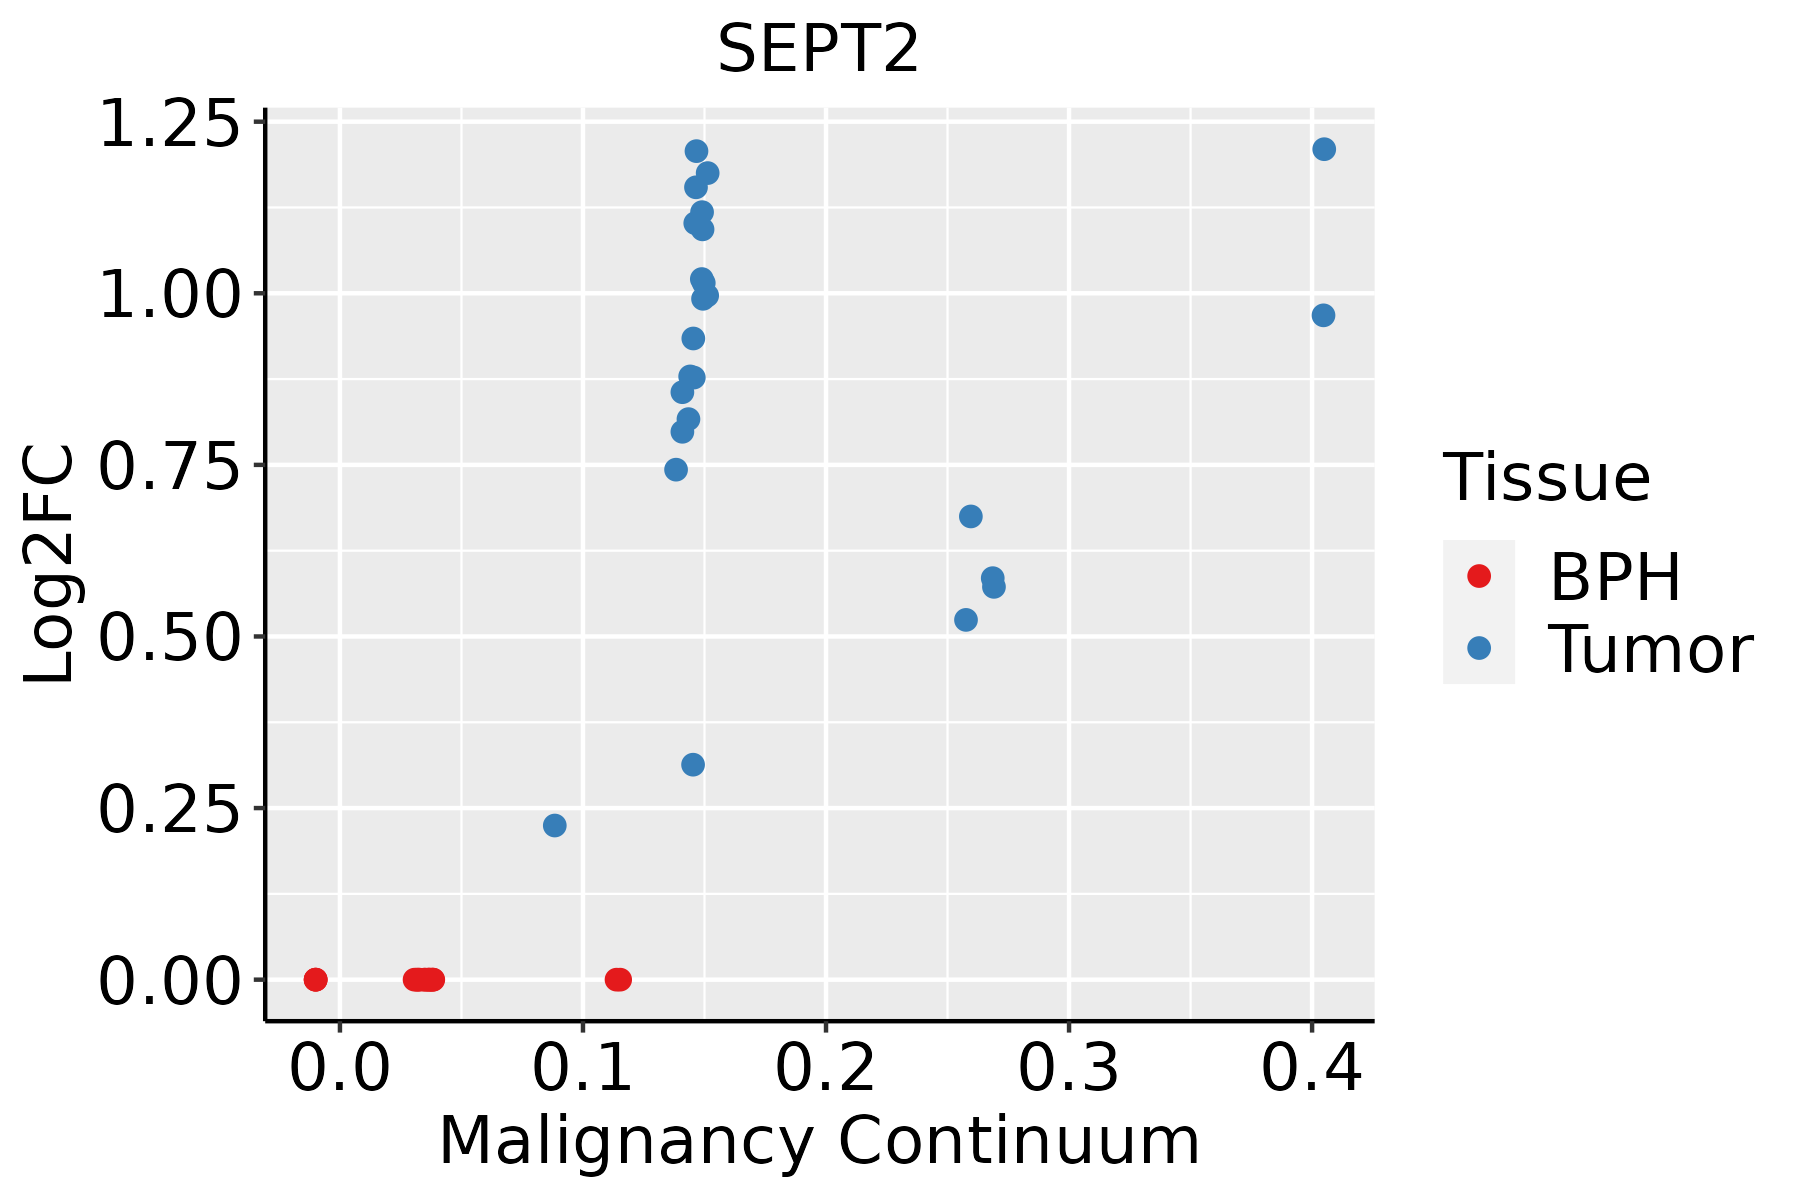
BPH: Benign Prostatic Hyperplasia
SkinThe image shows the transcriptomic changes along malignancy continuum.log2FC in expression of this searched gene in stem-like cells from each diseased tissue sample relative to stem-like cells in normal samples in each tissue plotted against the malignancy continuum. Samples are colored based on if they are from different disease stage.
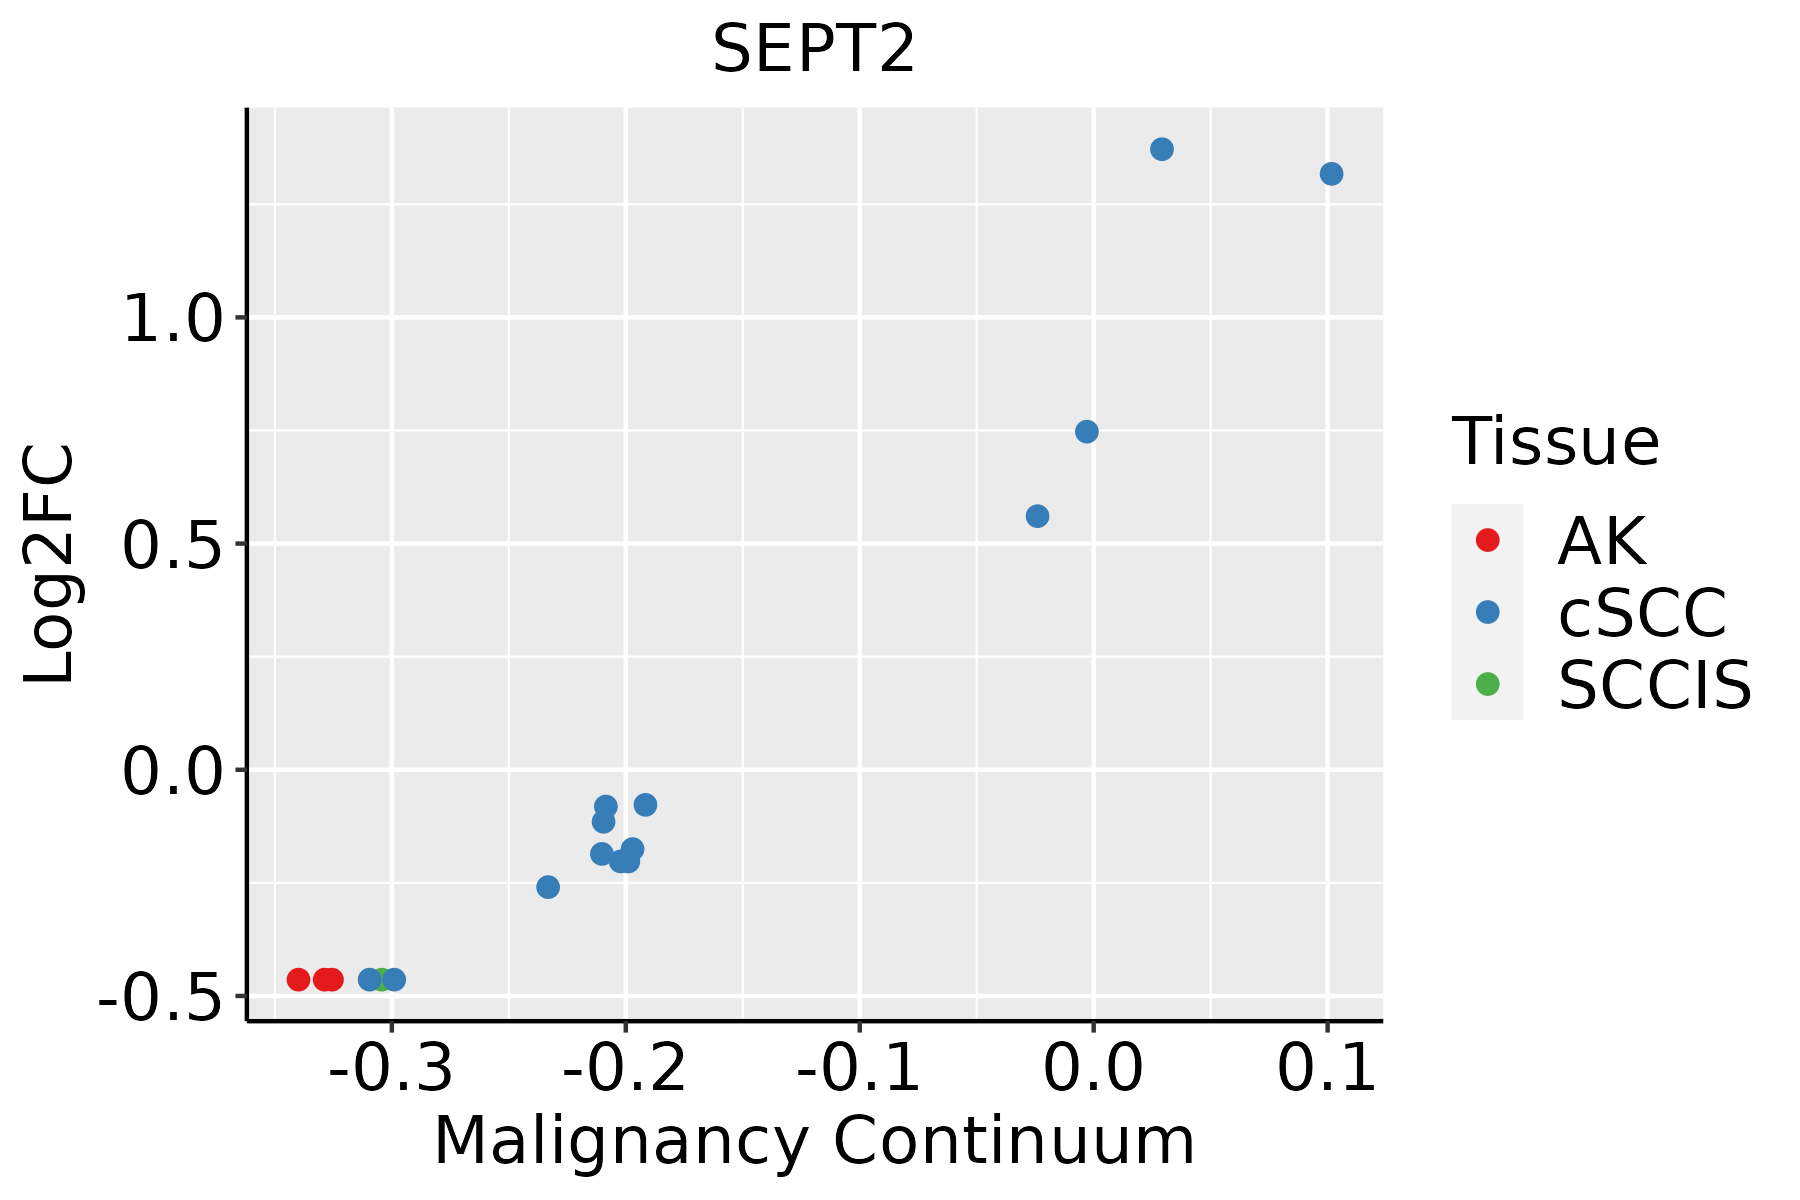
AK: Actinic keratosis
cSCC: Cutaneous squamous cell carcinoma
SCCIS:squamous cell carcinoma in situ
ThyroidThe image shows the transcriptomic changes along malignancy continuum.log2FC in expression of this searched gene in stem-like cells from each diseased tissue sample relative to stem-like cells in normal samples in each tissue plotted against the malignancy continuum. Samples are colored based on if they are from different disease stage.
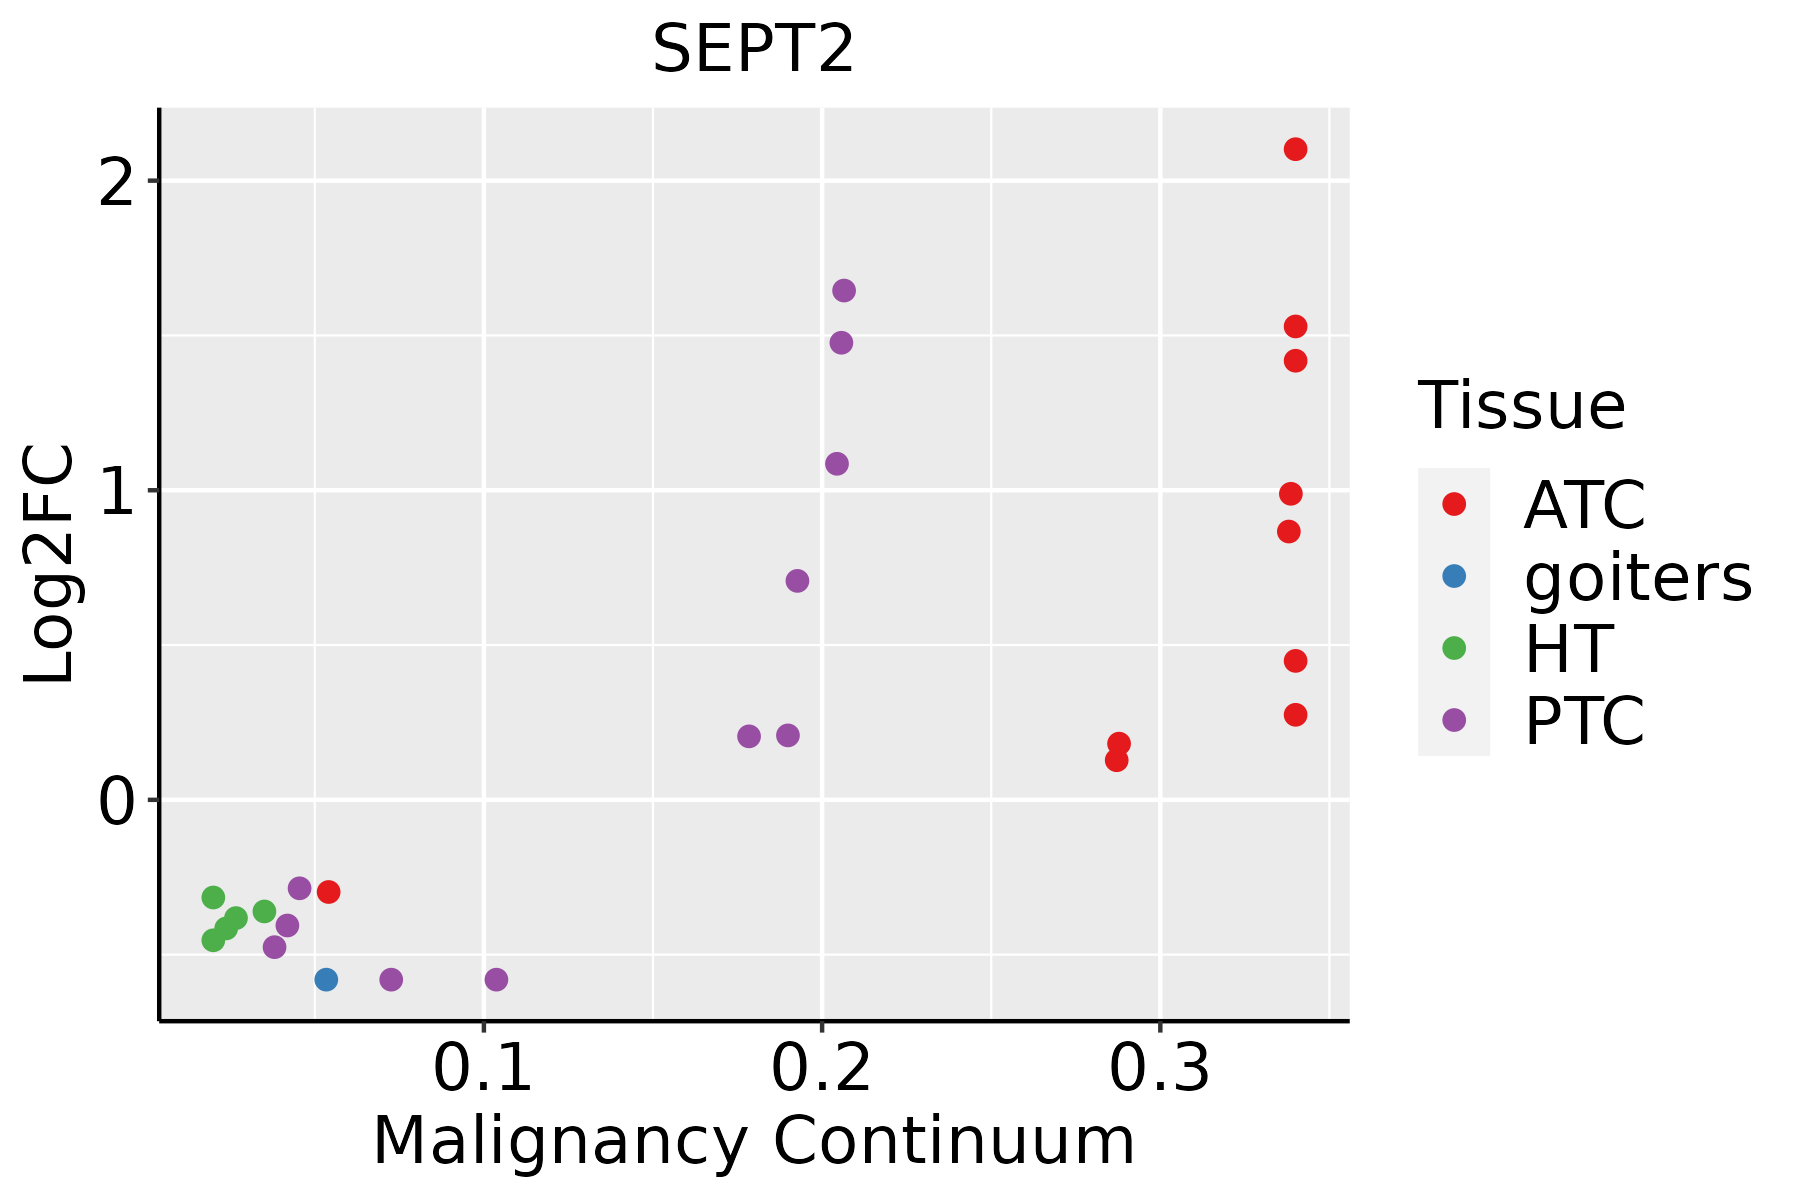
ATC: Anaplastic thyroid cancer
HT: Hashimoto's thyroiditis
PTC: Papillary thyroid cancer
∗log2FC in expression of this searched gene in stem-like cells from each diseased tissue sample relative to stem-like cells in normal samples in each tissue plotted against the malignancy continuum. Samples are colored based on if they are from different disease stage.

Top

Malignant transformation related pathway analysis

check buttonFind out the enriched GO biological processes and KEGG pathways involved in transition from healthy to precancer to cancer
check button Figure of enriched GO biological processes.
TissueDisease StageEnriched GO biological Processes
ColorectumADGO analysis - Figure of enriched GO biological processes: Top 15 enriched GO BP terms are showed in the bar plot of each disease state in each tissue. Each row represents a significant GO biological process which is colored according to the -log10(p.adjust).
ColorectumSERGO analysis - Figure of enriched GO biological processes: Top 15 enriched GO BP terms are showed in the bar plot of each disease state in each tissue. Each row represents a significant GO biological process which is colored according to the -log10(p.adjust).
ColorectumMSSGO analysis - Figure of enriched GO biological processes: Top 15 enriched GO BP terms are showed in the bar plot of each disease state in each tissue. Each row represents a significant GO biological process which is colored according to the -log10(p.adjust).
ColorectumMSI-HGO analysis - Figure of enriched GO biological processes: Top 15 enriched GO BP terms are showed in the bar plot of each disease state in each tissue. Each row represents a significant GO biological process which is colored according to the -log10(p.adjust).
ColorectumFAPGO analysis - Figure of enriched GO biological processes: Top 15 enriched GO BP terms are showed in the bar plot of each disease state in each tissue. Each row represents a significant GO biological process which is colored according to the -log10(p.adjust).
∗Top 15 enriched GO BP terms are showed in the bar plot of each disease state in each tissue. Each row represents a significant GO biological process which is colored according to the -log10(p.adjust).
Page: 1 2 3 4 5 6 7 8 9 

check button Enriched GO biological processes.
GO IDTissueDisease StageDescriptionGene RatioBg Ratiopvaluep.adjustCount
Page: 1 

check button Enriched KEGG pathways.
Pathway IDTissueDisease StageDescriptionGene RatioBg Ratiopvaluep.adjustqvalueCount
hsa0513120CervixCCShigellosis69/1267247/84657.64e-081.03e-066.10e-0769
hsa0510020CervixCCBacterial invasion of epithelial cells23/126777/84656.25e-042.93e-031.73e-0323
hsa05131110CervixCCShigellosis69/1267247/84657.64e-081.03e-066.10e-0769
hsa05100110CervixCCBacterial invasion of epithelial cells23/126777/84656.25e-042.93e-031.73e-0323
hsa0513125CervixHSIL_HPVShigellosis27/459247/84653.78e-043.49e-032.82e-0327
hsa0513135CervixHSIL_HPVShigellosis27/459247/84653.78e-043.49e-032.82e-0327
hsa0513145CervixN_HPVShigellosis23/349247/84652.10e-041.75e-031.37e-0323
hsa0510025CervixN_HPVBacterial invasion of epithelial cells10/34977/84651.17e-037.93e-036.20e-0310
hsa0513155CervixN_HPVShigellosis23/349247/84652.10e-041.75e-031.37e-0323
hsa0510035CervixN_HPVBacterial invasion of epithelial cells10/34977/84651.17e-037.93e-036.20e-0310
hsa05131ColorectumADShigellosis109/2092247/84651.09e-112.44e-101.55e-10109
hsa05100ColorectumADBacterial invasion of epithelial cells44/209277/84651.13e-092.22e-081.42e-0844
hsa051311ColorectumADShigellosis109/2092247/84651.09e-112.44e-101.55e-10109
hsa051001ColorectumADBacterial invasion of epithelial cells44/209277/84651.13e-092.22e-081.42e-0844
hsa051312ColorectumSERShigellosis87/1580247/84653.07e-107.27e-095.28e-0987
hsa051002ColorectumSERBacterial invasion of epithelial cells36/158077/84651.56e-083.45e-072.50e-0736
hsa051313ColorectumSERShigellosis87/1580247/84653.07e-107.27e-095.28e-0987
hsa051003ColorectumSERBacterial invasion of epithelial cells36/158077/84651.56e-083.45e-072.50e-0736
hsa0513126EndometriumAEHShigellosis78/1197247/84659.23e-132.00e-111.46e-1178
hsa0510026EndometriumAEHBacterial invasion of epithelial cells32/119777/84653.28e-095.91e-084.33e-0832
Page: 1 2 3 

Top

Cell-cell communication analysis

check buttonIdentification of potential cell-cell interactions between two cell types and their ligand-receptor pairs for different disease states
LigandReceptorLRpairPathwayTissueDisease Stage
Page: 1 

Top

Single-cell gene regulatory network inference analysis

check buttonFind out the significant the regulons (TFs) and the target genes of each regulon across cell types for different disease states
TFCell TypeTissueDisease StageTarget GeneRSSRegulon Activity
∗The dot plots of a searched regulon are shown for all cell subpopulations in each disease state of each tissue based on the regulon specific score inferred using pySCENIC and by calculating the average expression.
Page: 1 

Top

Somatic mutation of malignant transformation related genes

check buttonAnnotation of somatic variants for genes involved in malignant transformation
Hugo SymbolVariant ClassVariant ClassificationdbSNP RSHGVScHGVSpHGVSp ShortSWISSPROTBIOTYPESIFTPolyPhenTumor Sample BarcodeTissueHistologySexAgeStageTherapy TypesDrugsOutcome
SEPT2SNVMissense_Mutationc.502G>Ap.Glu168Lysp.E168KQ15019protein_codingdeleterious(0)probably_damaging(0.997)TCGA-A8-A09K-01Breastbreast invasive carcinomaFemale>=65I/IIUnknownUnknownSD
SEPT2SNVMissense_Mutationc.1160N>Tp.Gly387Valp.G387VQ15019protein_codingtolerated_low_confidence(0.12)benign(0.073)TCGA-C8-A278-01Breastbreast invasive carcinomaFemale<65III/IVHormone TherapytamoxiphenSD
SEPT2SNVMissense_Mutationnovelc.362T>Cp.Val121Alap.V121AQ15019protein_codingtolerated(0.24)possibly_damaging(0.757)TCGA-E2-A574-01Breastbreast invasive carcinomaFemale<65I/IIChemotherapyadriamycinSD
SEPT2SNVMissense_Mutationnovelc.110C>Tp.Ser37Phep.S37FQ15019protein_codingdeleterious(0)possibly_damaging(0.493)TCGA-2W-A8YY-01Cervixcervical & endocervical cancerFemale<65I/IIChemotherapycisplatinCR
SEPT2SNVMissense_Mutationnovelc.331N>Ap.Glu111Lysp.E111KQ15019protein_codingtolerated(1)benign(0.031)TCGA-JW-A5VJ-01Cervixcervical & endocervical cancerFemale<65I/IIUnknownUnknownPD
SEPT2SNVMissense_Mutationnovelc.551N>Ap.Cys184Tyrp.C184YQ15019protein_codingdeleterious(0)probably_damaging(0.964)TCGA-JW-A5VJ-01Cervixcervical & endocervical cancerFemale<65I/IIUnknownUnknownPD
SEPT2SNVMissense_Mutationnovelc.247N>Gp.Leu83Valp.L83VQ15019protein_codingdeleterious(0.01)probably_damaging(0.981)TCGA-VS-A958-01Cervixcervical & endocervical cancerFemale<65I/IIChemotherapycisplatinCR
SEPT2insertionFrame_Shift_Insnovelc.201_202insAp.Gly70ArgfsTer3p.G70Rfs*3Q15019protein_codingTCGA-C5-A1ML-01Cervixcervical & endocervical cancerFemale<65I/IIUnknownUnknownPD
SEPT2SNVMissense_Mutationc.427G>Ap.Ala143Thrp.A143TQ15019protein_codingdeleterious(0.04)possibly_damaging(0.806)TCGA-AA-3977-01Colorectumcolon adenocarcinomaMale>=65I/IIUnknownUnknownSD
SEPT2SNVMissense_Mutationc.391N>Tp.Arg131Cysp.R131CQ15019protein_codingdeleterious(0)possibly_damaging(0.676)TCGA-AA-A02O-01Colorectumcolon adenocarcinomaMale>=65I/IIUnknownUnknownSD
Page: 1 2 3 4 

Top

Related drugs of malignant transformation related genes

check buttonIdentification of chemicals and drugs interact with genes involved in malignant transfromation
(DGIdb 4.0)
Entrez IDSymbolCategoryInteraction TypesDrug Claim NameDrug NamePMIDs
Page: 1