| Entrez ID | Symbol | Replicates | Species | Organ | Tissue | Adj P-value | Log2FC | Malignancy |
| 58515 | SELENOK | GSM5353220_PA_PB1B_Pool_3_S51_L002 | Human | Prostate | Tumor | 8.55e-11 | -1.10e+00 | 0.1531 |
| 58515 | SELENOK | GSM5353221_PA_PB2A_Pool_1_3_S25_L001 | Human | Prostate | Tumor | 1.62e-34 | -1.10e+00 | 0.1633 |
| 58515 | SELENOK | GSM5353222_PA_PB2B_Pool_1_3_S52_L002 | Human | Prostate | Tumor | 9.36e-47 | -1.10e+00 | 0.1608 |
| 58515 | SELENOK | GSM5353223_PA_PB2B_Pool_2_S26_L001 | Human | Prostate | Tumor | 9.06e-30 | -1.10e+00 | 0.1604 |
| 58515 | SELENOK | GSM5353224_PA_PR5186_Pool_1_2_3_S27_L001 | Human | Prostate | Tumor | 8.88e-32 | -1.10e+00 | 0.1621 |
| 58515 | SELENOK | GSM5353225_PA_PR5196-1_Pool_1_2_3_S53_L002 | Human | Prostate | Tumor | 4.66e-18 | -1.10e+00 | 0.1619 |
| 58515 | SELENOK | GSM5353226_PA_PR5196-2_Pool_1_2_3_S54_L002 | Human | Prostate | Tumor | 2.68e-12 | -1.10e+00 | 0.159 |
| 58515 | SELENOK | GSM5353227_PA_PR5199-193K_Pool_1_2_3_S55_L002 | Human | Prostate | Tumor | 4.80e-36 | -1.10e+00 | 0.1602 |
| 58515 | SELENOK | GSM5353228_PA_PR5199-640K_Pool_1_3_S108_L004 | Human | Prostate | Tumor | 3.57e-07 | -1.10e+00 | 0.1537 |
| 58515 | SELENOK | GSM5353232_PA_PR5249_T1_S3_L001 | Human | Prostate | Tumor | 2.75e-10 | -1.10e+00 | 0.1439 |
| 58515 | SELENOK | GSM5353236_PA_PR5251_T1_S7_L001 | Human | Prostate | Tumor | 1.94e-19 | -1.10e+00 | 0.1608 |
| 58515 | SELENOK | GSM5353237_PA_PR5251_T2_S8_L001 | Human | Prostate | Tumor | 2.68e-12 | -1.10e+00 | 0.1622 |
| 58515 | SELENOK | GSM5353240_PA_PR5254_T1_S15_L001 | Human | Prostate | Tumor | 6.07e-53 | -1.10e+00 | 0.1575 |
| 58515 | SELENOK | GSM5353243_PA_PR5261_T1_S23_L002 | Human | Prostate | Tumor | 1.49e-57 | -1.10e+00 | 0.1545 |
| 58515 | SELENOK | GSM5353244_PA_PR5261_T2_S24_L002 | Human | Prostate | Tumor | 9.72e-46 | -1.10e+00 | 0.1569 |
| 58515 | SELENOK | GSM5353247_PA_PR5269_3_S27_L002 | Human | Prostate | Tumor | 4.15e-06 | -1.10e+00 | 0.1532 |
| 58515 | SELENOK | GSM5353248_PA_PR5269_4_S28_L002 | Human | Prostate | Tumor | 8.91e-10 | -1.10e+00 | 0.1541 |
| 58515 | SELENOK | Pat01-B | Human | Stomach | GC | 1.54e-46 | 7.76e-01 | 0.5754 |
| 58515 | SELENOK | Pat02-B | Human | Stomach | GC | 2.04e-67 | 9.27e-01 | 0.0368 |
| 58515 | SELENOK | Pat03-B | Human | Stomach | GC | 5.06e-40 | 7.01e-01 | 0.3693 |
| Tissue | Expression Dynamics | Abbreviation |
| Breast |  | IDC: Invasive ductal carcinoma |
| DCIS: Ductal carcinoma in situ |
| Precancer(BRCA1-mut): Precancerous lesion from BRCA1 mutation carriers |
| Cervix | 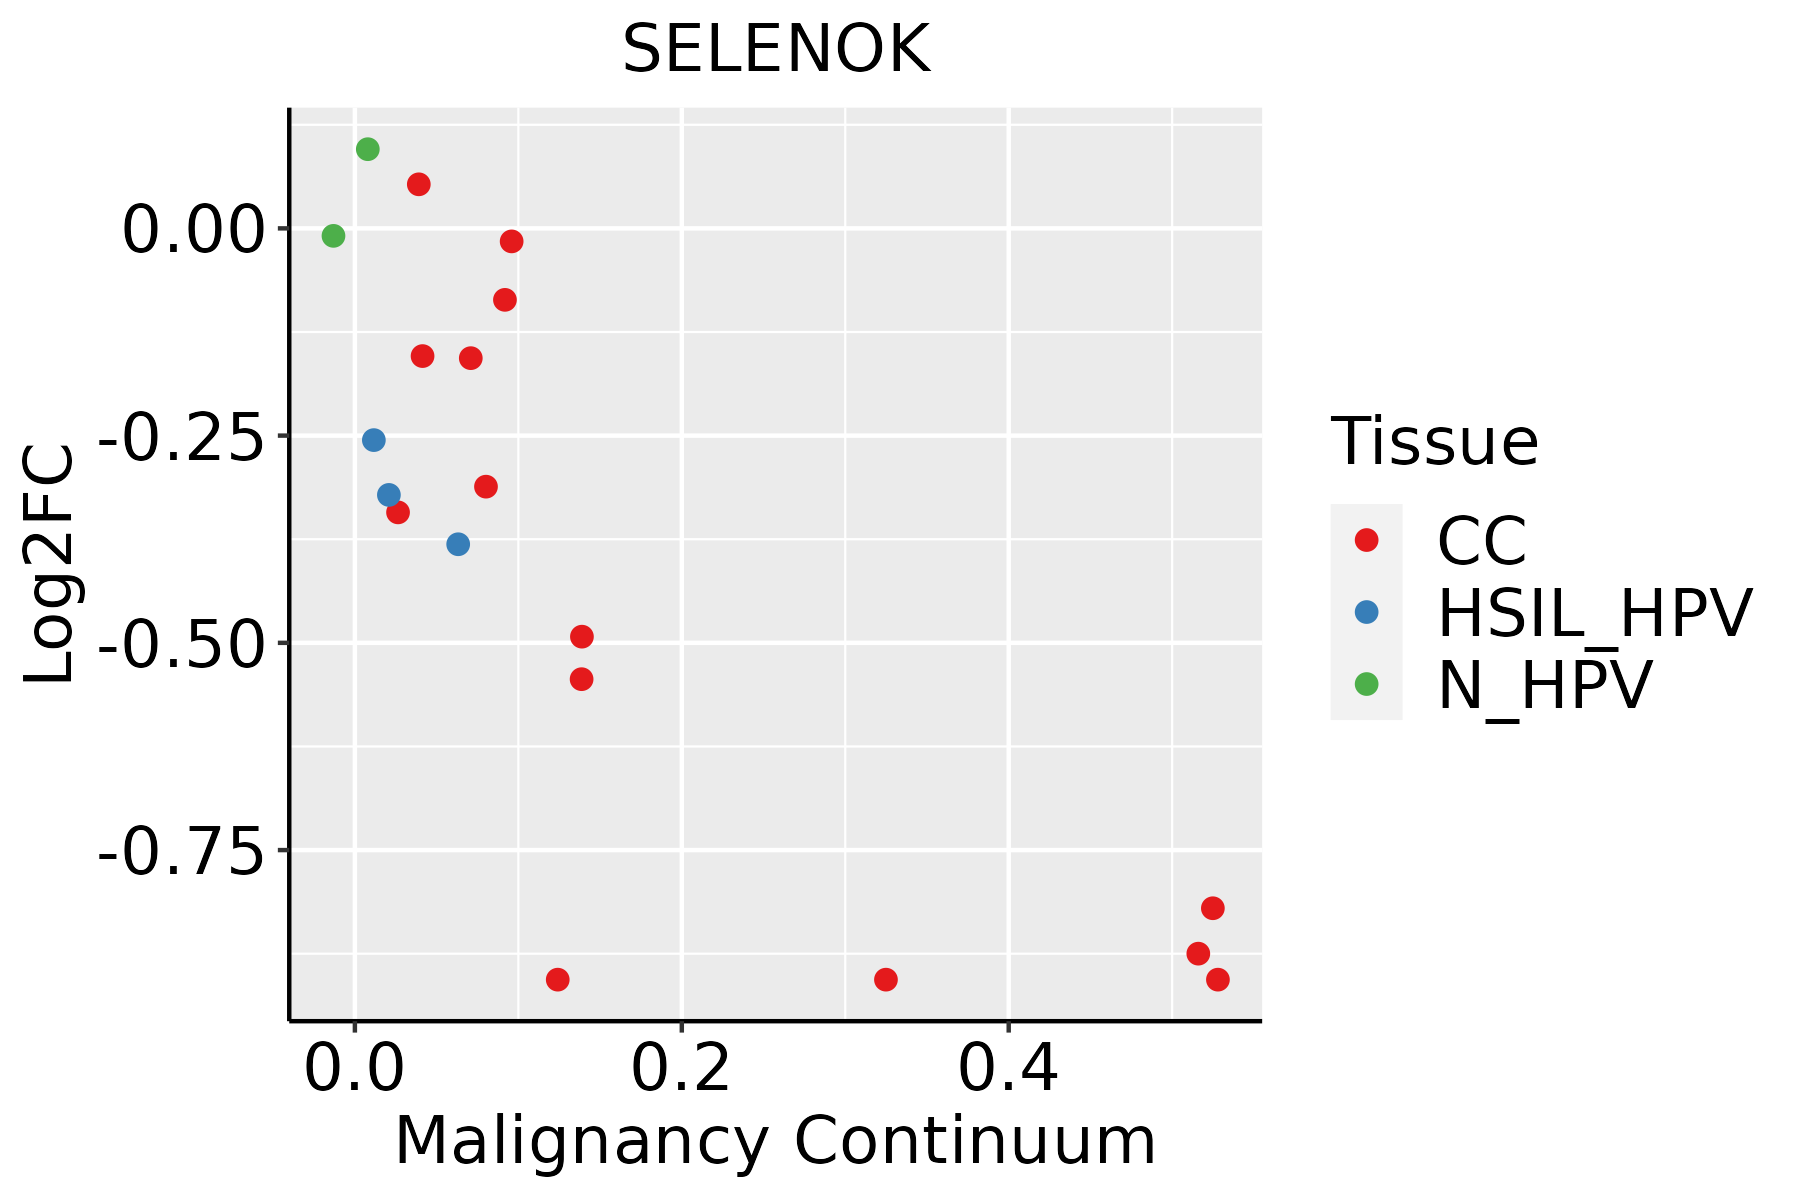 | CC: Cervix cancer |
| HSIL_HPV: HPV-infected high-grade squamous intraepithelial lesions |
| N_HPV: HPV-infected normal cervix |
| Colorectum (GSE201348) |  | FAP: Familial adenomatous polyposis |
| CRC: Colorectal cancer |
| Colorectum (HTA11) | 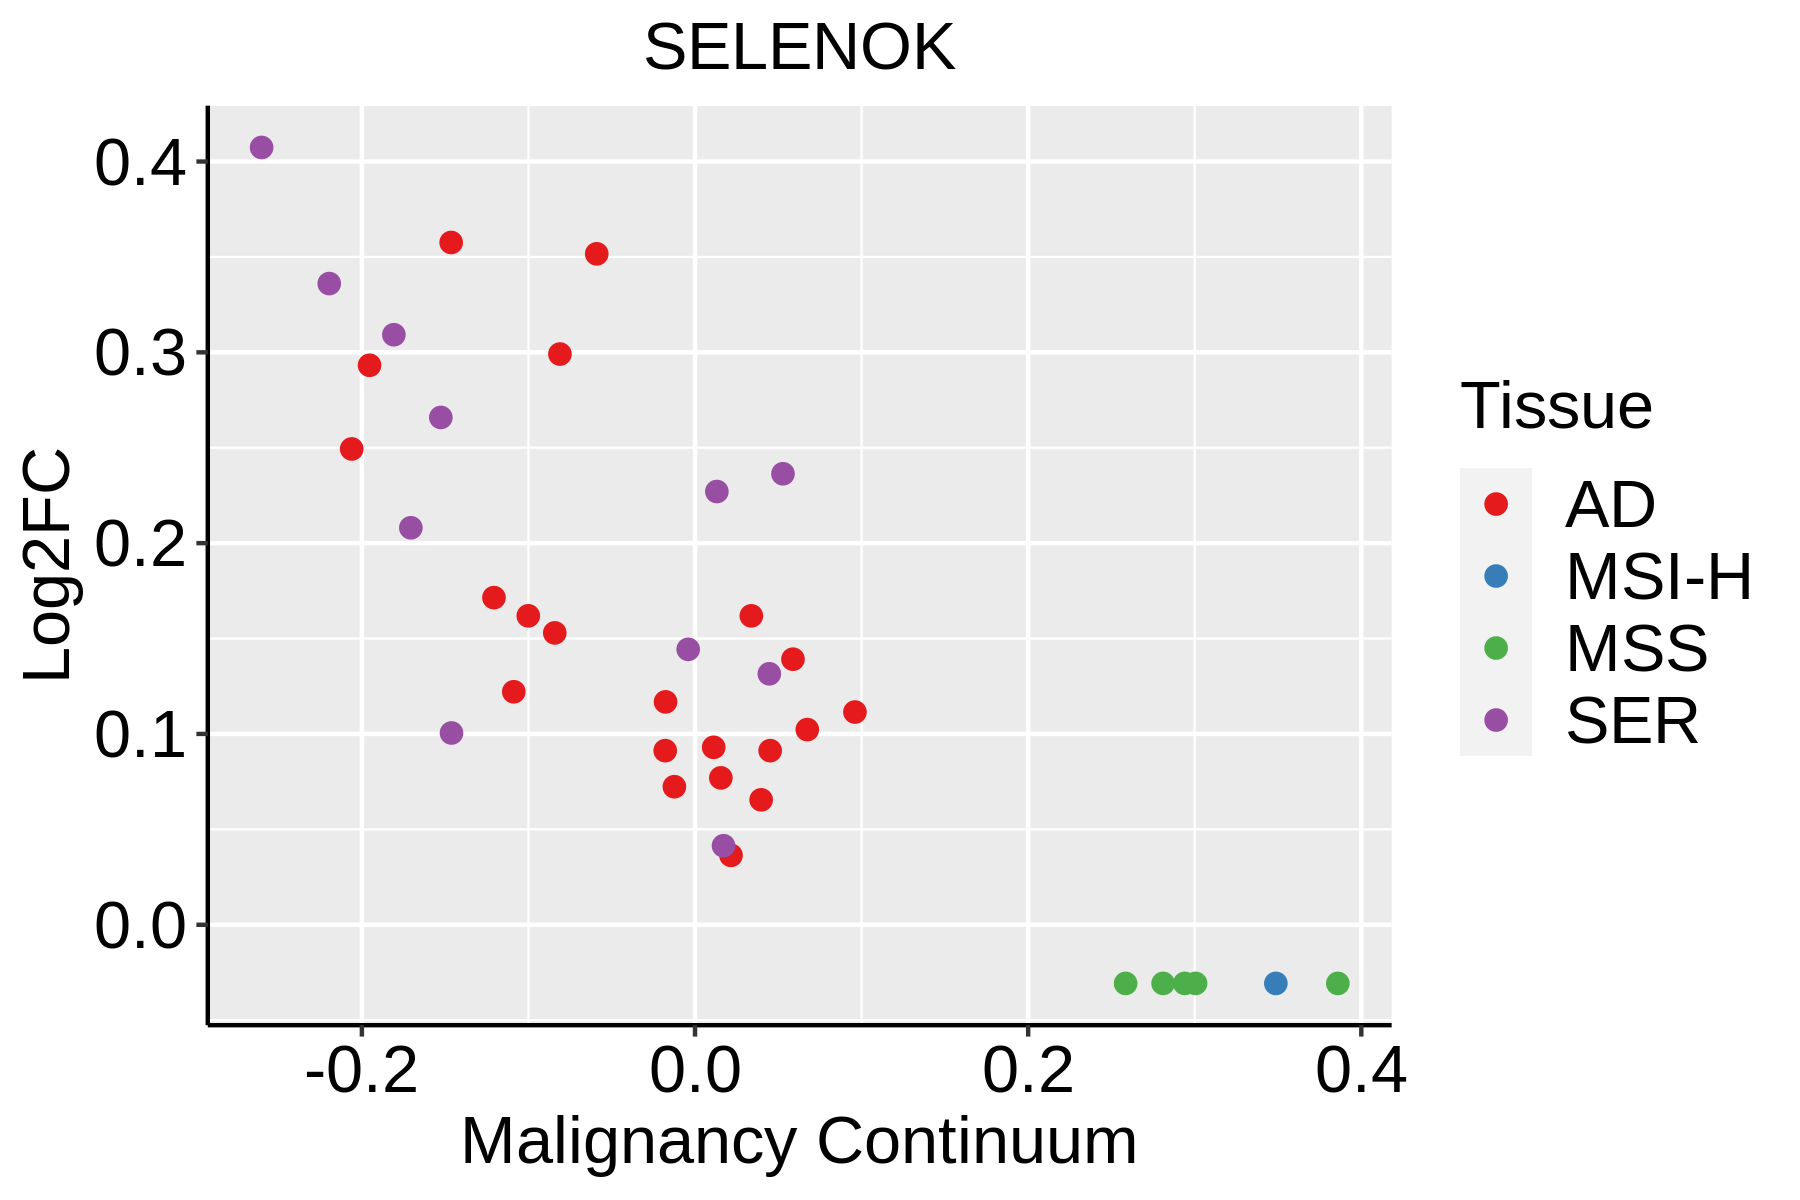 | AD: Adenomas |
| SER: Sessile serrated lesions |
| MSI-H: Microsatellite-high colorectal cancer |
| MSS: Microsatellite stable colorectal cancer |
| Endometrium |  | AEH: Atypical endometrial hyperplasia |
| EEC: Endometrioid Cancer |
| Esophagus | 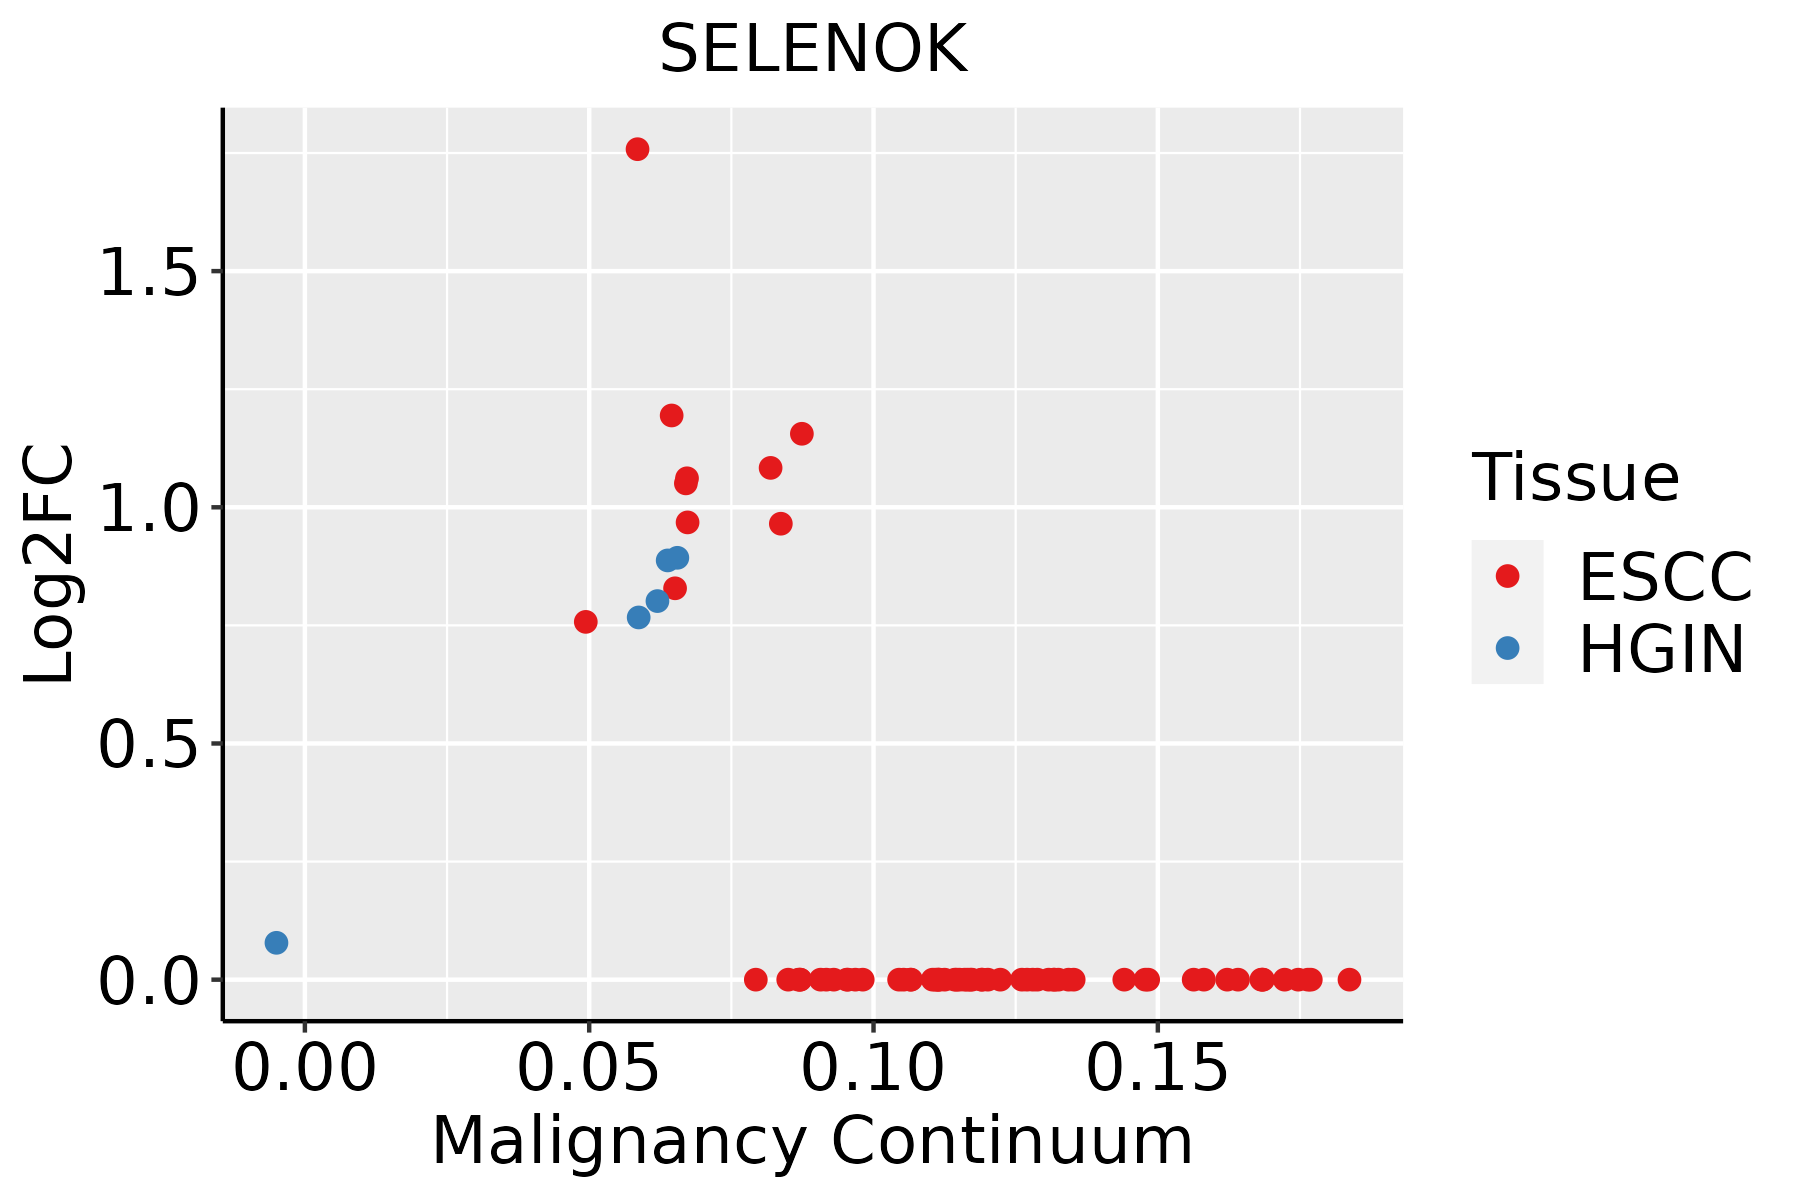 | ESCC: Esophageal squamous cell carcinoma |
| HGIN: High-grade intraepithelial neoplasias |
| LGIN: Low-grade intraepithelial neoplasias |
| GC | 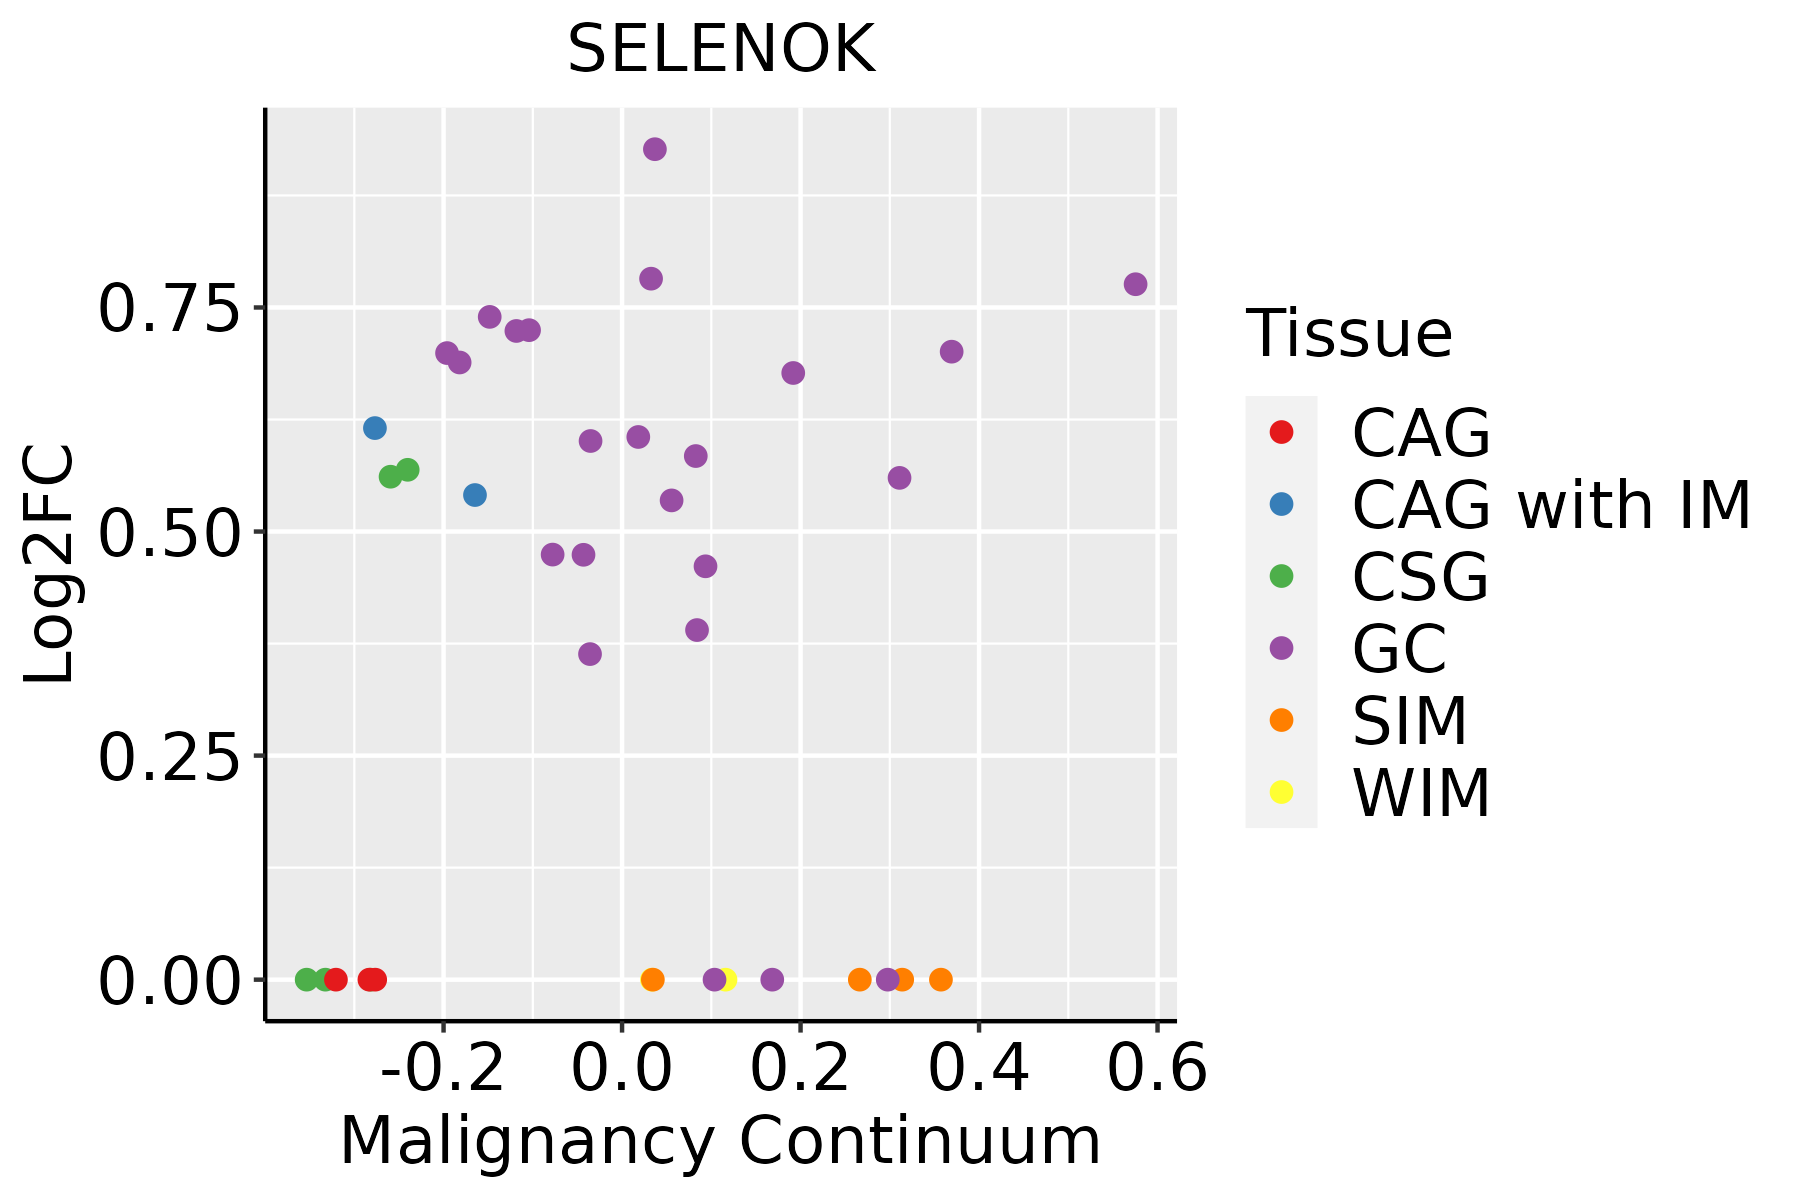 | CAG: Chronic atrophic gastritis |
| CAG with IM: Chronic atrophic gastritis with intestinal metaplasia |
| CSG: Chronic superficial gastritis |
| GC: Gastric cancer |
| SIM: Severe intestinal metaplasia |
| WIM: Wild intestinal metaplasia |
| Liver | 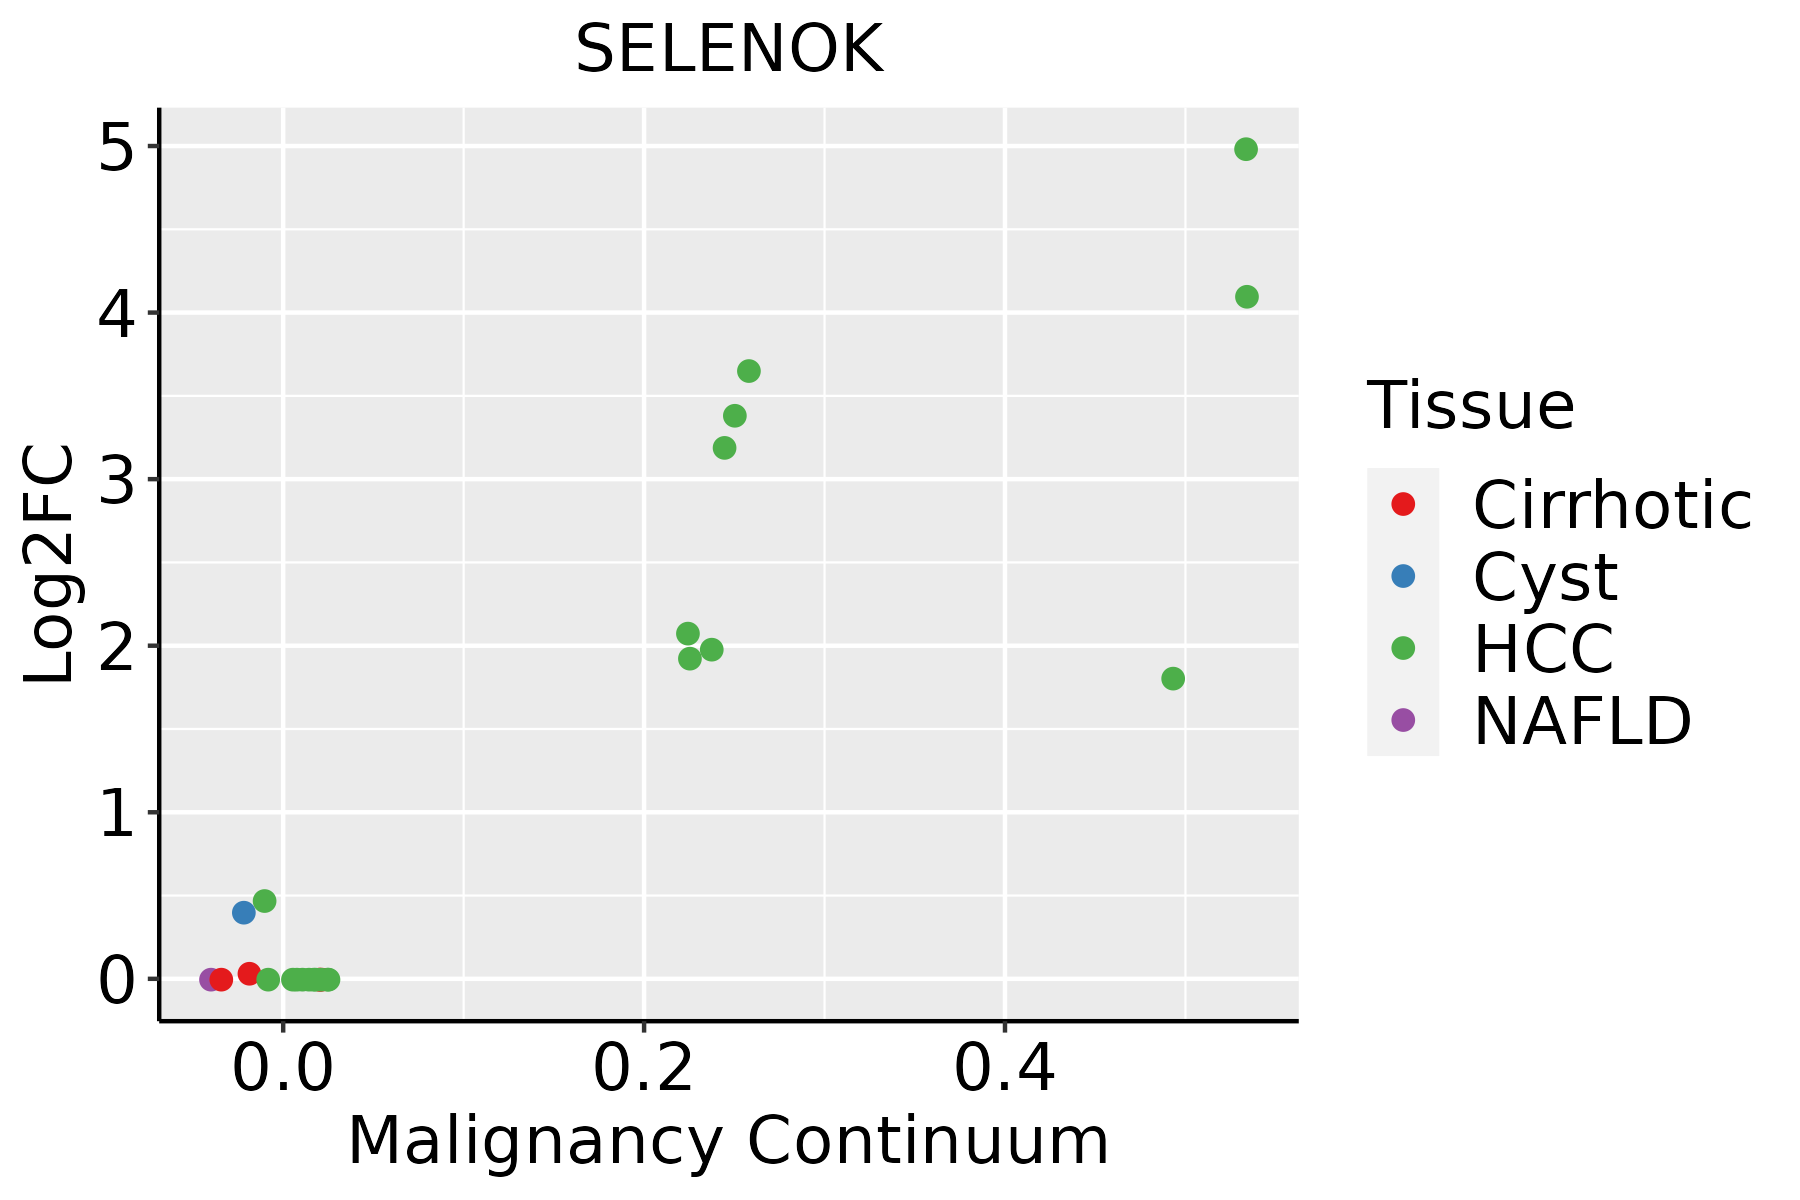 | HCC: Hepatocellular carcinoma |
| NAFLD: Non-alcoholic fatty liver disease |
| Lung | 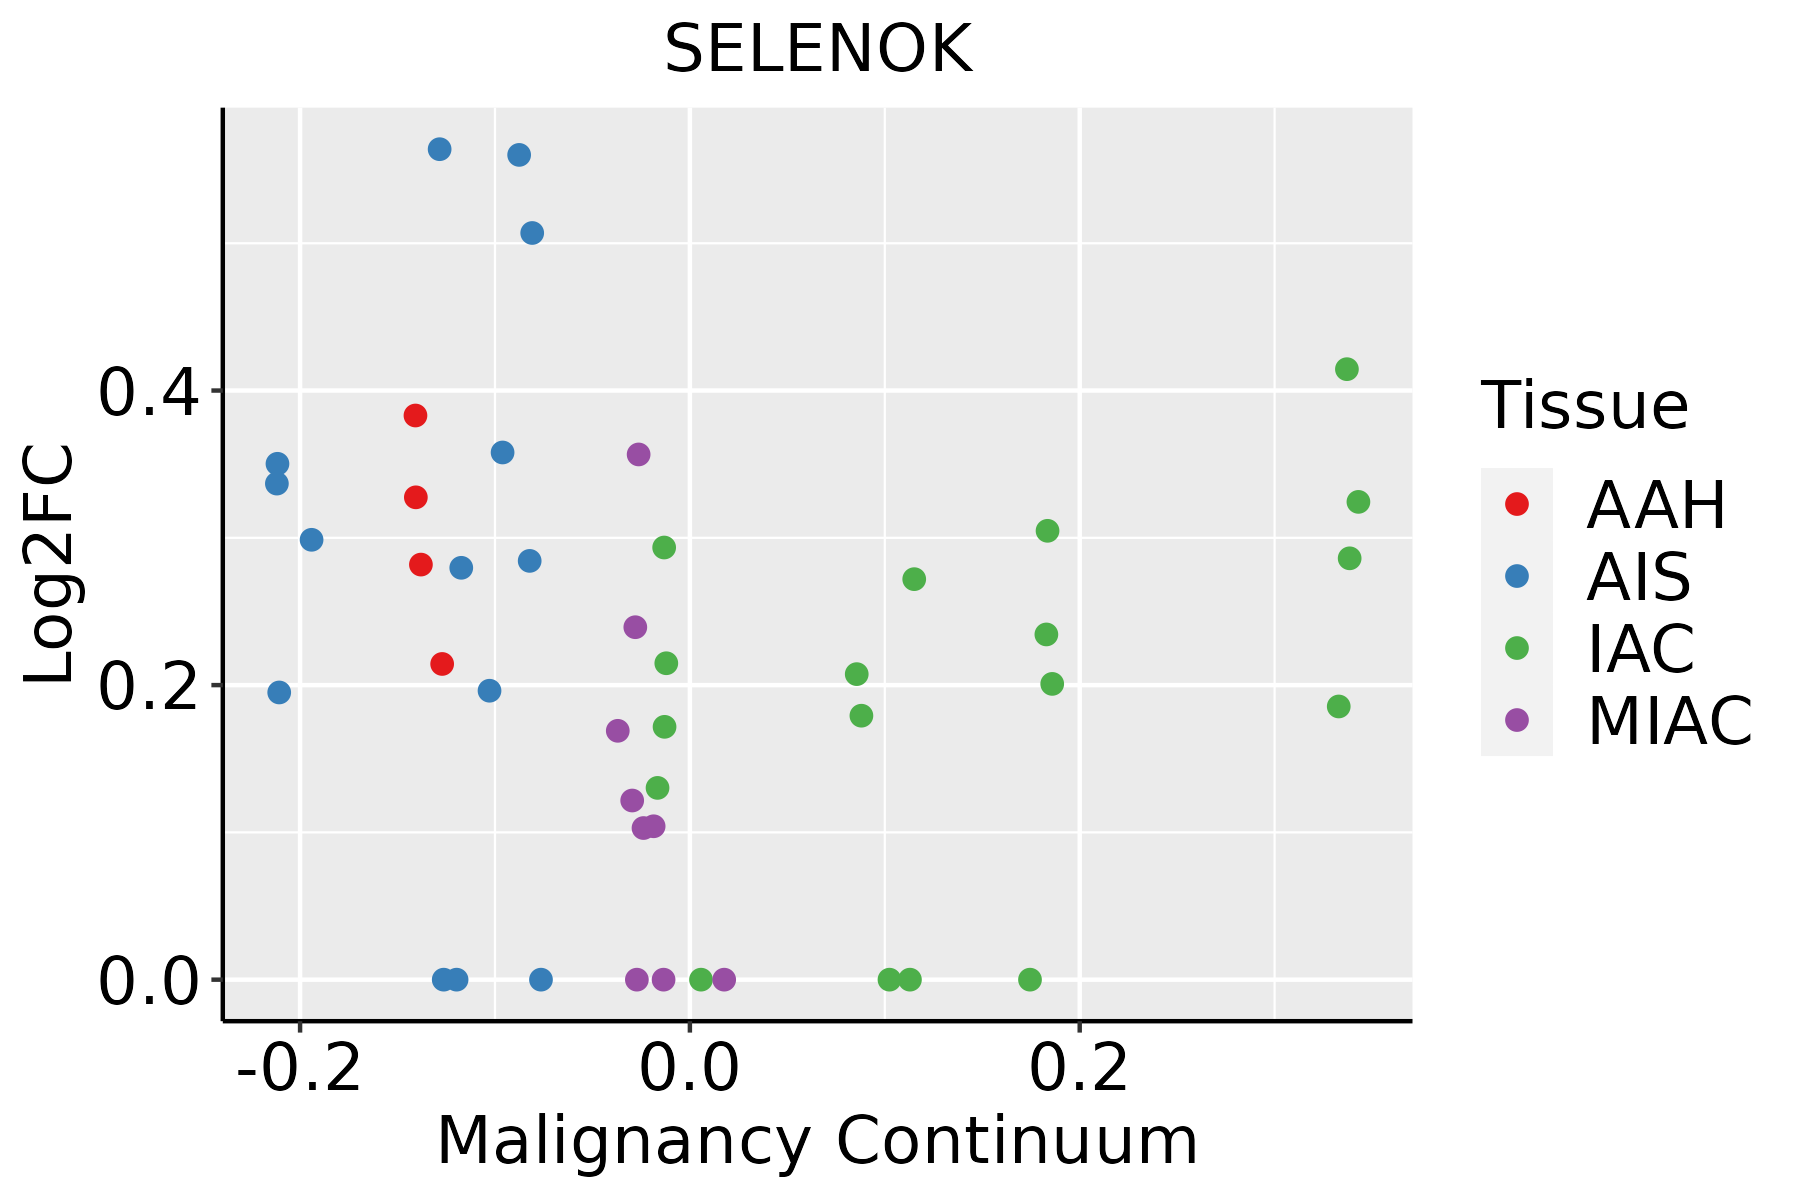 | AAH: Atypical adenomatous hyperplasia |
| AIS: Adenocarcinoma in situ |
| IAC: Invasive lung adenocarcinoma |
| MIA: Minimally invasive adenocarcinoma |
| Oral Cavity | 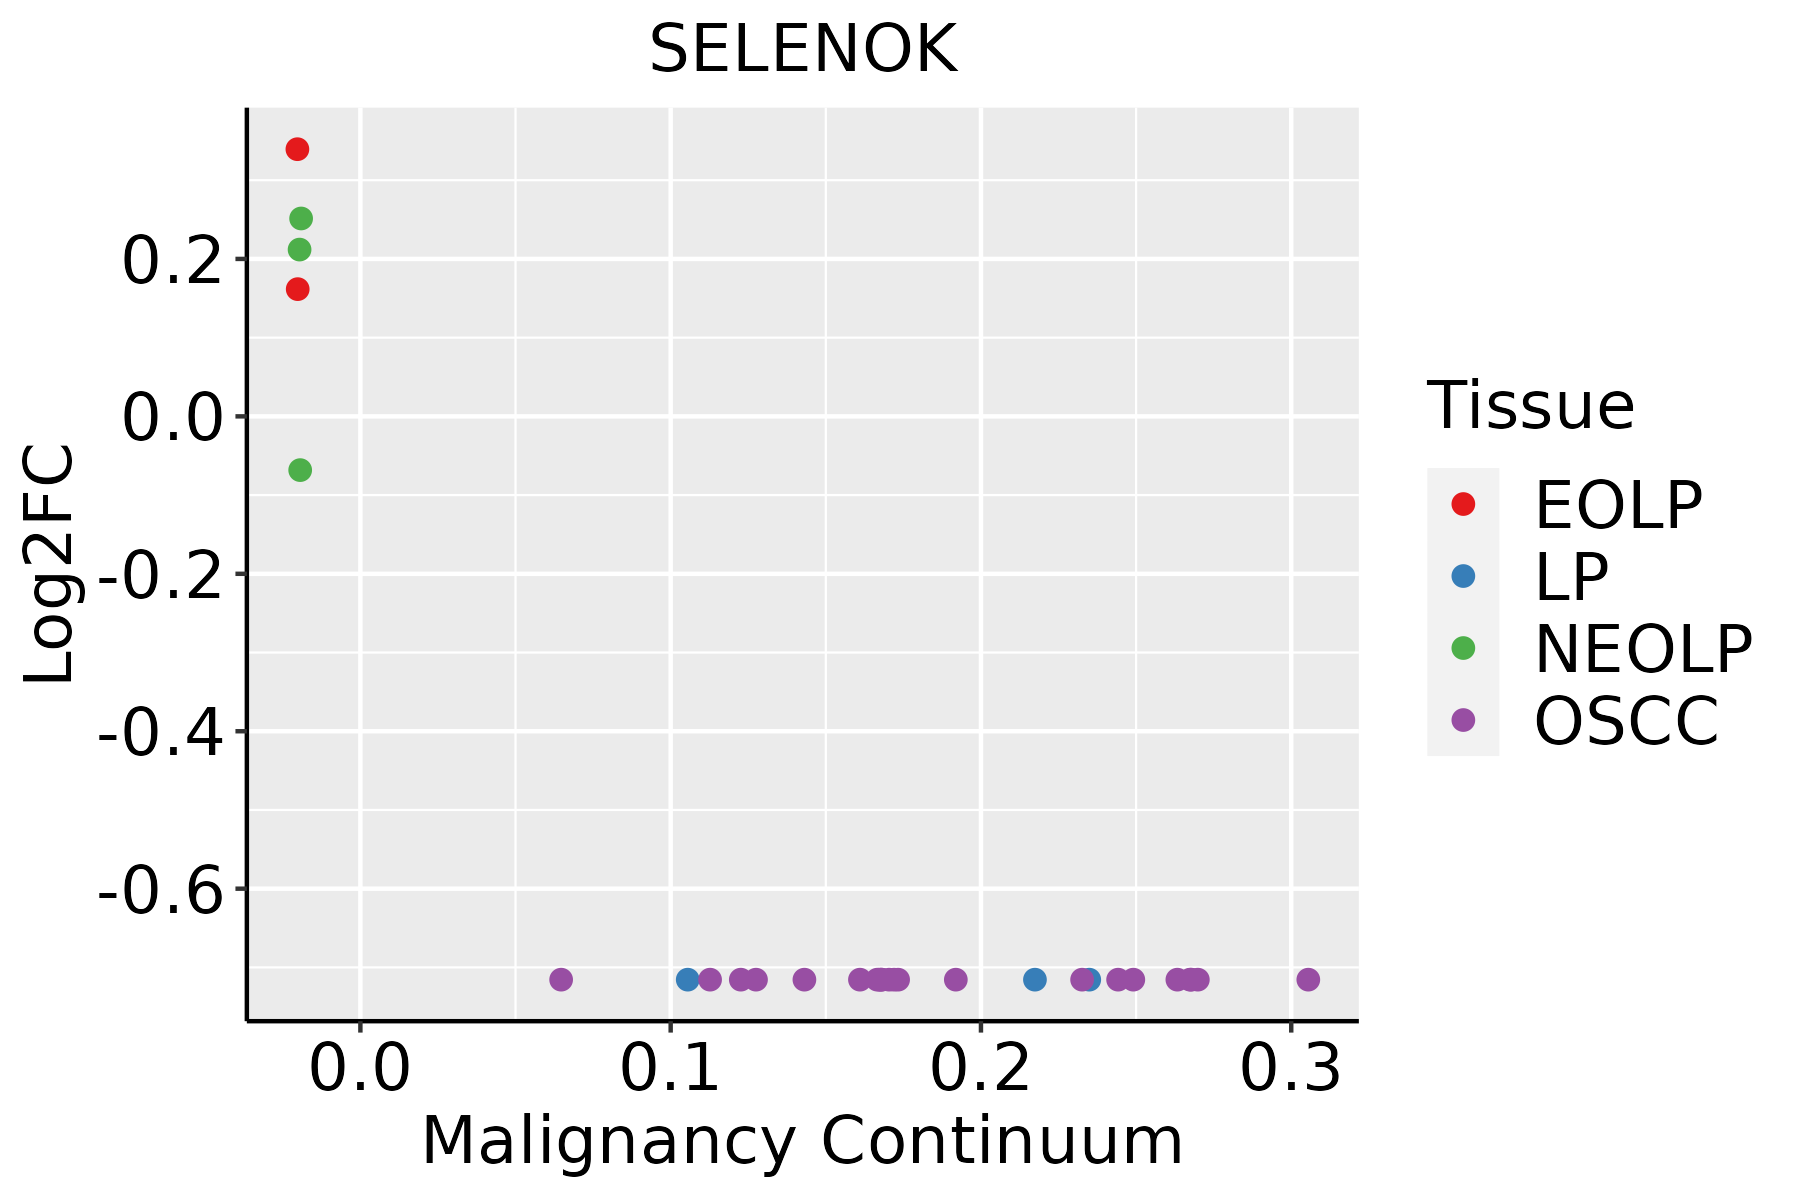 | EOLP: Erosive Oral lichen planus |
| LP: leukoplakia |
| NEOLP: Non-erosive oral lichen planus |
| OSCC: Oral squamous cell carcinoma |
| Prostate | 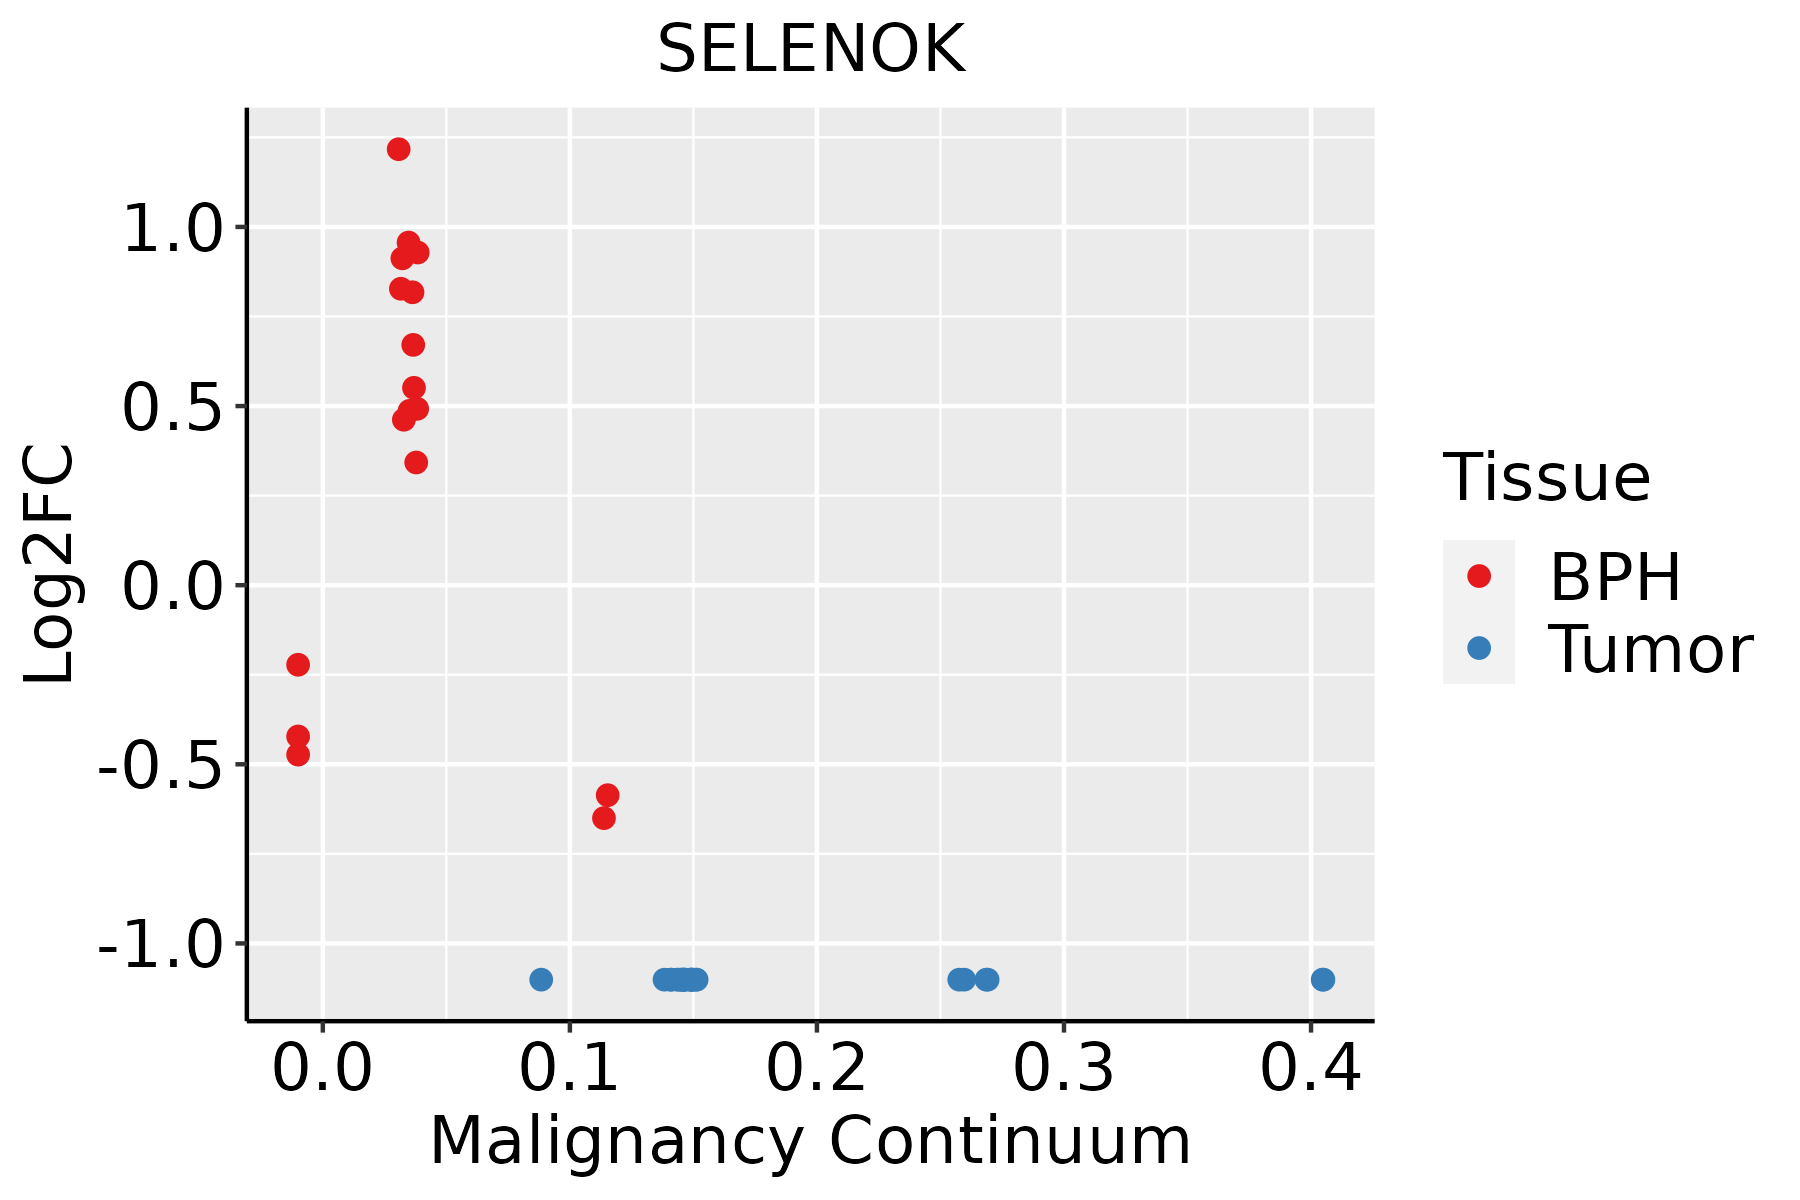 | BPH: Benign Prostatic Hyperplasia |
| Thyroid |  | ATC: Anaplastic thyroid cancer |
| HT: Hashimoto's thyroiditis |
| PTC: Papillary thyroid cancer |
| GO ID | Tissue | Disease Stage | Description | Gene Ratio | Bg Ratio | pvalue | p.adjust | Count |
| GO:00971939 | Breast | Precancer | intrinsic apoptotic signaling pathway | 59/1080 | 288/18723 | 8.07e-18 | 3.60e-15 | 59 |
| GO:00069799 | Breast | Precancer | response to oxidative stress | 70/1080 | 446/18723 | 1.59e-14 | 4.26e-12 | 70 |
| GO:00349769 | Breast | Precancer | response to endoplasmic reticulum stress | 38/1080 | 256/18723 | 7.89e-08 | 4.60e-06 | 38 |
| GO:00509006 | Breast | Precancer | leukocyte migration | 47/1080 | 369/18723 | 2.82e-07 | 1.39e-05 | 47 |
| GO:00457859 | Breast | Precancer | positive regulation of cell adhesion | 52/1080 | 437/18723 | 5.74e-07 | 2.49e-05 | 52 |
| GO:00018196 | Breast | Precancer | positive regulation of cytokine production | 52/1080 | 467/18723 | 4.18e-06 | 1.29e-04 | 52 |
| GO:00421107 | Breast | Precancer | T cell activation | 52/1080 | 487/18723 | 1.37e-05 | 3.42e-04 | 52 |
| GO:00508707 | Breast | Precancer | positive regulation of T cell activation | 29/1080 | 216/18723 | 1.94e-05 | 4.58e-04 | 29 |
| GO:19030396 | Breast | Precancer | positive regulation of leukocyte cell-cell adhesion | 30/1080 | 239/18723 | 5.13e-05 | 1.07e-03 | 30 |
| GO:00026856 | Breast | Precancer | regulation of leukocyte migration | 27/1080 | 210/18723 | 7.93e-05 | 1.54e-03 | 27 |
| GO:00508637 | Breast | Precancer | regulation of T cell activation | 37/1080 | 329/18723 | 8.04e-05 | 1.56e-03 | 37 |
| GO:00224098 | Breast | Precancer | positive regulation of cell-cell adhesion | 33/1080 | 284/18723 | 1.03e-04 | 1.89e-03 | 33 |
| GO:00071597 | Breast | Precancer | leukocyte cell-cell adhesion | 40/1080 | 371/18723 | 1.07e-04 | 1.94e-03 | 40 |
| GO:00457305 | Breast | Precancer | respiratory burst | 9/1080 | 37/18723 | 1.96e-04 | 3.10e-03 | 9 |
| GO:00224079 | Breast | Precancer | regulation of cell-cell adhesion | 45/1080 | 448/18723 | 2.12e-04 | 3.30e-03 | 45 |
| GO:00700598 | Breast | Precancer | intrinsic apoptotic signaling pathway in response to endoplasmic reticulum stress | 12/1080 | 63/18723 | 2.21e-04 | 3.37e-03 | 12 |
| GO:19030377 | Breast | Precancer | regulation of leukocyte cell-cell adhesion | 36/1080 | 336/18723 | 2.61e-04 | 3.84e-03 | 36 |
| GO:00716744 | Breast | Precancer | mononuclear cell migration | 24/1080 | 196/18723 | 4.03e-04 | 5.44e-03 | 24 |
| GO:00026877 | Breast | Precancer | positive regulation of leukocyte migration | 18/1080 | 135/18723 | 7.60e-04 | 9.04e-03 | 18 |
| GO:00716774 | Breast | Precancer | positive regulation of mononuclear cell migration | 11/1080 | 65/18723 | 1.13e-03 | 1.25e-02 | 11 |


