Schematic overview of the cellular and molecular mechanisms involved in the cancer progression, including the proposed cellular and molecular mechanisms in cancer cells trajectory. AT1: alveolar type 1 cells; AT2: alveolar type 2 cells; AAH: atypical adenomatous hyperplasia; AIS: adenocarcinoma in situ; MIA: minimally invasive adenocarcinoma; IA: invasive adenocarcinoma; EMT: epithelial-mesenchymal transition

Home

Download

Statistics

Help

Contact

Center for Computational Systems Medicine
leaf

Gene summary

leaf

Malignant transformation analysis

leaf

Malignant transformation related pathway analysis

leaf

Cell-cell communication analysis

leaf

Single-cell gene regulatory network inference analysis

leaf

Somatic mutation of malignant transformation related genes

leaf

Related drugs of malignant transformation related genes

Gene: SCAMP2

Gene summary for SCAMP2

check button Gene summary.

Gene informationSpeciesHuman
Gene symbol

SCAMP2

Gene ID

10066

Gene namesecretory carrier membrane protein 2
Gene AliasSCAMP2
Cytomap15q24.1
Gene Typeprotein-coding
GO ID

GO:0006810

UniProtAcc

A8K769


Top

Malignant transformation analysis

check button Identification of the aberrant gene expression in precancerous and cancerous lesions by comparing the gene expression of stem-like cells in diseased tissues with normal stem cells
check button Malignant transformation involving gene list.
Entrez IDSymbolReplicatesSpeciesOrganTissueAdj P-valueLog2FCMalignancy
10066SCAMP2SYSMH1HumanOral cavityOSCC7.12e-224.79e-010.1127
10066SCAMP2SYSMH2HumanOral cavityOSCC6.80e-195.00e-010.2326
10066SCAMP2SYSMH3HumanOral cavityOSCC1.48e-235.97e-010.2442
10066SCAMP2SYSMH4HumanOral cavityOSCC3.85e-028.84e-020.1226
10066SCAMP2SYSMH5HumanOral cavityOSCC1.12e-073.34e-010.0647
10066SCAMP2SYSMH6HumanOral cavityOSCC5.80e-083.89e-010.1275
10066SCAMP2P1_cSCCHumanSkincSCC2.53e-155.28e-010.0292
10066SCAMP2P2_cSCCHumanSkincSCC1.85e-042.57e-01-0.024
10066SCAMP2P4_cSCCHumanSkincSCC1.03e-143.86e-01-0.00290000000000005
10066SCAMP2P10_cSCCHumanSkincSCC1.07e-165.96e-010.1017
10066SCAMP2male-WTAHumanThyroidPTC3.41e-393.98e-010.1037
10066SCAMP2PTC01HumanThyroidPTC1.45e-132.96e-010.1899
10066SCAMP2PTC04HumanThyroidPTC1.14e-133.12e-010.1927
10066SCAMP2PTC05HumanThyroidPTC2.16e-217.35e-010.2065
10066SCAMP2PTC06HumanThyroidPTC1.05e-337.01e-010.2057
10066SCAMP2PTC07HumanThyroidPTC1.61e-355.55e-010.2044
10066SCAMP2ATC09HumanThyroidATC3.54e-082.96e-010.2871
10066SCAMP2ATC12HumanThyroidATC6.04e-163.14e-010.34
10066SCAMP2ATC13HumanThyroidATC2.76e-305.87e-010.34
10066SCAMP2ATC1HumanThyroidATC1.09e-083.42e-010.2878
Page: 1 2 3 4 5 6 7 8 9 

check button Transcriptomic changes along malignancy continuum.
TissueExpression DynamicsAbbreviation
Colorectum (GSE201348)The image shows the transcriptomic changes along malignancy continuum.log2FC in expression of this searched gene in stem-like cells from each diseased tissue sample relative to stem-like cells in normal samples in each tissue plotted against the malignancy continuum. Samples are colored based on if they are from different disease stage.
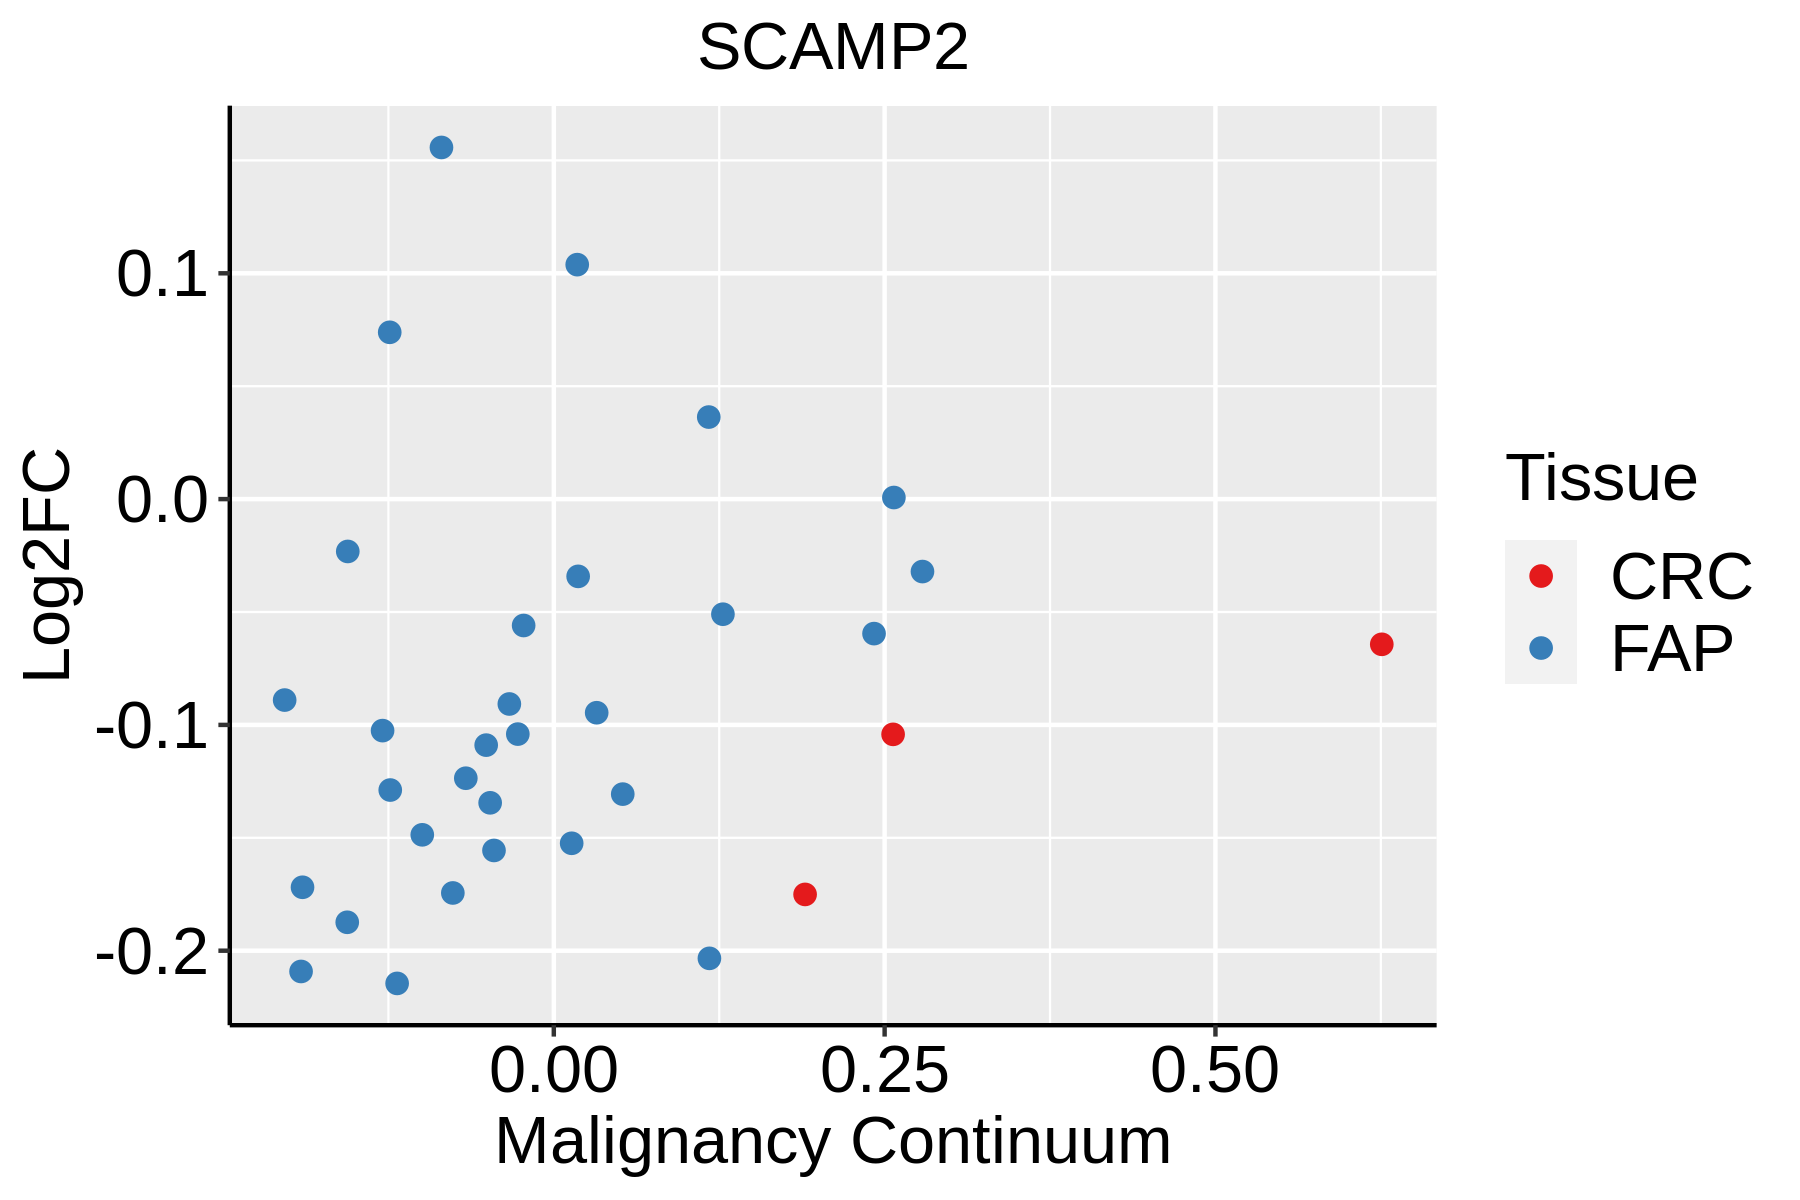
FAP: Familial adenomatous polyposis
CRC: Colorectal cancer
Colorectum (HTA11)The image shows the transcriptomic changes along malignancy continuum.log2FC in expression of this searched gene in stem-like cells from each diseased tissue sample relative to stem-like cells in normal samples in each tissue plotted against the malignancy continuum. Samples are colored based on if they are from different disease stage.AD: Adenomas
SER: Sessile serrated lesions
MSI-H: Microsatellite-high colorectal cancer
MSS: Microsatellite stable colorectal cancer
EsophagusThe image shows the transcriptomic changes along malignancy continuum.log2FC in expression of this searched gene in stem-like cells from each diseased tissue sample relative to stem-like cells in normal samples in each tissue plotted against the malignancy continuum. Samples are colored based on if they are from different disease stage.
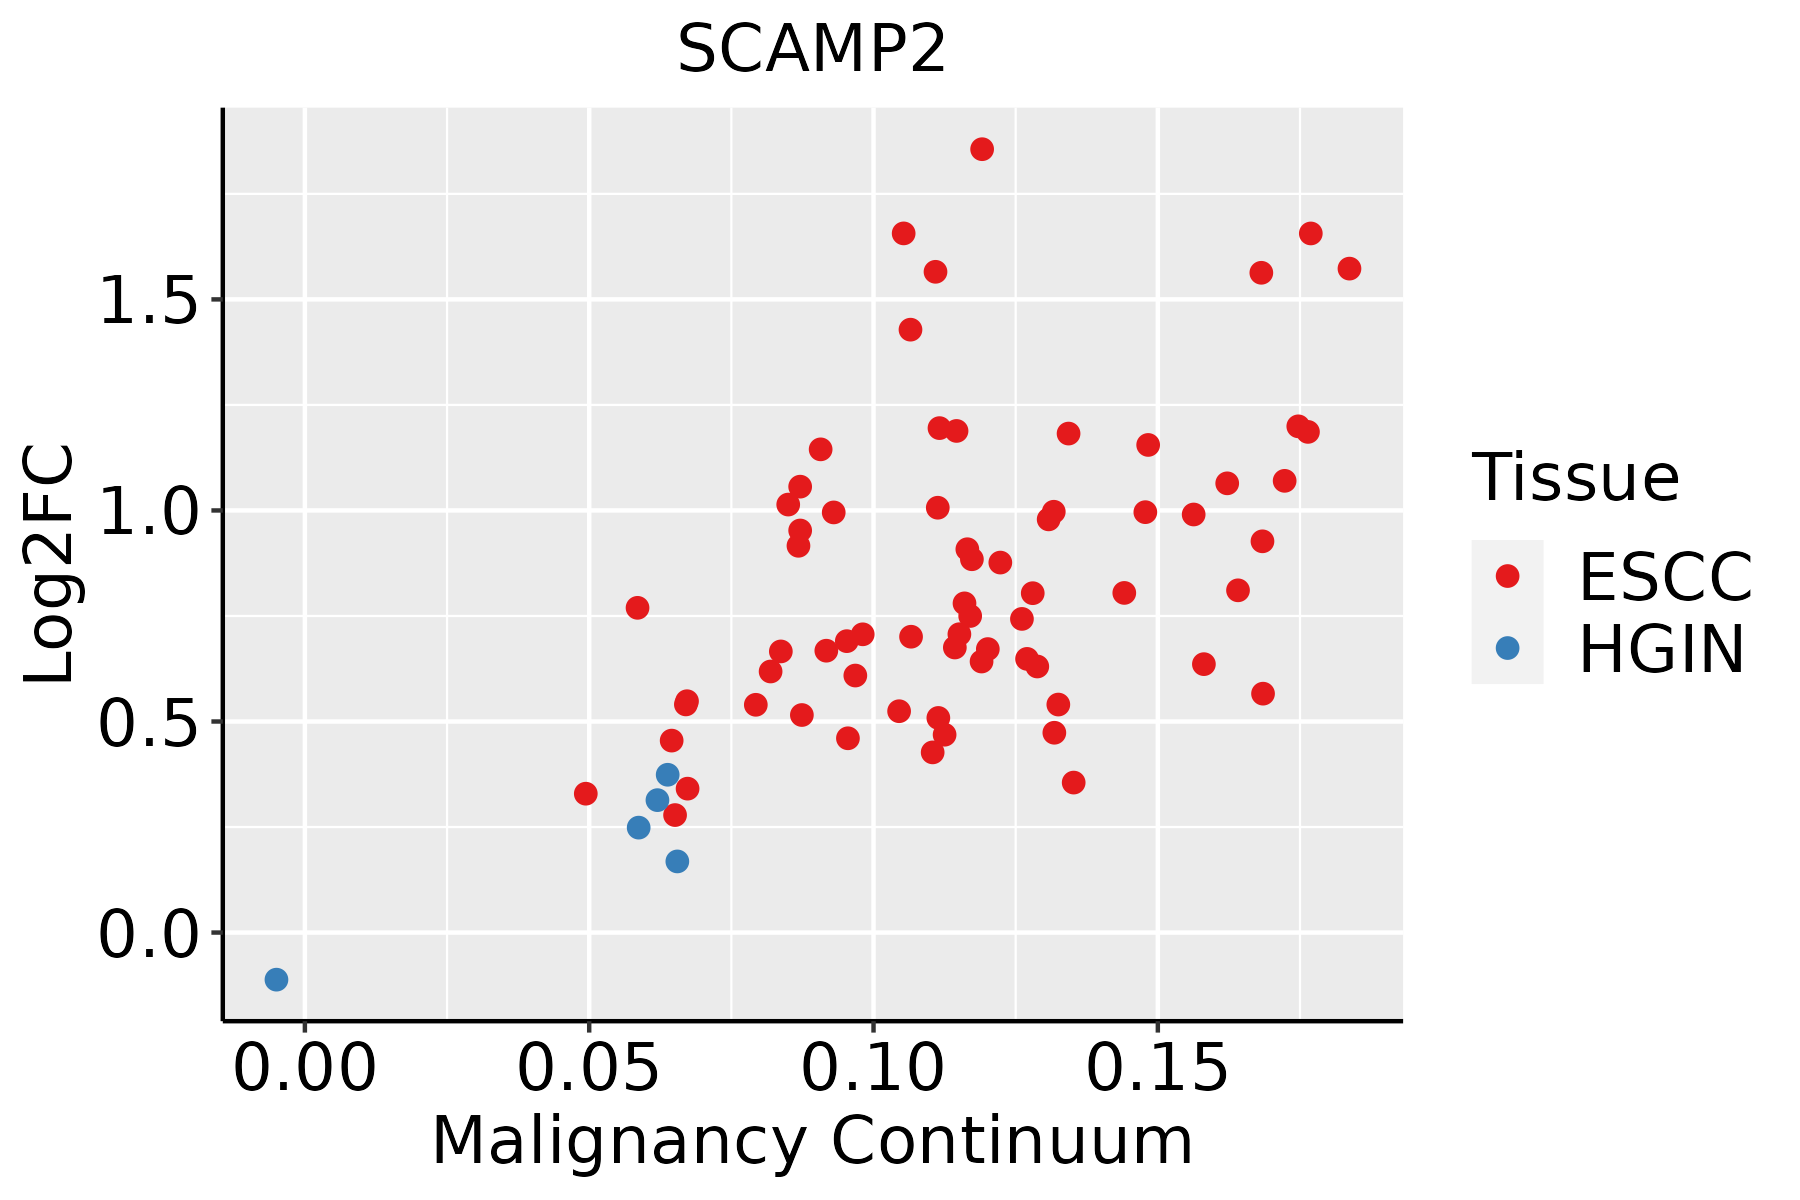
ESCC: Esophageal squamous cell carcinoma
HGIN: High-grade intraepithelial neoplasias
LGIN: Low-grade intraepithelial neoplasias
LiverThe image shows the transcriptomic changes along malignancy continuum.log2FC in expression of this searched gene in stem-like cells from each diseased tissue sample relative to stem-like cells in normal samples in each tissue plotted against the malignancy continuum. Samples are colored based on if they are from different disease stage.
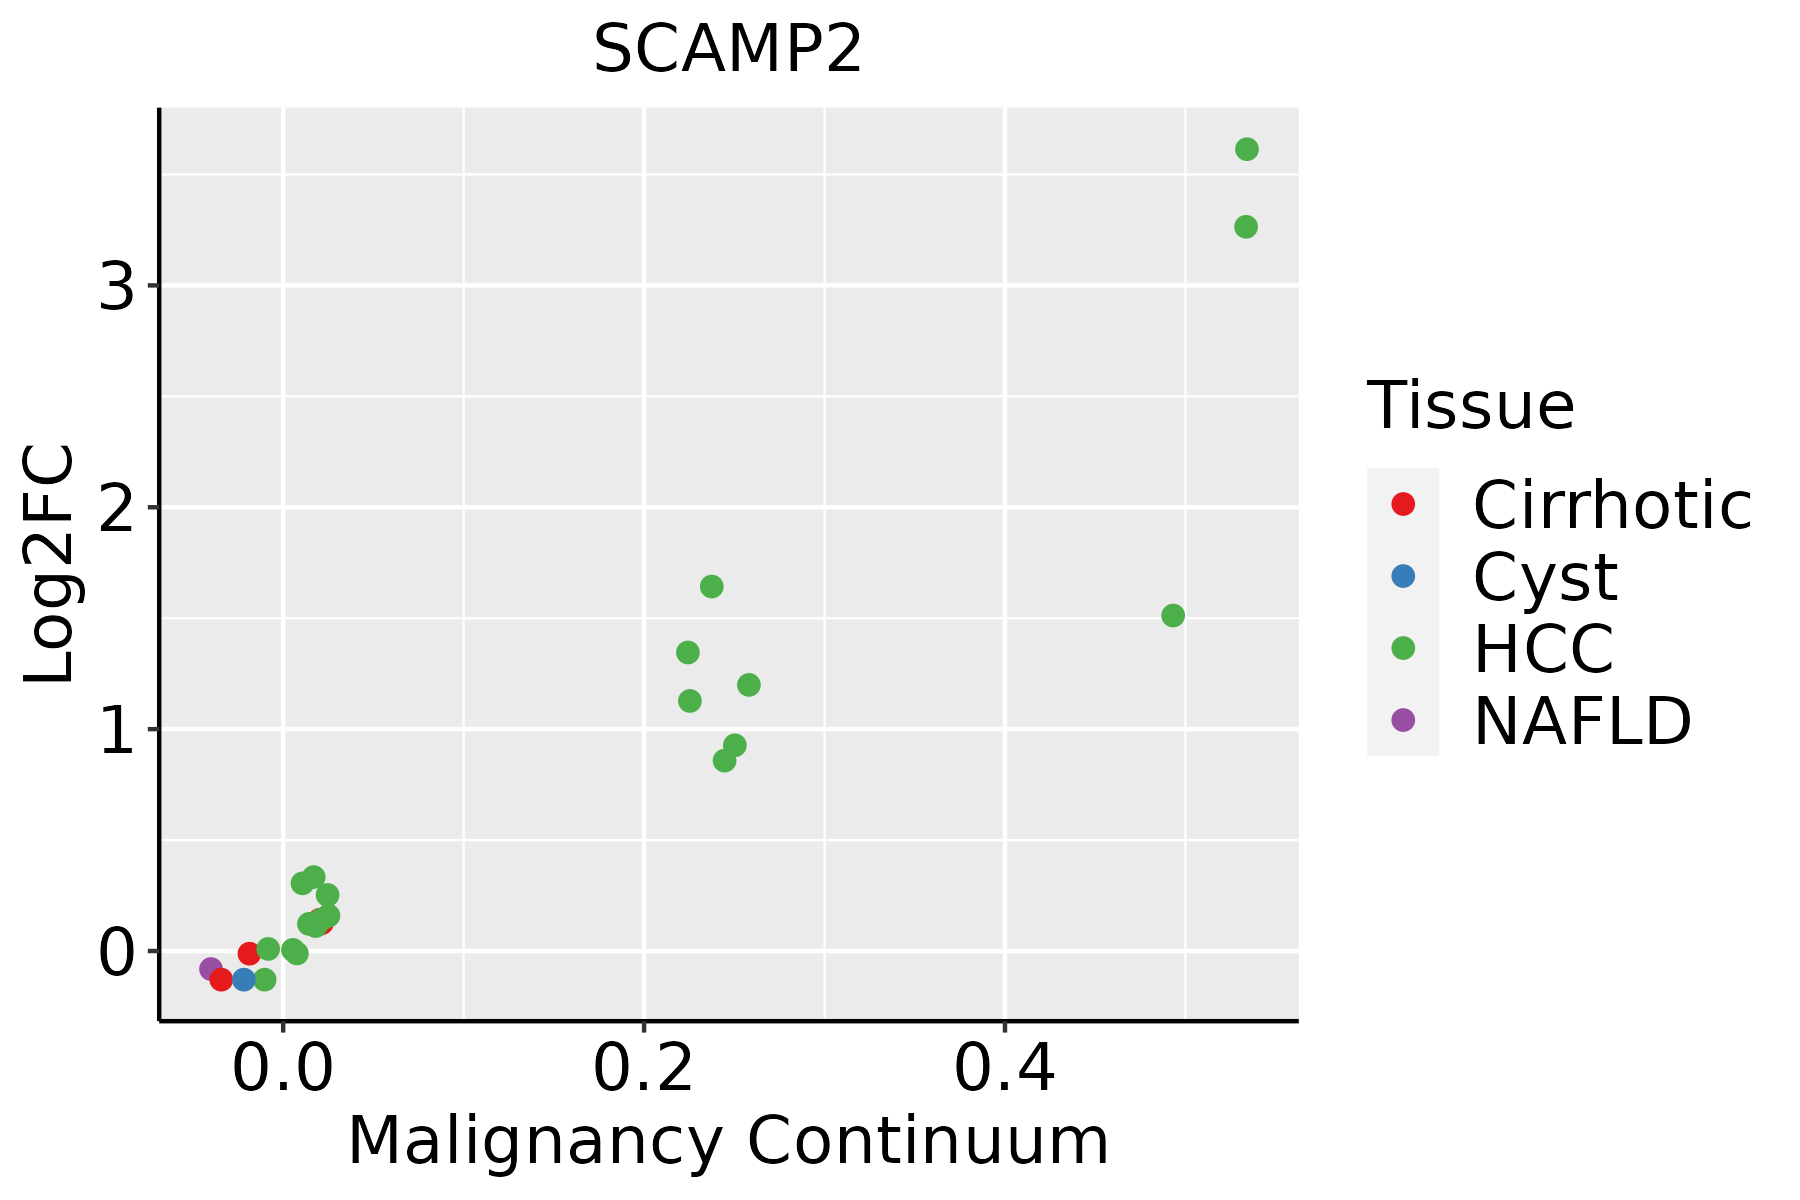
HCC: Hepatocellular carcinoma
NAFLD: Non-alcoholic fatty liver disease
Oral CavityThe image shows the transcriptomic changes along malignancy continuum.log2FC in expression of this searched gene in stem-like cells from each diseased tissue sample relative to stem-like cells in normal samples in each tissue plotted against the malignancy continuum. Samples are colored based on if they are from different disease stage.
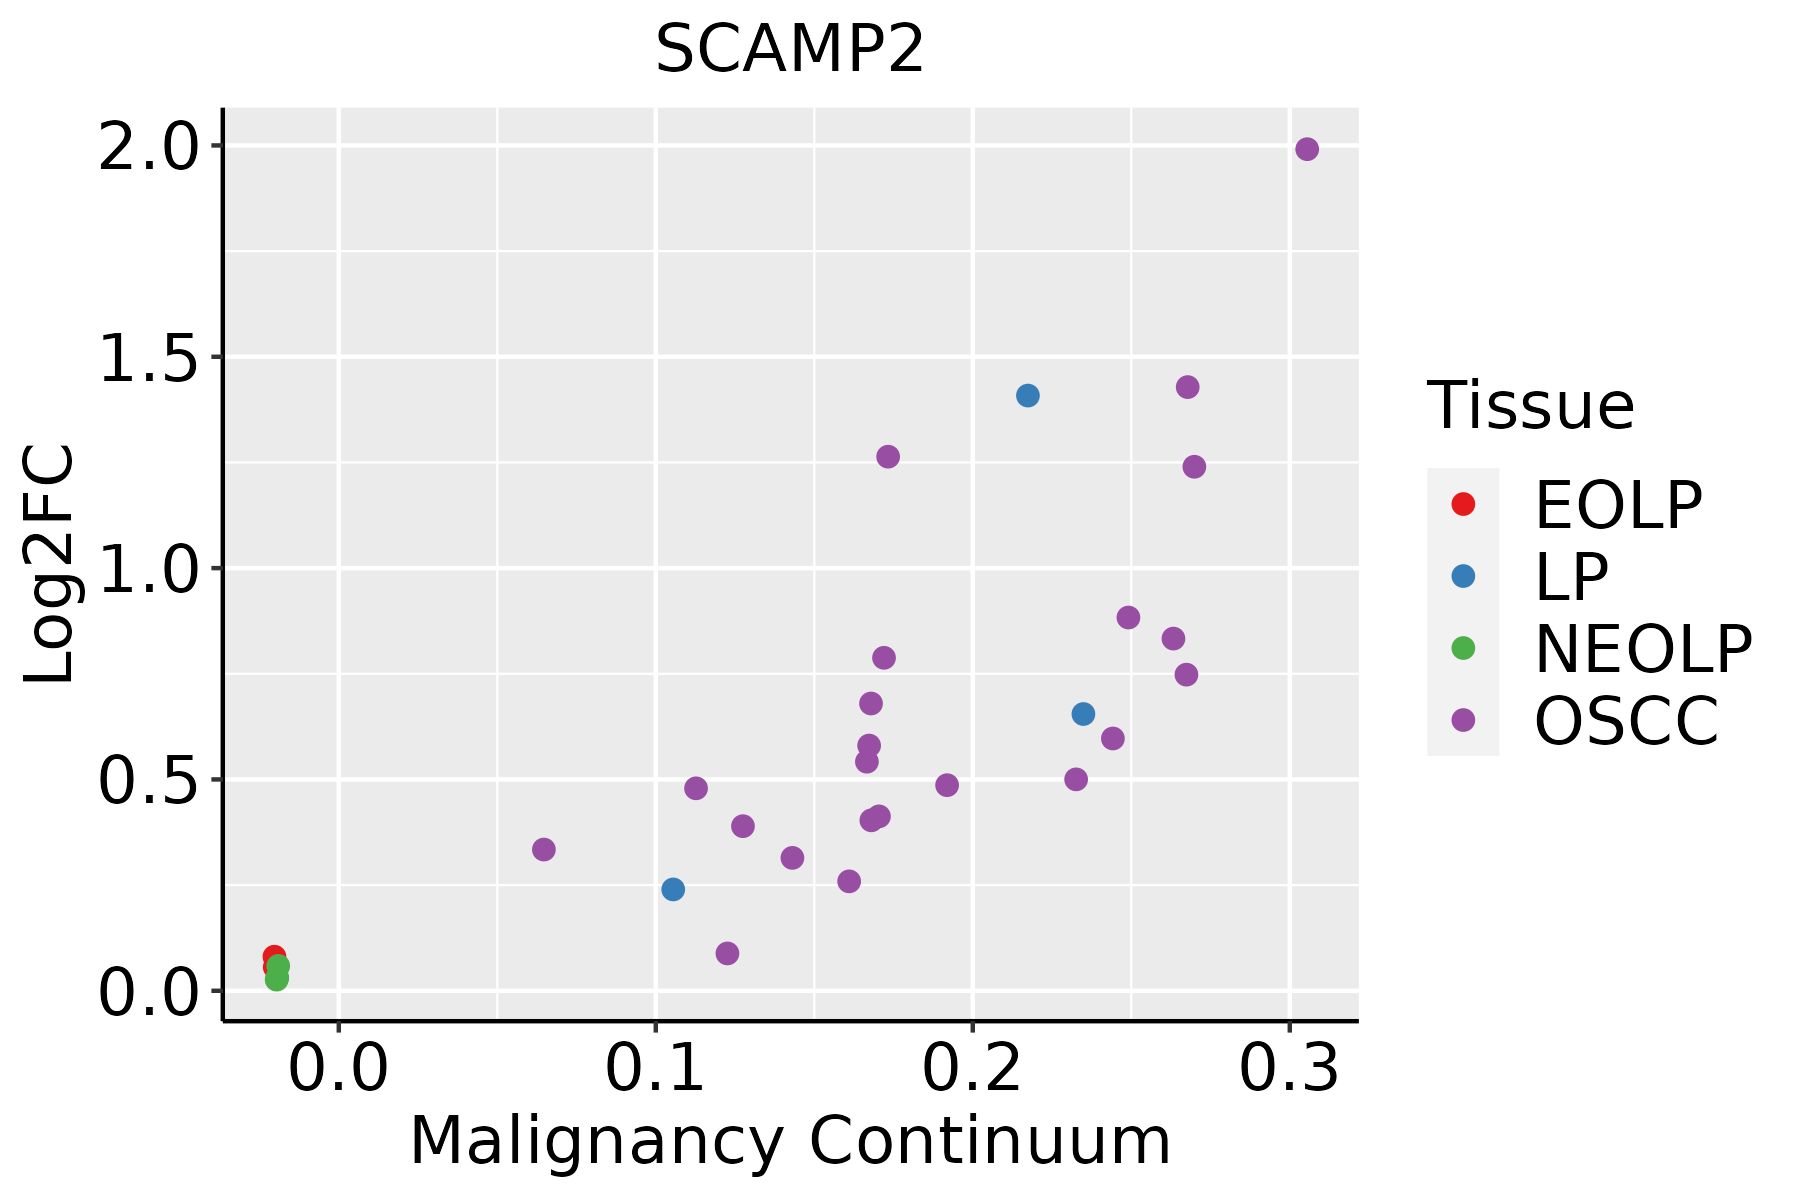
EOLP: Erosive Oral lichen planus
LP: leukoplakia
NEOLP: Non-erosive oral lichen planus
OSCC: Oral squamous cell carcinoma
SkinThe image shows the transcriptomic changes along malignancy continuum.log2FC in expression of this searched gene in stem-like cells from each diseased tissue sample relative to stem-like cells in normal samples in each tissue plotted against the malignancy continuum. Samples are colored based on if they are from different disease stage.AK: Actinic keratosis
cSCC: Cutaneous squamous cell carcinoma
SCCIS:squamous cell carcinoma in situ
ThyroidThe image shows the transcriptomic changes along malignancy continuum.log2FC in expression of this searched gene in stem-like cells from each diseased tissue sample relative to stem-like cells in normal samples in each tissue plotted against the malignancy continuum. Samples are colored based on if they are from different disease stage.ATC: Anaplastic thyroid cancer
HT: Hashimoto's thyroiditis
PTC: Papillary thyroid cancer
∗log2FC in expression of this searched gene in stem-like cells from each diseased tissue sample relative to stem-like cells in normal samples in each tissue plotted against the malignancy continuum. Samples are colored based on if they are from different disease stage.

Top

Malignant transformation related pathway analysis

check buttonFind out the enriched GO biological processes and KEGG pathways involved in transition from healthy to precancer to cancer
check button Figure of enriched GO biological processes.
TissueDisease StageEnriched GO biological Processes
ColorectumADGO analysis - Figure of enriched GO biological processes: Top 15 enriched GO BP terms are showed in the bar plot of each disease state in each tissue. Each row represents a significant GO biological process which is colored according to the -log10(p.adjust).
ColorectumSERGO analysis - Figure of enriched GO biological processes: Top 15 enriched GO BP terms are showed in the bar plot of each disease state in each tissue. Each row represents a significant GO biological process which is colored according to the -log10(p.adjust).
ColorectumMSSGO analysis - Figure of enriched GO biological processes: Top 15 enriched GO BP terms are showed in the bar plot of each disease state in each tissue. Each row represents a significant GO biological process which is colored according to the -log10(p.adjust).
ColorectumMSI-HGO analysis - Figure of enriched GO biological processes: Top 15 enriched GO BP terms are showed in the bar plot of each disease state in each tissue. Each row represents a significant GO biological process which is colored according to the -log10(p.adjust).
ColorectumFAPGO analysis - Figure of enriched GO biological processes: Top 15 enriched GO BP terms are showed in the bar plot of each disease state in each tissue. Each row represents a significant GO biological process which is colored according to the -log10(p.adjust).
∗Top 15 enriched GO BP terms are showed in the bar plot of each disease state in each tissue. Each row represents a significant GO biological process which is colored according to the -log10(p.adjust).
Page: 1 2 3 4 5 6 7 8 9 

check button Enriched GO biological processes.
GO IDTissueDisease StageDescriptionGene RatioBg Ratiopvaluep.adjustCount
GO:0048193ColorectumADGolgi vesicle transport109/3918296/187231.80e-101.68e-08109
GO:0006892ColorectumADpost-Golgi vesicle-mediated transport45/3918104/187232.22e-079.26e-0645
GO:00481931ColorectumSERGolgi vesicle transport79/2897296/187234.20e-072.15e-0579
GO:00068921ColorectumSERpost-Golgi vesicle-mediated transport31/2897104/187231.59e-043.08e-0331
GO:00481932ColorectumMSSGolgi vesicle transport101/3467296/187239.09e-119.77e-09101
GO:00068922ColorectumMSSpost-Golgi vesicle-mediated transport40/3467104/187231.45e-064.82e-0540
GO:00481934ColorectumFAPGolgi vesicle transport77/2622296/187232.86e-082.62e-0677
GO:00068923ColorectumFAPpost-Golgi vesicle-mediated transport36/2622104/187239.23e-086.22e-0636
GO:004819318EsophagusESCCGolgi vesicle transport231/8552296/187231.82e-309.63e-28231
GO:000689215EsophagusESCCpost-Golgi vesicle-mediated transport82/8552104/187234.00e-121.55e-1082
GO:004819311LiverCirrhoticGolgi vesicle transport153/4634296/187231.02e-236.43e-21153
GO:000689211LiverCirrhoticpost-Golgi vesicle-mediated transport51/4634104/187237.12e-082.15e-0651
GO:004819321LiverHCCGolgi vesicle transport217/7958296/187232.58e-271.02e-24217
GO:000689221LiverHCCpost-Golgi vesicle-mediated transport77/7958104/187236.14e-112.24e-0977
GO:004819315Oral cavityOSCCGolgi vesicle transport209/7305296/187231.39e-286.30e-26209
GO:00068929Oral cavityOSCCpost-Golgi vesicle-mediated transport71/7305104/187231.37e-093.33e-0871
GO:004819316Oral cavityLPGolgi vesicle transport141/4623296/187236.11e-181.06e-15141
GO:000689214Oral cavityLPpost-Golgi vesicle-mediated transport44/4623104/187235.90e-058.05e-0444
GO:0048193110SkincSCCGolgi vesicle transport153/4864296/187231.85e-213.41e-19153
GO:000689217SkincSCCpost-Golgi vesicle-mediated transport49/4864104/187232.71e-064.30e-0549
Page: 1 2 

check button Enriched KEGG pathways.
Pathway IDTissueDisease StageDescriptionGene RatioBg Ratiopvaluep.adjustqvalueCount
Page: 1 

Top

Cell-cell communication analysis

check buttonIdentification of potential cell-cell interactions between two cell types and their ligand-receptor pairs for different disease states
LigandReceptorLRpairPathwayTissueDisease Stage
Page: 1 

Top

Single-cell gene regulatory network inference analysis

check buttonFind out the significant the regulons (TFs) and the target genes of each regulon across cell types for different disease states
TFCell TypeTissueDisease StageTarget GeneRSSRegulon Activity
∗The dot plots of a searched regulon are shown for all cell subpopulations in each disease state of each tissue based on the regulon specific score inferred using pySCENIC and by calculating the average expression.
Page: 1 

Top

Somatic mutation of malignant transformation related genes

check buttonAnnotation of somatic variants for genes involved in malignant transformation
Hugo SymbolVariant ClassVariant ClassificationdbSNP RSHGVScHGVSpHGVSp ShortSWISSPROTBIOTYPESIFTPolyPhenTumor Sample BarcodeTissueHistologySexAgeStageTherapy TypesDrugsOutcome
SCAMP2SNVMissense_Mutationnovelc.89C>Ap.Pro30Glnp.P30QO15127protein_codingtolerated(0.57)benign(0.003)TCGA-A7-A0DB-01Breastbreast invasive carcinomaFemale<65I/IIHormone TherapyarimidexSD
SCAMP2SNVMissense_Mutationc.160C>Tp.Leu54Phep.L54FO15127protein_codingtolerated(0.7)benign(0.031)TCGA-BH-A0B9-01Breastbreast invasive carcinomaFemale<65I/IIChemotherapycyclophosphamideSD
SCAMP2SNVMissense_Mutationnovelc.177G>Tp.Gln59Hisp.Q59HO15127protein_codingdeleterious(0.02)benign(0.043)TCGA-EA-A410-01Cervixcervical & endocervical cancerFemale<65I/IIUnknownUnknownSD
SCAMP2SNVMissense_Mutationc.836N>Tp.Ser279Leup.S279LO15127protein_codingdeleterious(0.01)benign(0.1)TCGA-MU-A51Y-01Cervixcervical & endocervical cancerFemale<65I/IIUnknownUnknownSD
SCAMP2SNVMissense_Mutationnovelc.335N>Gp.Asn112Serp.N112SO15127protein_codingtolerated(1)benign(0)TCGA-F5-6814-01Colorectumrectum adenocarcinomaMale<65I/IIUnknownUnknownSD
SCAMP2SNVMissense_Mutationnovelc.560N>Tp.Ser187Phep.S187FO15127protein_codingdeleterious(0.02)probably_damaging(0.989)TCGA-A5-A0G1-01Endometriumuterine corpus endometrioid carcinomaFemale>=65I/IIUnknownUnknownSD
SCAMP2SNVMissense_Mutationnovelc.572N>Ap.Phe191Tyrp.F191YO15127protein_codingdeleterious(0.01)benign(0.319)TCGA-A5-A0G2-01Endometriumuterine corpus endometrioid carcinomaFemale<65III/IVUnknownUnknownSD
SCAMP2SNVMissense_Mutationrs746545894c.440N>Ap.Arg147Glnp.R147QO15127protein_codingdeleterious(0.02)possibly_damaging(0.487)TCGA-A5-A0G2-01Endometriumuterine corpus endometrioid carcinomaFemale<65III/IVUnknownUnknownSD
SCAMP2SNVMissense_Mutationnovelc.560N>Tp.Ser187Phep.S187FO15127protein_codingdeleterious(0.02)probably_damaging(0.989)TCGA-A5-A0GG-01Endometriumuterine corpus endometrioid carcinomaFemale>=65I/IIUnknownUnknownSD
SCAMP2SNVMissense_Mutationnovelc.861N>Ap.His287Glnp.H287QO15127protein_codingdeleterious(0)probably_damaging(0.993)TCGA-AX-A2HD-01Endometriumuterine corpus endometrioid carcinomaFemale>=65III/IVUnknownUnknownSD
Page: 1 2 3 

Top

Related drugs of malignant transformation related genes

check buttonIdentification of chemicals and drugs interact with genes involved in malignant transfromation
(DGIdb 4.0)
Entrez IDSymbolCategoryInteraction TypesDrug Claim NameDrug NamePMIDs
Page: 1