
|
|||||
|
 | |
| |
| |
| |
| |
| |
|
Gene: RAB5C |
Gene summary for RAB5C |
| Gene information | Species | Human | Gene symbol | RAB5C | Gene ID | 5878 |
| Gene name | RAB5C, member RAS oncogene family | |
| Gene Alias | L1880 | |
| Cytomap | 17q21.2 | |
| Gene Type | protein-coding | GO ID | GO:0006810 | UniProtAcc | P51148 |
Top |
Malignant transformation analysis |
| Identification of the aberrant gene expression in precancerous and cancerous lesions by comparing the gene expression of stem-like cells in diseased tissues with normal stem cells |
| Entrez ID | Symbol | Replicates | Species | Organ | Tissue | Adj P-value | Log2FC | Malignancy |
| 5878 | RAB5C | C21 | Human | Oral cavity | OSCC | 8.82e-81 | 2.93e+00 | 0.2678 |
| 5878 | RAB5C | C30 | Human | Oral cavity | OSCC | 2.39e-58 | 3.85e+00 | 0.3055 |
| 5878 | RAB5C | C38 | Human | Oral cavity | OSCC | 1.19e-22 | 2.29e+00 | 0.172 |
| 5878 | RAB5C | C43 | Human | Oral cavity | OSCC | 1.15e-84 | 1.51e+00 | 0.1704 |
| 5878 | RAB5C | C46 | Human | Oral cavity | OSCC | 3.84e-62 | 1.31e+00 | 0.1673 |
| 5878 | RAB5C | C51 | Human | Oral cavity | OSCC | 1.78e-27 | 1.39e+00 | 0.2674 |
| 5878 | RAB5C | C57 | Human | Oral cavity | OSCC | 1.70e-48 | 1.48e+00 | 0.1679 |
| 5878 | RAB5C | C06 | Human | Oral cavity | OSCC | 2.43e-15 | 2.36e+00 | 0.2699 |
| 5878 | RAB5C | C07 | Human | Oral cavity | OSCC | 1.09e-07 | 1.64e+00 | 0.2491 |
| 5878 | RAB5C | C08 | Human | Oral cavity | OSCC | 1.48e-93 | 1.86e+00 | 0.1919 |
| 5878 | RAB5C | C09 | Human | Oral cavity | OSCC | 2.01e-26 | 7.83e-01 | 0.1431 |
| 5878 | RAB5C | LN22 | Human | Oral cavity | OSCC | 6.09e-16 | 1.87e+00 | 0.1733 |
| 5878 | RAB5C | LN38 | Human | Oral cavity | OSCC | 7.88e-13 | 2.07e+00 | 0.168 |
| 5878 | RAB5C | LN46 | Human | Oral cavity | OSCC | 3.03e-44 | 1.61e+00 | 0.1666 |
| 5878 | RAB5C | LP15 | Human | Oral cavity | LP | 1.61e-14 | 2.29e+00 | 0.2174 |
| 5878 | RAB5C | LP17 | Human | Oral cavity | LP | 1.69e-15 | 1.72e+00 | 0.2349 |
| 5878 | RAB5C | SYSMH1 | Human | Oral cavity | OSCC | 4.63e-36 | 7.92e-01 | 0.1127 |
| 5878 | RAB5C | SYSMH2 | Human | Oral cavity | OSCC | 2.92e-29 | 1.23e+00 | 0.2326 |
| 5878 | RAB5C | SYSMH3 | Human | Oral cavity | OSCC | 3.58e-39 | 1.38e+00 | 0.2442 |
| 5878 | RAB5C | SYSMH4 | Human | Oral cavity | OSCC | 2.84e-03 | 1.33e-01 | 0.1226 |
| Page: 1 2 3 4 5 6 7 8 9 10 |
| Tissue | Expression Dynamics | Abbreviation |
| Colorectum (GSE201348) |  | FAP: Familial adenomatous polyposis |
| CRC: Colorectal cancer | ||
| Colorectum (HTA11) |  | AD: Adenomas |
| SER: Sessile serrated lesions | ||
| MSI-H: Microsatellite-high colorectal cancer | ||
| MSS: Microsatellite stable colorectal cancer | ||
| Endometrium | 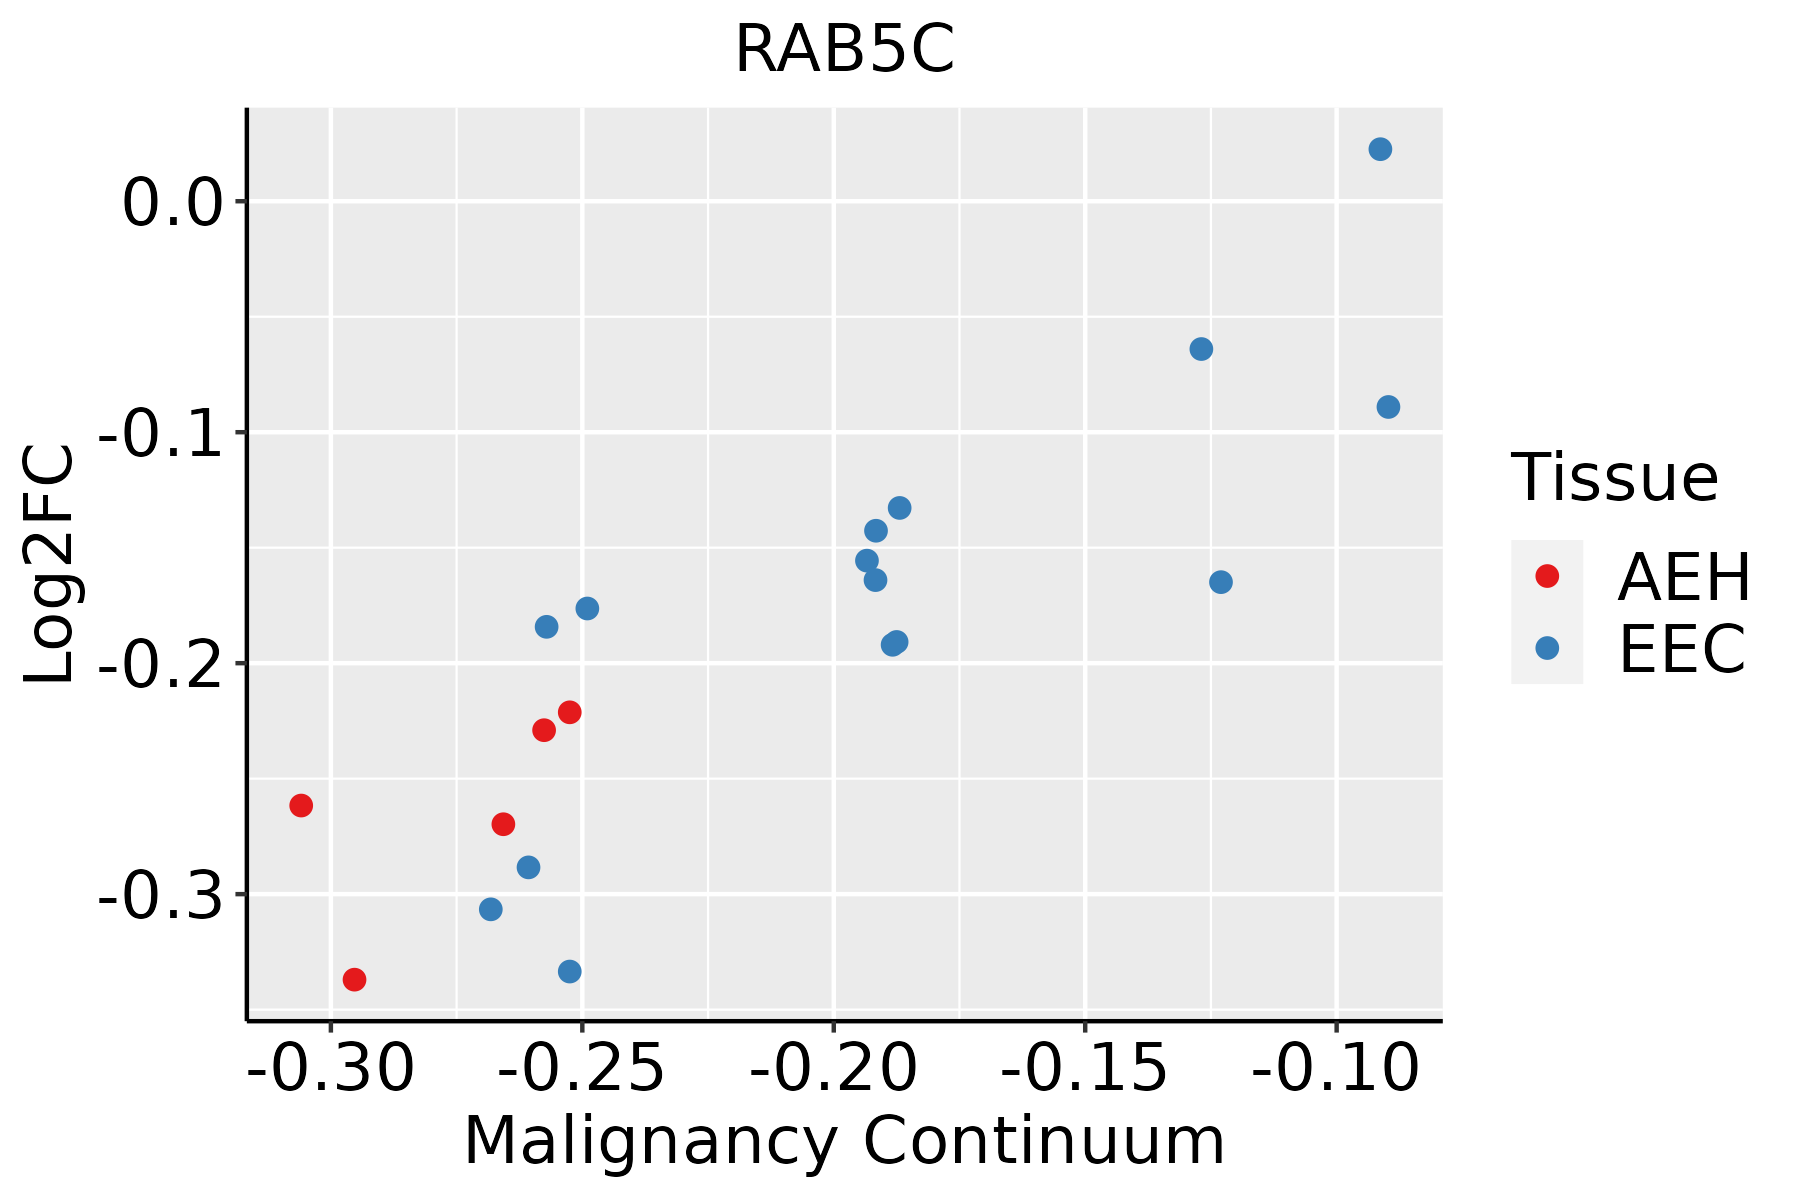 | AEH: Atypical endometrial hyperplasia |
| EEC: Endometrioid Cancer | ||
| Esophagus | 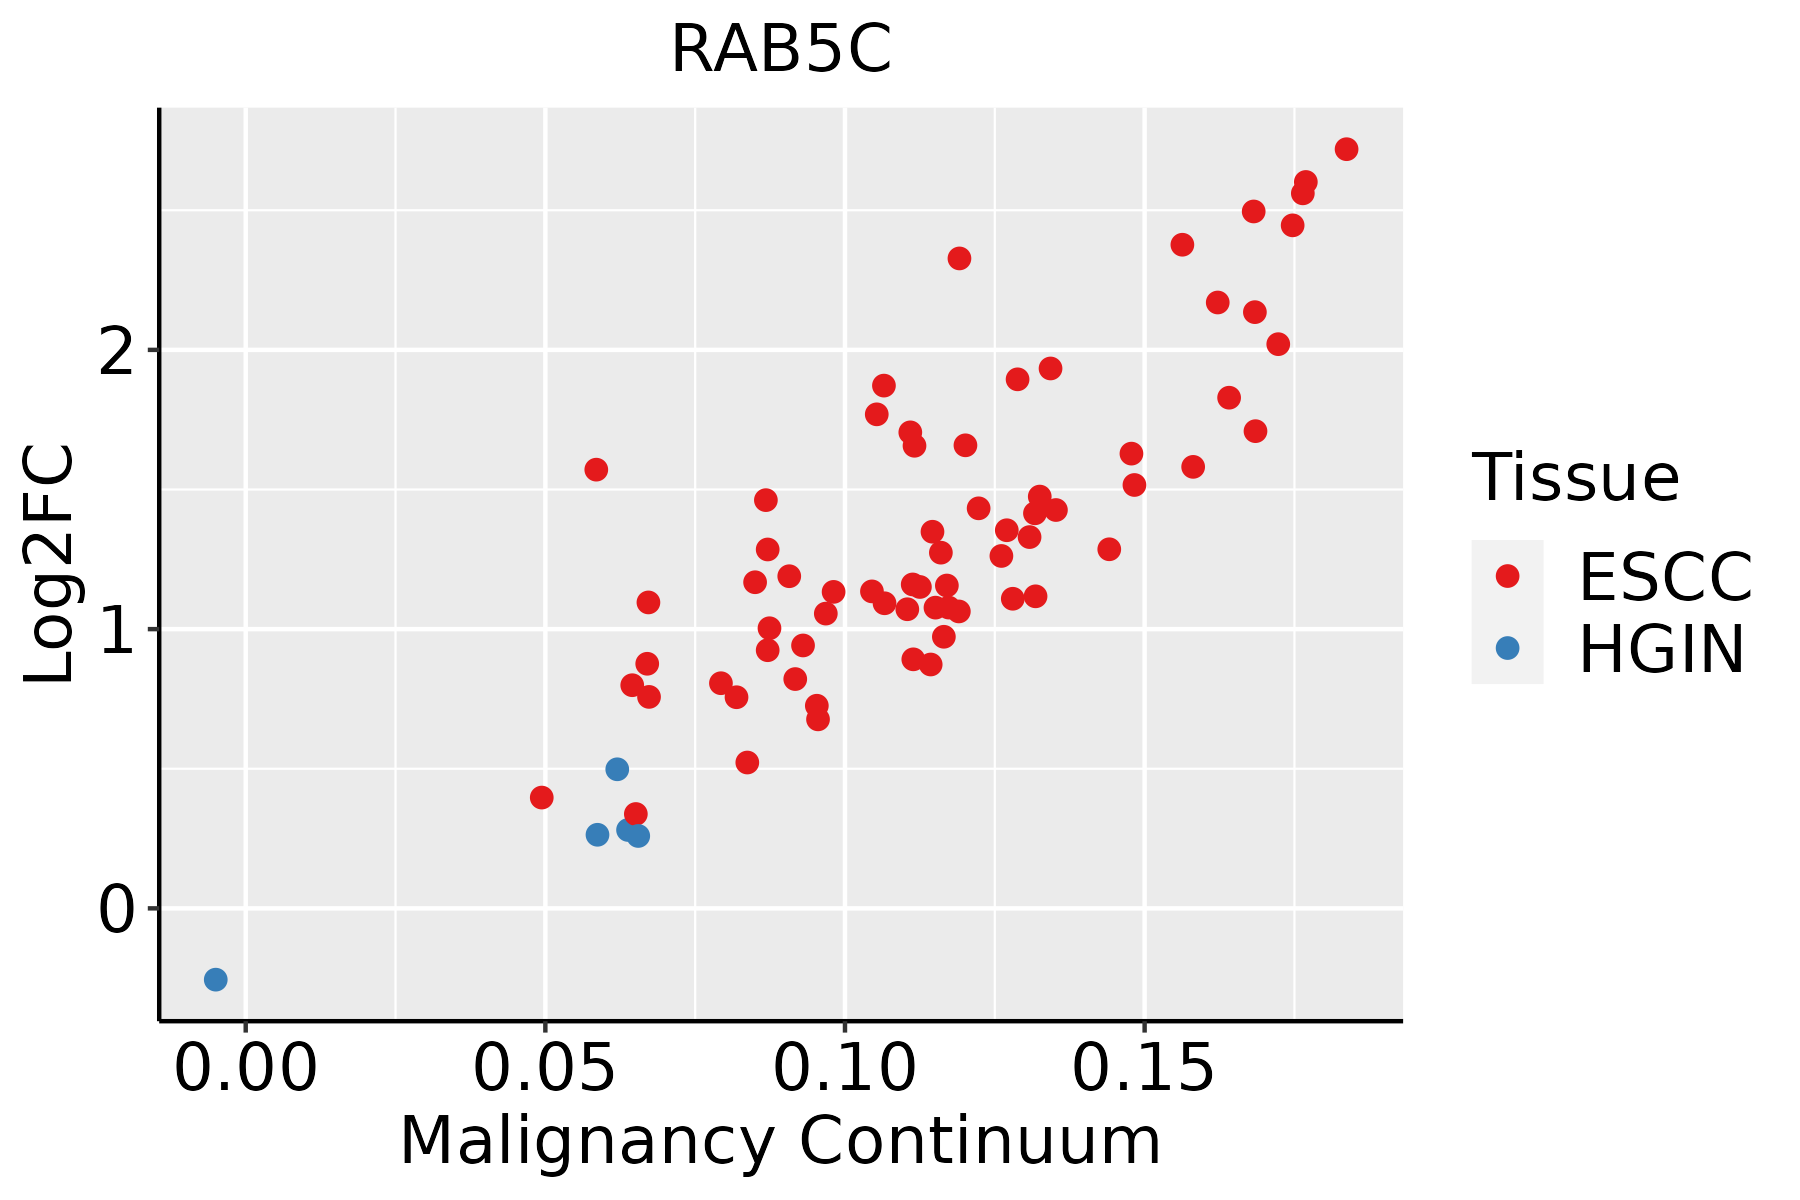 | ESCC: Esophageal squamous cell carcinoma |
| HGIN: High-grade intraepithelial neoplasias | ||
| LGIN: Low-grade intraepithelial neoplasias | ||
| Liver | 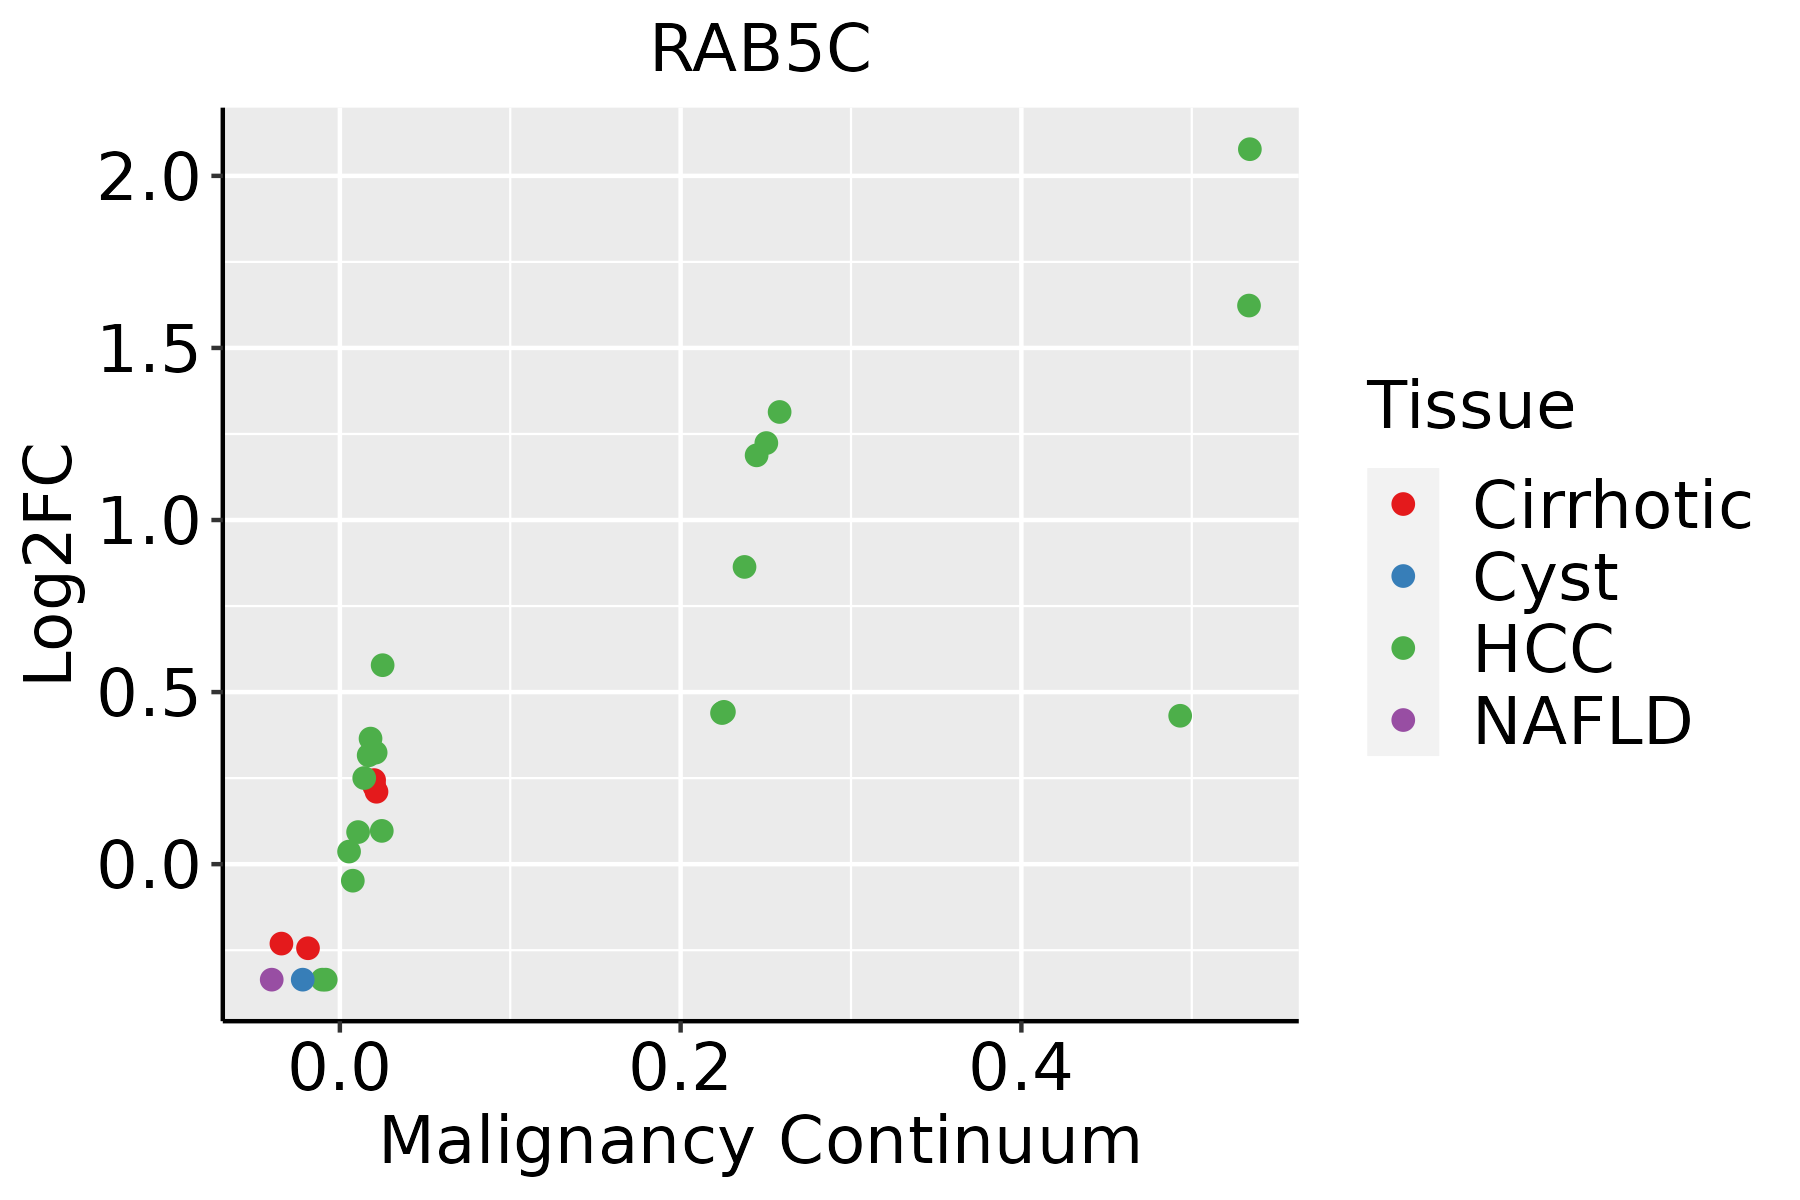 | HCC: Hepatocellular carcinoma |
| NAFLD: Non-alcoholic fatty liver disease | ||
| Oral Cavity | 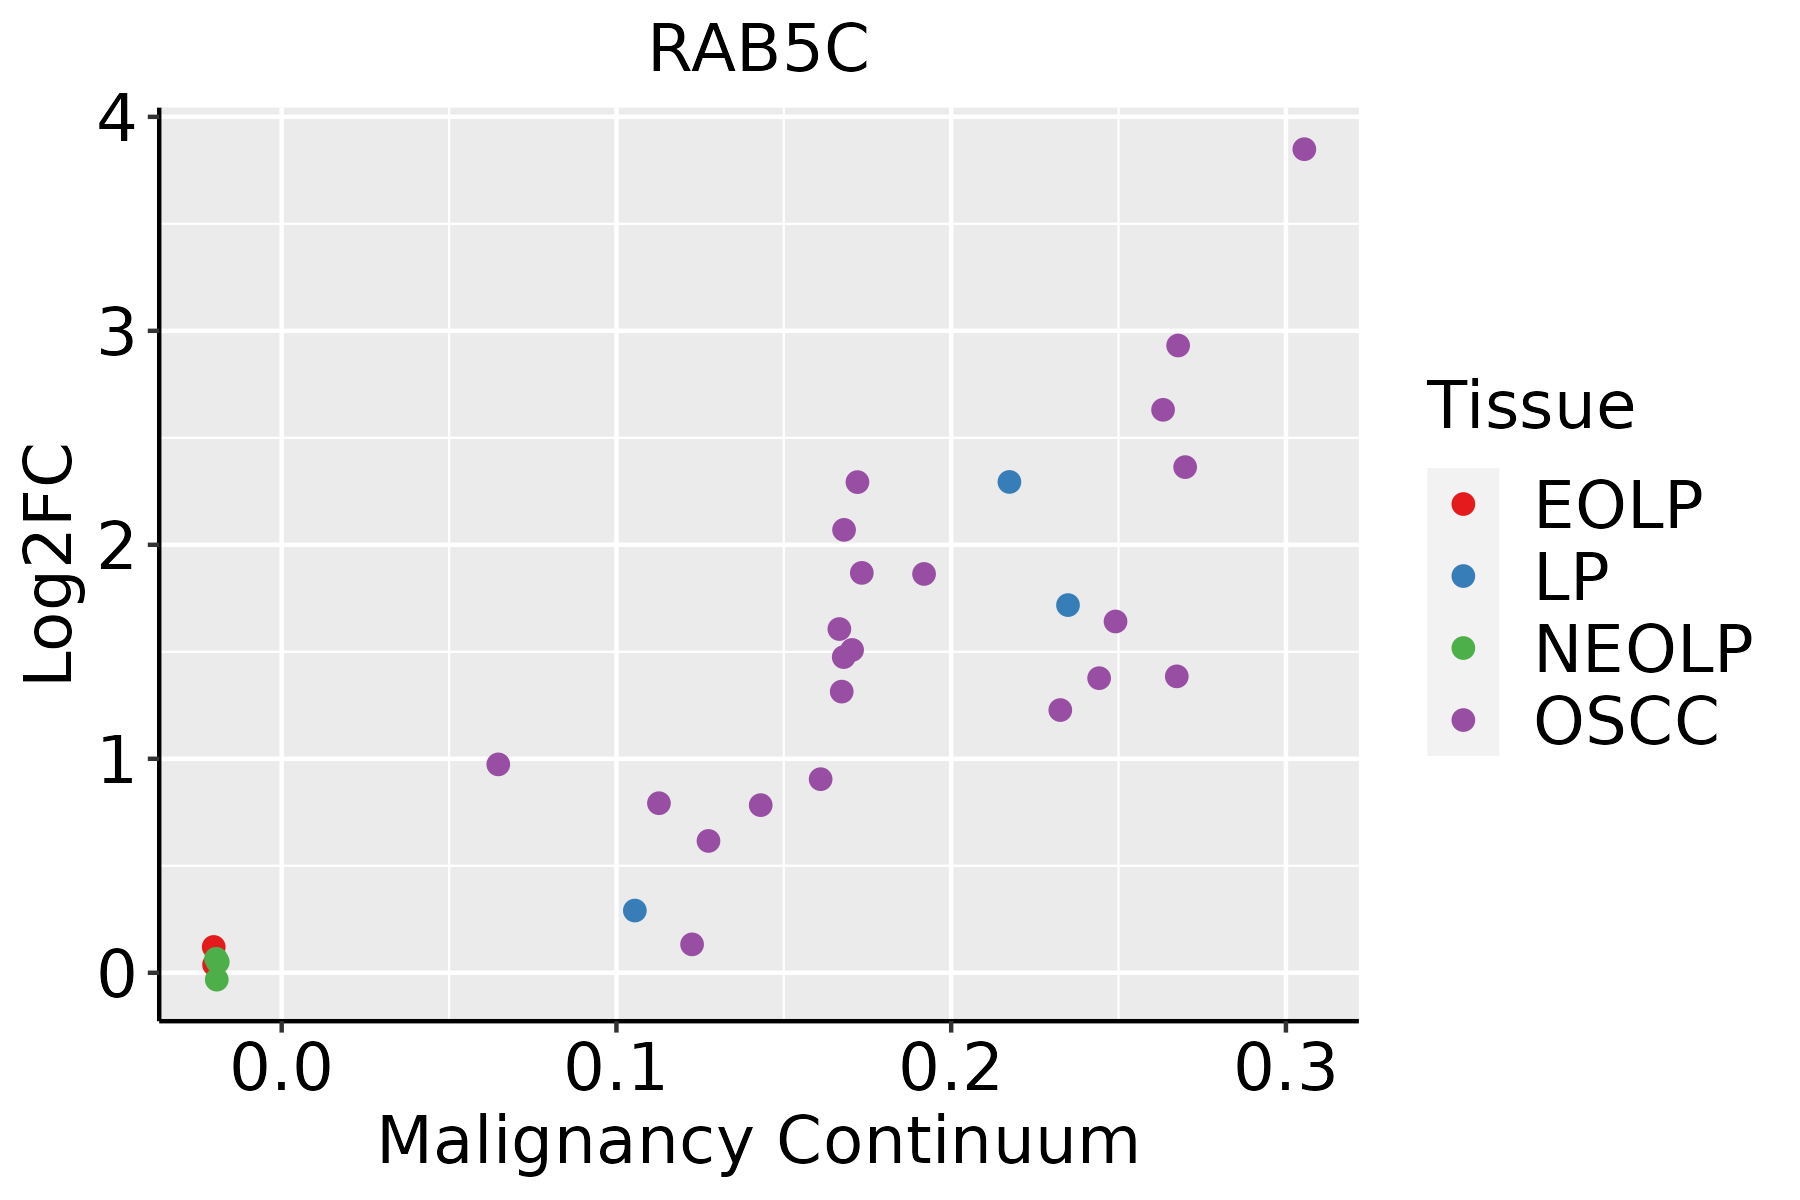 | EOLP: Erosive Oral lichen planus |
| LP: leukoplakia | ||
| NEOLP: Non-erosive oral lichen planus | ||
| OSCC: Oral squamous cell carcinoma | ||
| Skin | 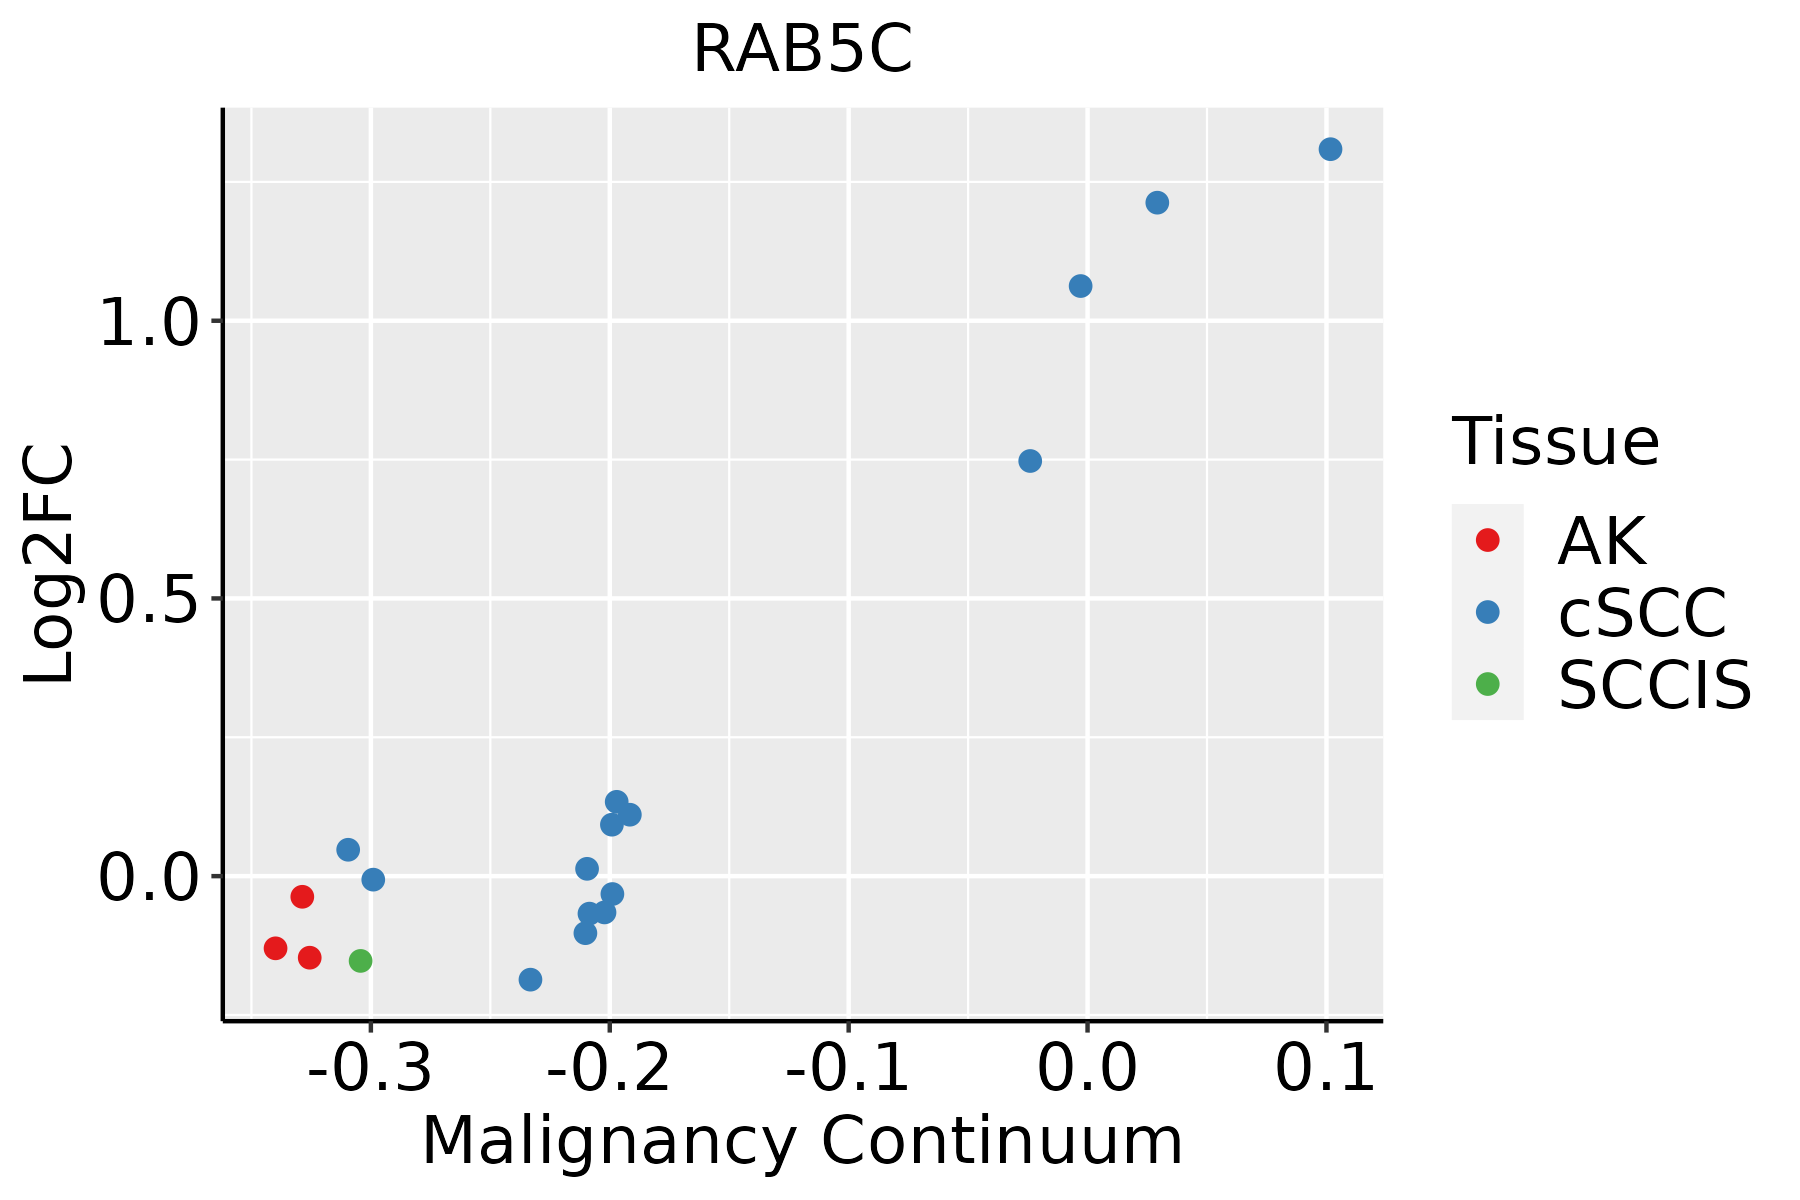 | AK: Actinic keratosis |
| cSCC: Cutaneous squamous cell carcinoma | ||
| SCCIS:squamous cell carcinoma in situ | ||
| Thyroid | 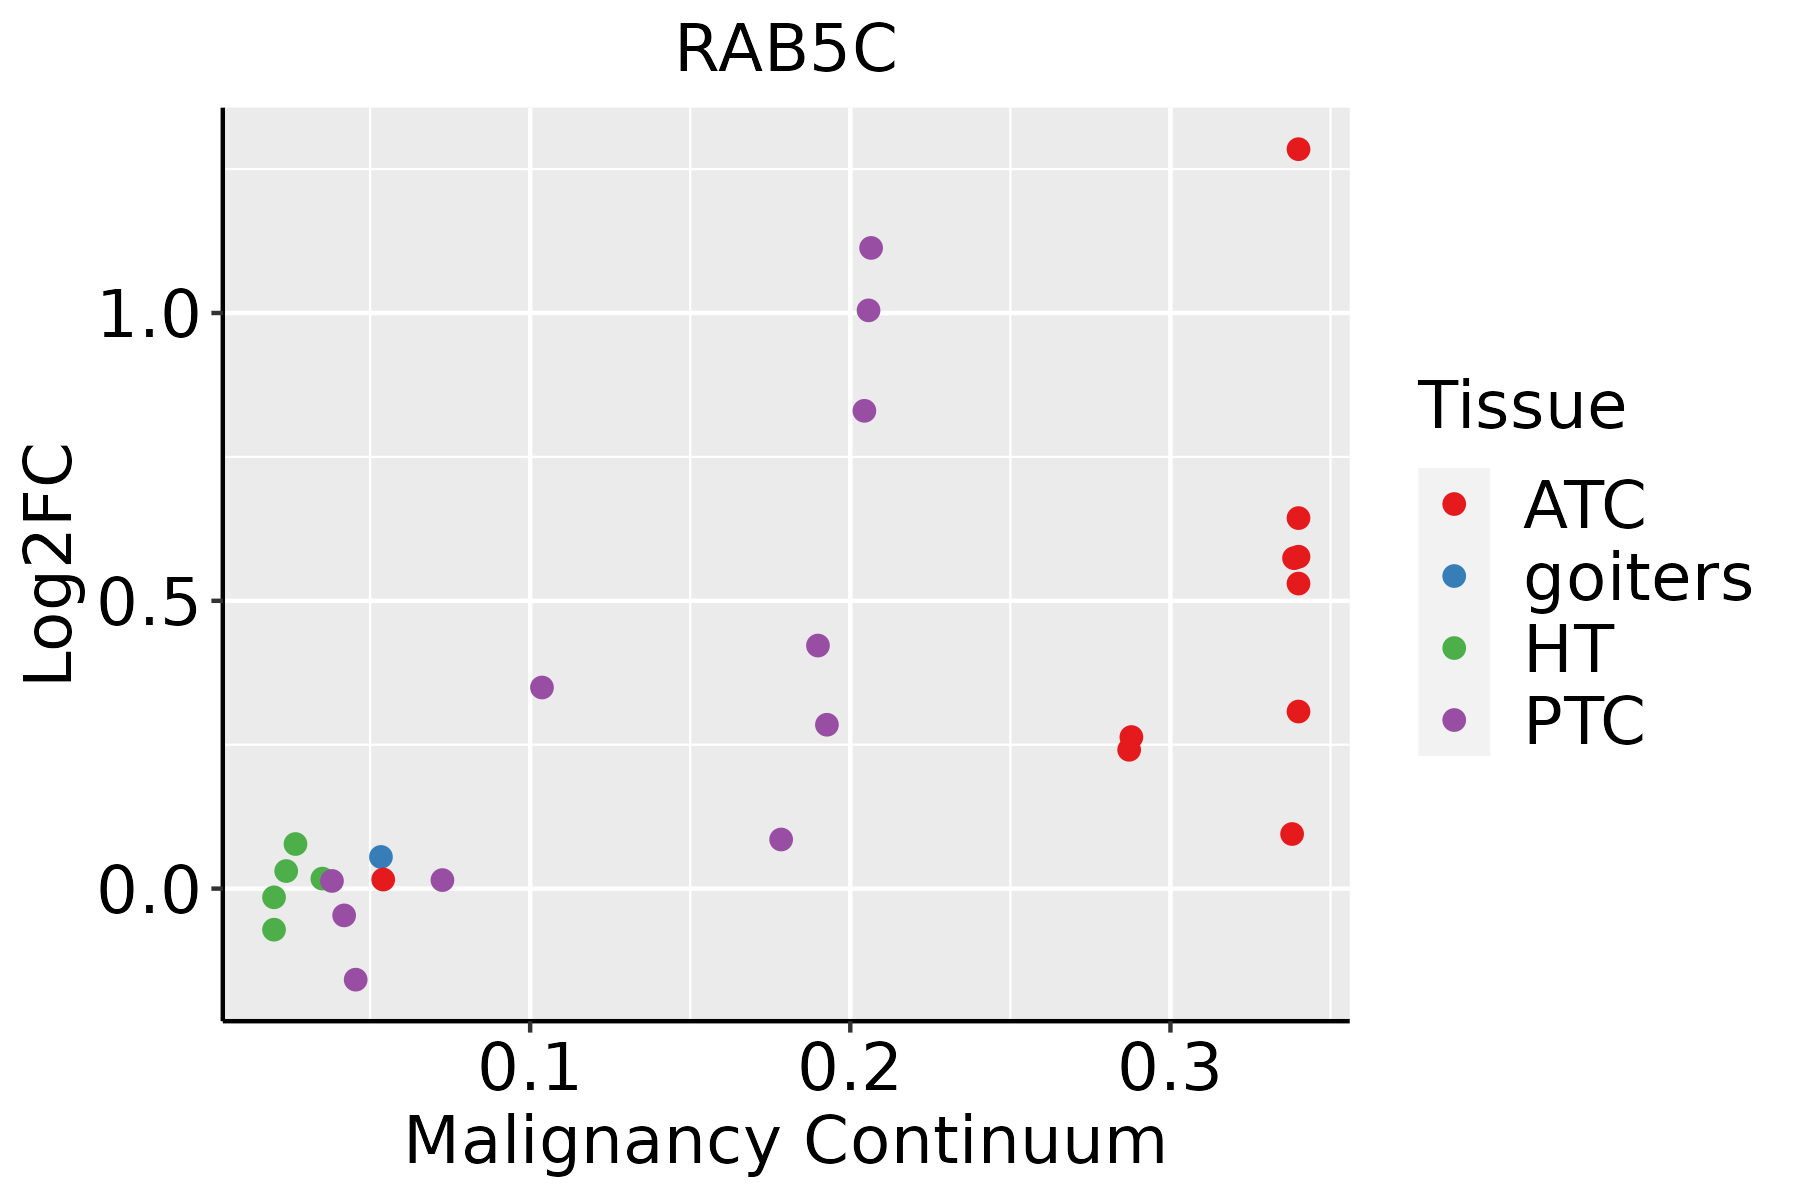 | ATC: Anaplastic thyroid cancer |
| HT: Hashimoto's thyroiditis | ||
| PTC: Papillary thyroid cancer |
| ∗log2FC in expression of this searched gene in stem-like cells from each diseased tissue sample relative to stem-like cells in normal samples in each tissue plotted against the malignancy continuum. Samples are colored based on if they are from different disease stage. |
Top |
Malignant transformation related pathway analysis |
| Find out the enriched GO biological processes and KEGG pathways involved in transition from healthy to precancer to cancer |
| Tissue | Disease Stage | Enriched GO biological Processes |
| Colorectum | AD |  |
| Colorectum | SER |  |
| Colorectum | MSS |  |
| Colorectum | MSI-H |  |
| Colorectum | FAP |  |
| ∗Top 15 enriched GO BP terms are showed in the bar plot of each disease state in each tissue. Each row represents a significant GO biological process which is colored according to the -log10(p.adjust). |
| Page: 1 2 3 4 5 6 7 8 9 |
| GO ID | Tissue | Disease Stage | Description | Gene Ratio | Bg Ratio | pvalue | p.adjust | Count |
| GO:0030100 | Colorectum | AD | regulation of endocytosis | 67/3918 | 211/18723 | 1.42e-04 | 2.01e-03 | 67 |
| GO:00301001 | Colorectum | SER | regulation of endocytosis | 48/2897 | 211/18723 | 3.29e-03 | 2.82e-02 | 48 |
| GO:00301002 | Colorectum | MSS | regulation of endocytosis | 63/3467 | 211/18723 | 4.05e-05 | 7.66e-04 | 63 |
| GO:00301009 | Endometrium | AEH | regulation of endocytosis | 44/2100 | 211/18723 | 3.39e-05 | 6.05e-04 | 44 |
| GO:003010014 | Endometrium | EEC | regulation of endocytosis | 45/2168 | 211/18723 | 3.40e-05 | 5.78e-04 | 45 |
| GO:003010018 | Esophagus | ESCC | regulation of endocytosis | 135/8552 | 211/18723 | 5.75e-08 | 1.02e-06 | 135 |
| GO:003010011 | Liver | Cirrhotic | regulation of endocytosis | 74/4634 | 211/18723 | 4.86e-04 | 3.90e-03 | 74 |
| GO:003010021 | Liver | HCC | regulation of endocytosis | 117/7958 | 211/18723 | 9.56e-05 | 8.32e-04 | 117 |
| GO:003010016 | Oral cavity | OSCC | regulation of endocytosis | 121/7305 | 211/18723 | 4.74e-08 | 8.80e-07 | 121 |
| GO:003010017 | Oral cavity | LP | regulation of endocytosis | 81/4623 | 211/18723 | 6.57e-06 | 1.29e-04 | 81 |
| GO:003010019 | Skin | AK | regulation of endocytosis | 36/1910 | 211/18723 | 1.42e-03 | 1.05e-02 | 36 |
| GO:003010024 | Skin | cSCC | regulation of endocytosis | 72/4864 | 211/18723 | 5.06e-03 | 2.56e-02 | 72 |
| GO:003010020 | Thyroid | PTC | regulation of endocytosis | 108/5968 | 211/18723 | 3.92e-09 | 1.04e-07 | 108 |
| GO:0030100111 | Thyroid | ATC | regulation of endocytosis | 113/6293 | 211/18723 | 1.71e-09 | 4.22e-08 | 113 |
| Page: 1 |
| Pathway ID | Tissue | Disease Stage | Description | Gene Ratio | Bg Ratio | pvalue | p.adjust | qvalue | Count |
| hsa04144 | Colorectum | AD | Endocytosis | 111/2092 | 251/8465 | 5.95e-12 | 1.42e-10 | 9.08e-11 | 111 |
| hsa05132 | Colorectum | AD | Salmonella infection | 102/2092 | 249/8465 | 7.65e-09 | 1.28e-07 | 8.17e-08 | 102 |
| hsa04962 | Colorectum | AD | Vasopressin-regulated water reabsorption | 19/2092 | 44/8465 | 5.48e-03 | 2.48e-02 | 1.58e-02 | 19 |
| hsa041441 | Colorectum | AD | Endocytosis | 111/2092 | 251/8465 | 5.95e-12 | 1.42e-10 | 9.08e-11 | 111 |
| hsa051321 | Colorectum | AD | Salmonella infection | 102/2092 | 249/8465 | 7.65e-09 | 1.28e-07 | 8.17e-08 | 102 |
| hsa049621 | Colorectum | AD | Vasopressin-regulated water reabsorption | 19/2092 | 44/8465 | 5.48e-03 | 2.48e-02 | 1.58e-02 | 19 |
| hsa041442 | Colorectum | SER | Endocytosis | 81/1580 | 251/8465 | 1.14e-07 | 2.36e-06 | 1.71e-06 | 81 |
| hsa051322 | Colorectum | SER | Salmonella infection | 77/1580 | 249/8465 | 1.56e-06 | 2.35e-05 | 1.71e-05 | 77 |
| hsa041443 | Colorectum | SER | Endocytosis | 81/1580 | 251/8465 | 1.14e-07 | 2.36e-06 | 1.71e-06 | 81 |
| hsa051323 | Colorectum | SER | Salmonella infection | 77/1580 | 249/8465 | 1.56e-06 | 2.35e-05 | 1.71e-05 | 77 |
| hsa041444 | Colorectum | MSS | Endocytosis | 102/1875 | 251/8465 | 1.85e-11 | 4.43e-10 | 2.71e-10 | 102 |
| hsa051324 | Colorectum | MSS | Salmonella infection | 92/1875 | 249/8465 | 5.23e-08 | 9.74e-07 | 5.97e-07 | 92 |
| hsa049622 | Colorectum | MSS | Vasopressin-regulated water reabsorption | 17/1875 | 44/8465 | 9.76e-03 | 3.55e-02 | 2.18e-02 | 17 |
| hsa041445 | Colorectum | MSS | Endocytosis | 102/1875 | 251/8465 | 1.85e-11 | 4.43e-10 | 2.71e-10 | 102 |
| hsa051325 | Colorectum | MSS | Salmonella infection | 92/1875 | 249/8465 | 5.23e-08 | 9.74e-07 | 5.97e-07 | 92 |
| hsa049623 | Colorectum | MSS | Vasopressin-regulated water reabsorption | 17/1875 | 44/8465 | 9.76e-03 | 3.55e-02 | 2.18e-02 | 17 |
| hsa0513226 | Endometrium | AEH | Salmonella infection | 71/1197 | 249/8465 | 1.69e-09 | 3.44e-08 | 2.52e-08 | 71 |
| hsa0414524 | Endometrium | AEH | Phagosome | 41/1197 | 152/8465 | 2.12e-05 | 2.22e-04 | 1.63e-04 | 41 |
| hsa051466 | Endometrium | AEH | Amoebiasis | 29/1197 | 102/8465 | 1.22e-04 | 1.10e-03 | 8.06e-04 | 29 |
| hsa0414420 | Endometrium | AEH | Endocytosis | 56/1197 | 251/8465 | 2.58e-04 | 2.15e-03 | 1.57e-03 | 56 |
| Page: 1 2 3 4 5 |
Top |
Cell-cell communication analysis |
| Identification of potential cell-cell interactions between two cell types and their ligand-receptor pairs for different disease states |
| Ligand | Receptor | LRpair | Pathway | Tissue | Disease Stage |
| Page: 1 |
Top |
Single-cell gene regulatory network inference analysis |
| Find out the significant the regulons (TFs) and the target genes of each regulon across cell types for different disease states |
| TF | Cell Type | Tissue | Disease Stage | Target Gene | RSS | Regulon Activity |
| ∗The dot plots of a searched regulon are shown for all cell subpopulations in each disease state of each tissue based on the regulon specific score inferred using pySCENIC and by calculating the average expression. |
| Page: 1 |
Top |
Somatic mutation of malignant transformation related genes |
| Annotation of somatic variants for genes involved in malignant transformation |
| Hugo Symbol | Variant Class | Variant Classification | dbSNP RS | HGVSc | HGVSp | HGVSp Short | SWISSPROT | BIOTYPE | SIFT | PolyPhen | Tumor Sample Barcode | Tissue | Histology | Sex | Age | Stage | Therapy Types | Drugs | Outcome |
| RAB5C | insertion | Frame_Shift_Ins | novel | c.301_302insA | p.Thr101AsnfsTer6 | p.T101Nfs*6 | P51148 | protein_coding | TCGA-AO-A03P-01 | Breast | breast invasive carcinoma | Female | <65 | I/II | Hormone Therapy | letrozole | PD | ||
| RAB5C | SNV | Missense_Mutation | rs563186025 | c.125N>A | p.Arg42Gln | p.R42Q | P51148 | protein_coding | tolerated_low_confidence(0.13) | probably_damaging(0.979) | TCGA-A6-6781-01 | Colorectum | colon adenocarcinoma | Male | <65 | III/IV | Chemotherapy | oxaliplatin | SD |
| RAB5C | SNV | Missense_Mutation | c.728N>A | p.Arg243Gln | p.R243Q | P51148 | protein_coding | tolerated(0.27) | benign(0.024) | TCGA-AY-6197-01 | Colorectum | colon adenocarcinoma | Male | <65 | I/II | Unknown | Unknown | SD | |
| RAB5C | SNV | Missense_Mutation | rs757729852 | c.616N>A | p.Glu206Lys | p.E206K | P51148 | protein_coding | deleterious(0.02) | benign(0.244) | TCGA-CA-6717-01 | Colorectum | colon adenocarcinoma | Male | <65 | I/II | Chemotherapy | oxaliplatin | CR |
| RAB5C | SNV | Missense_Mutation | rs796621494 | c.266N>T | p.Ala89Val | p.A89V | P51148 | protein_coding | deleterious(0) | possibly_damaging(0.759) | TCGA-WS-AB45-01 | Colorectum | colon adenocarcinoma | Female | <65 | I/II | Unknown | Unknown | SD |
| RAB5C | SNV | Missense_Mutation | c.191N>T | p.Ala64Val | p.A64V | P51148 | protein_coding | deleterious(0.03) | benign(0.185) | TCGA-A5-A0G1-01 | Endometrium | uterine corpus endometrioid carcinoma | Female | >=65 | I/II | Unknown | Unknown | SD | |
| RAB5C | SNV | Missense_Mutation | novel | c.380N>T | p.Ala127Val | p.A127V | P51148 | protein_coding | deleterious(0.01) | probably_damaging(0.996) | TCGA-A5-A0G2-01 | Endometrium | uterine corpus endometrioid carcinoma | Female | <65 | III/IV | Unknown | Unknown | SD |
| RAB5C | SNV | Missense_Mutation | rs757729852 | c.616N>A | p.Glu206Lys | p.E206K | P51148 | protein_coding | deleterious(0.02) | benign(0.244) | TCGA-AP-A1E0-01 | Endometrium | uterine corpus endometrioid carcinoma | Female | <65 | III/IV | Chemotherapy | paclitaxel | SD |
| RAB5C | SNV | Missense_Mutation | c.665A>T | p.Asn222Ile | p.N222I | P51148 | protein_coding | deleterious(0.01) | benign(0.086) | TCGA-AX-A063-01 | Endometrium | uterine corpus endometrioid carcinoma | Female | <65 | I/II | Unknown | Unknown | SD | |
| RAB5C | SNV | Missense_Mutation | c.728G>T | p.Arg243Leu | p.R243L | P51148 | protein_coding | tolerated(0.08) | benign(0.013) | TCGA-AX-A2HC-01 | Endometrium | uterine corpus endometrioid carcinoma | Female | <65 | III/IV | Chemotherapy | paclitaxel | PD |
| Page: 1 2 3 |
Top |
Related drugs of malignant transformation related genes |
| Identification of chemicals and drugs interact with genes involved in malignant transfromation |
| (DGIdb 4.0) |
| Entrez ID | Symbol | Category | Interaction Types | Drug Claim Name | Drug Name | PMIDs |
| Page: 1 |

Copyright 2023-Present -The University of Texas Health Science Center at Houston |