| Entrez ID | Symbol | Replicates | Species | Organ | Tissue | Adj P-value | Log2FC | Malignancy |
| 5683 | PSMA2 | 052099_1652-all-cells | Human | Prostate | BPH | 1.49e-17 | -5.32e-01 | 0.1038 |
| 5683 | PSMA2 | Dong_P1 | Human | Prostate | Tumor | 8.31e-29 | -1.91e-01 | 0.035 |
| 5683 | PSMA2 | Dong_P3 | Human | Prostate | Tumor | 6.16e-23 | -1.44e-01 | 0.0278 |
| 5683 | PSMA2 | Dong_P4 | Human | Prostate | Tumor | 6.45e-03 | -8.00e-02 | 0.0292 |
| 5683 | PSMA2 | Dong_P5 | Human | Prostate | Tumor | 1.33e-45 | -2.99e-01 | 0.053 |
| 5683 | PSMA2 | Dong_P6 | Human | Prostate | Tumor | 1.08e-03 | -4.81e-01 | 0.0371 |
| 5683 | PSMA2 | P9 | Human | Prostate | Tumor | 1.91e-17 | -7.81e-01 | -0.0285 |
| 5683 | PSMA2 | GSM5353215_PA_AUG_PB_1B_S2 | Human | Prostate | Tumor | 2.27e-06 | -8.55e-01 | 0.1557 |
| 5683 | PSMA2 | GSM5353216_PA_PB1A_Pool_1_3_S50_L002 | Human | Prostate | Tumor | 2.08e-05 | -8.55e-01 | 0.159 |
| 5683 | PSMA2 | GSM5353217_PA_PB1A_Pool_2_S107_L004 | Human | Prostate | Tumor | 1.97e-02 | -8.55e-01 | 0.156 |
| 5683 | PSMA2 | GSM5353218_PA_PB1B_Pool_1_2_S74_L003 | Human | Prostate | Tumor | 4.19e-04 | -8.55e-01 | 0.1479 |
| 5683 | PSMA2 | GSM5353220_PA_PB1B_Pool_3_S51_L002 | Human | Prostate | Tumor | 2.08e-05 | -8.55e-01 | 0.1531 |
| 5683 | PSMA2 | GSM5353221_PA_PB2A_Pool_1_3_S25_L001 | Human | Prostate | Tumor | 6.65e-21 | -8.55e-01 | 0.1633 |
| 5683 | PSMA2 | GSM5353222_PA_PB2B_Pool_1_3_S52_L002 | Human | Prostate | Tumor | 3.82e-29 | -8.55e-01 | 0.1608 |
| 5683 | PSMA2 | GSM5353223_PA_PB2B_Pool_2_S26_L001 | Human | Prostate | Tumor | 9.49e-18 | -8.55e-01 | 0.1604 |
| 5683 | PSMA2 | GSM5353224_PA_PR5186_Pool_1_2_3_S27_L001 | Human | Prostate | Tumor | 4.42e-19 | -8.55e-01 | 0.1621 |
| 5683 | PSMA2 | GSM5353225_PA_PR5196-1_Pool_1_2_3_S53_L002 | Human | Prostate | Tumor | 4.44e-10 | -8.55e-01 | 0.1619 |
| 5683 | PSMA2 | GSM5353226_PA_PR5196-2_Pool_1_2_3_S54_L002 | Human | Prostate | Tumor | 2.27e-06 | -8.55e-01 | 0.159 |
| 5683 | PSMA2 | GSM5353227_PA_PR5199-193K_Pool_1_2_3_S55_L002 | Human | Prostate | Tumor | 6.34e-22 | -8.55e-01 | 0.1602 |
| 5683 | PSMA2 | GSM5353228_PA_PR5199-640K_Pool_1_3_S108_L004 | Human | Prostate | Tumor | 4.17e-03 | -8.55e-01 | 0.1537 |
| Tissue | Expression Dynamics | Abbreviation |
| Cervix | 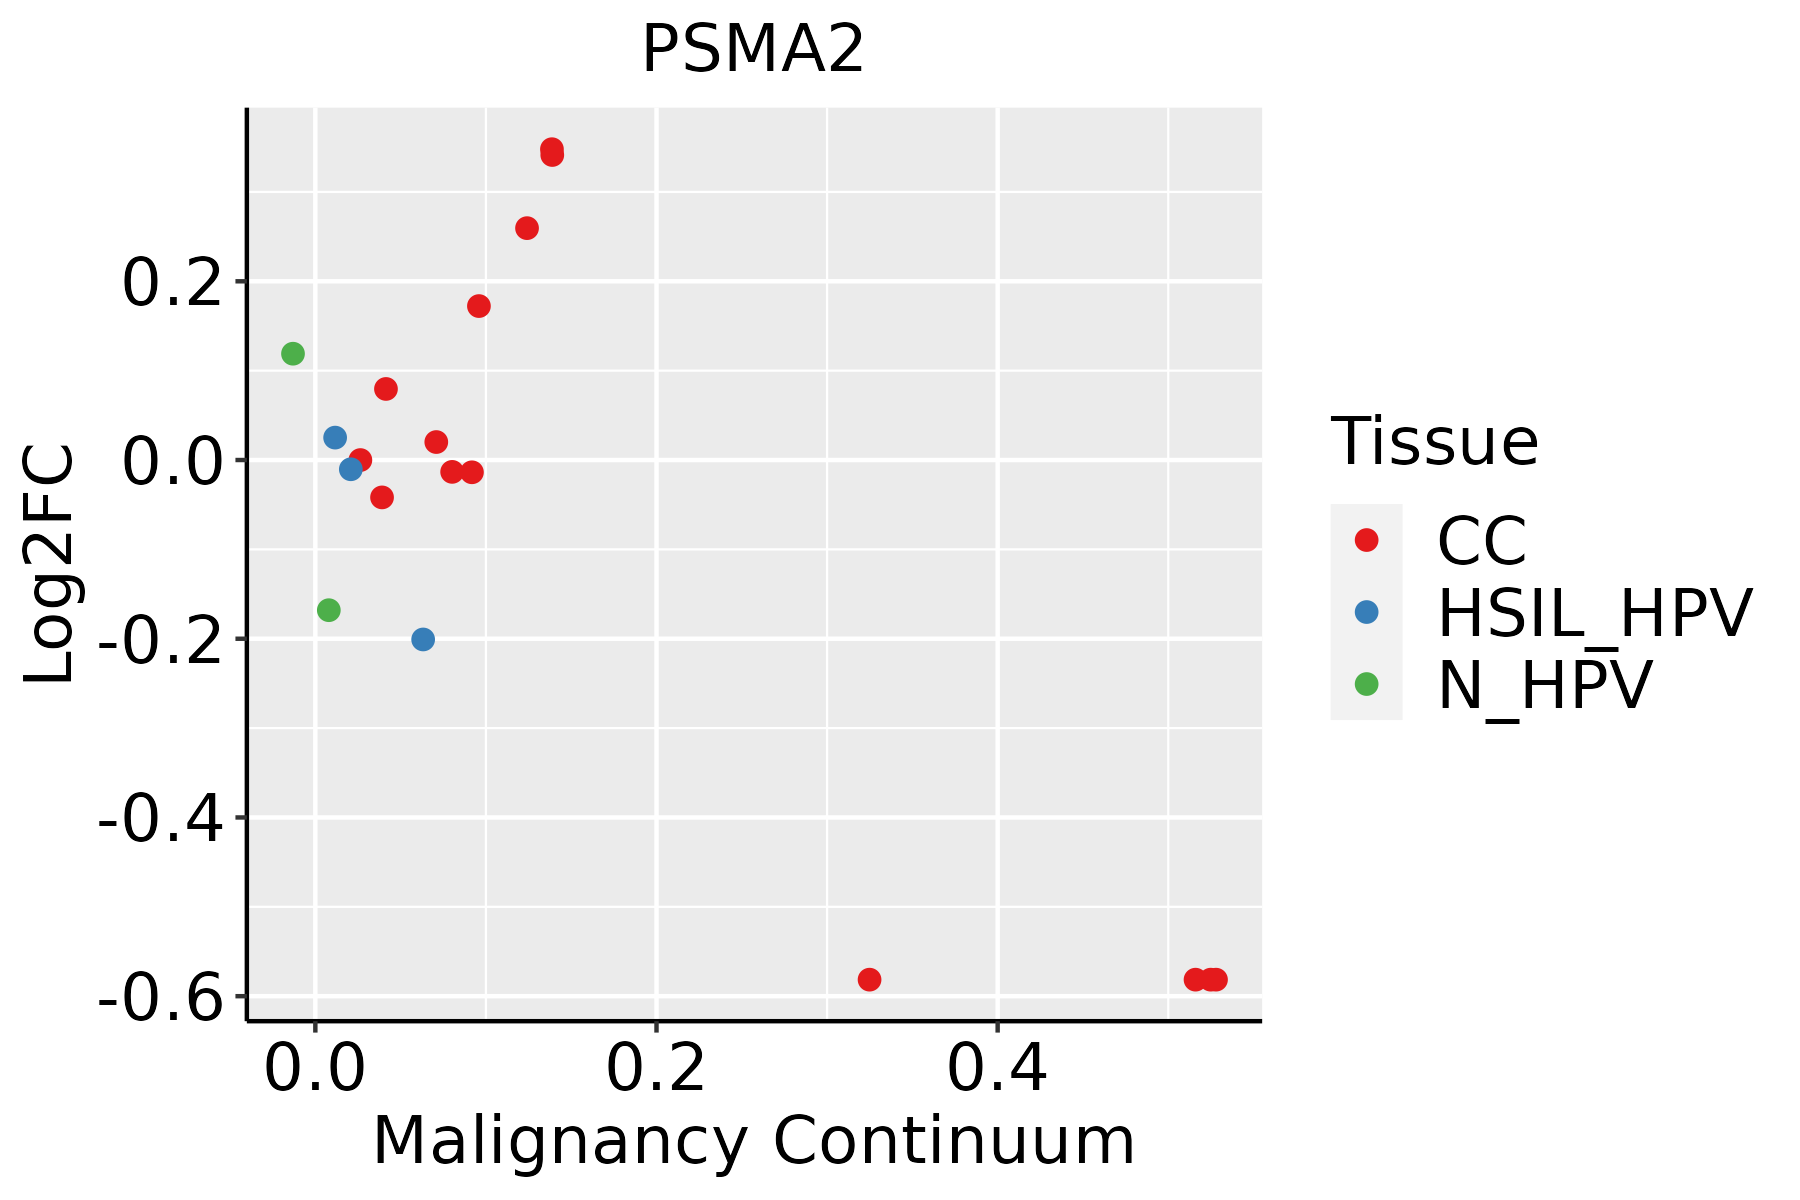 | CC: Cervix cancer |
| HSIL_HPV: HPV-infected high-grade squamous intraepithelial lesions |
| N_HPV: HPV-infected normal cervix |
| Endometrium |  | AEH: Atypical endometrial hyperplasia |
| EEC: Endometrioid Cancer |
| Esophagus | 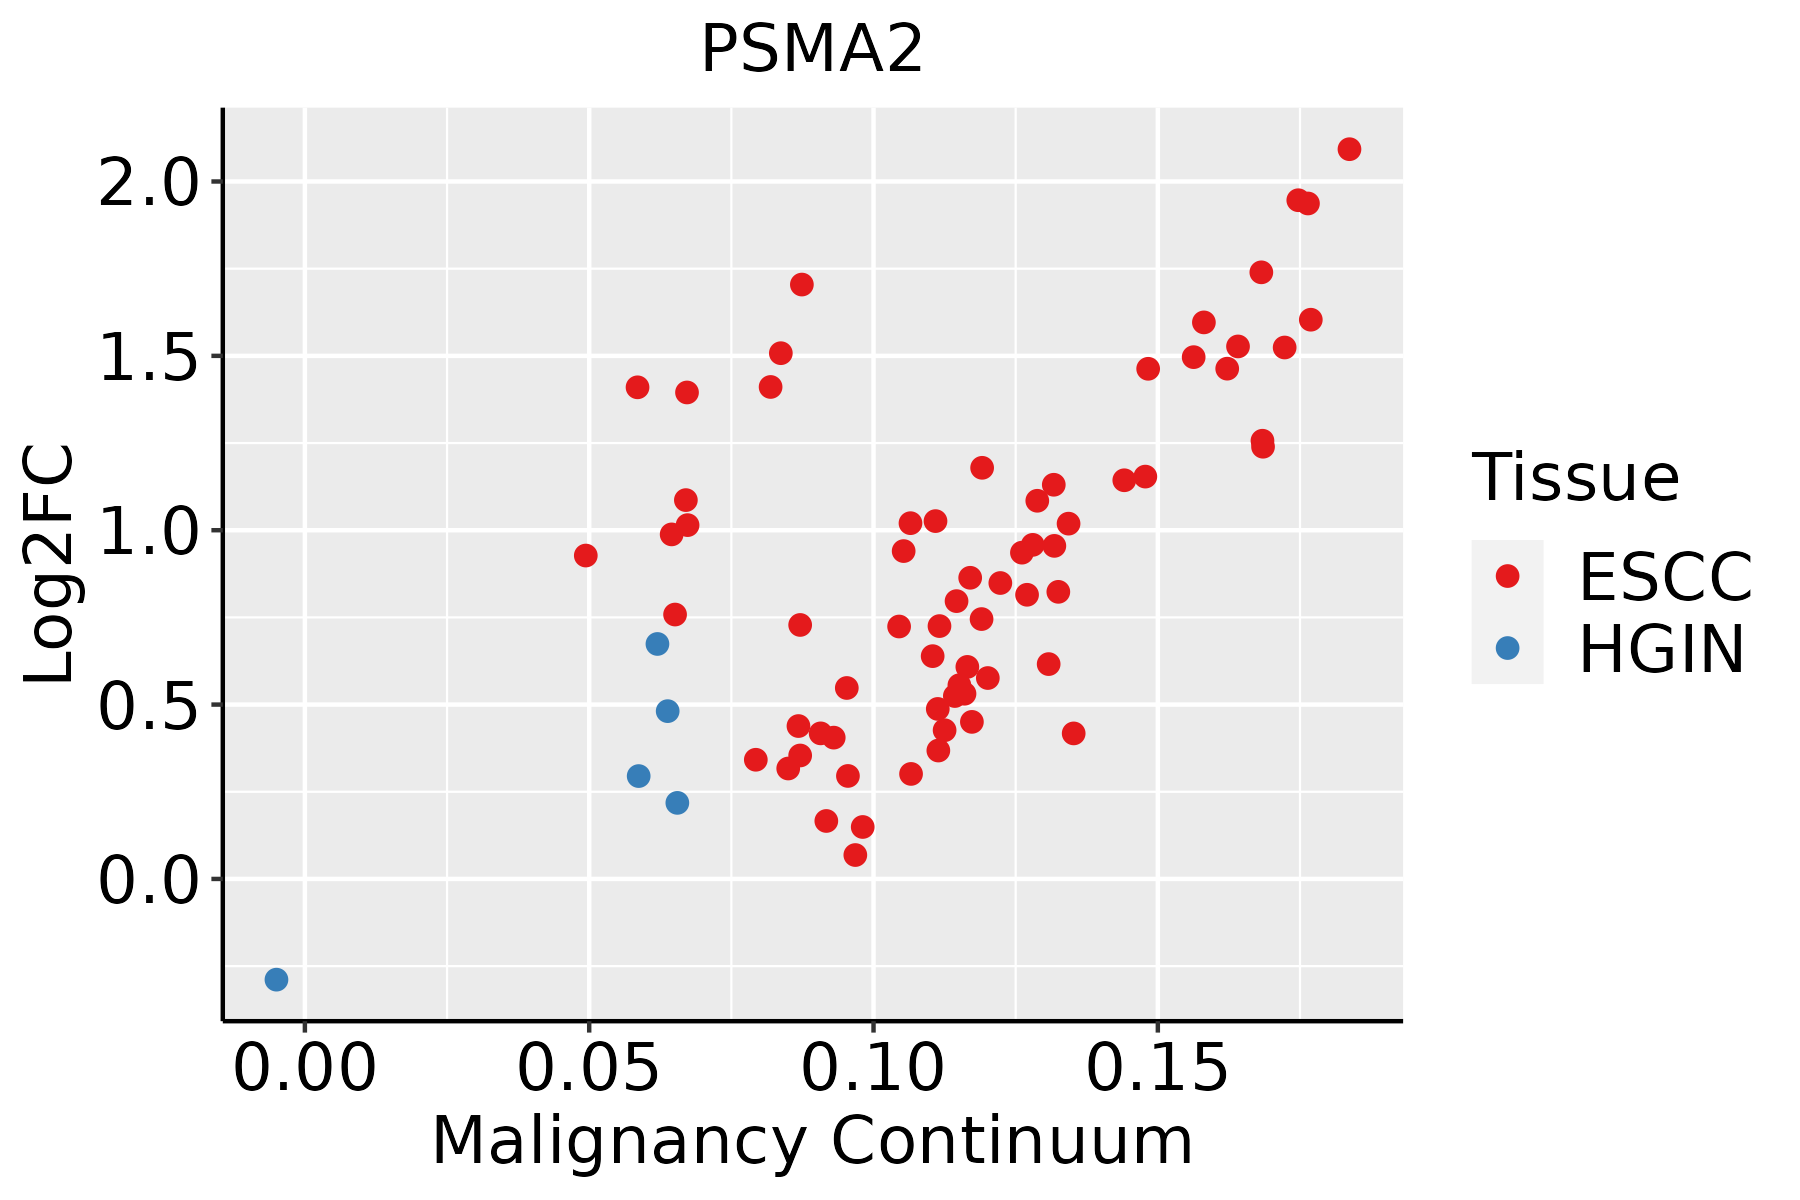 | ESCC: Esophageal squamous cell carcinoma |
| HGIN: High-grade intraepithelial neoplasias |
| LGIN: Low-grade intraepithelial neoplasias |
| GC | 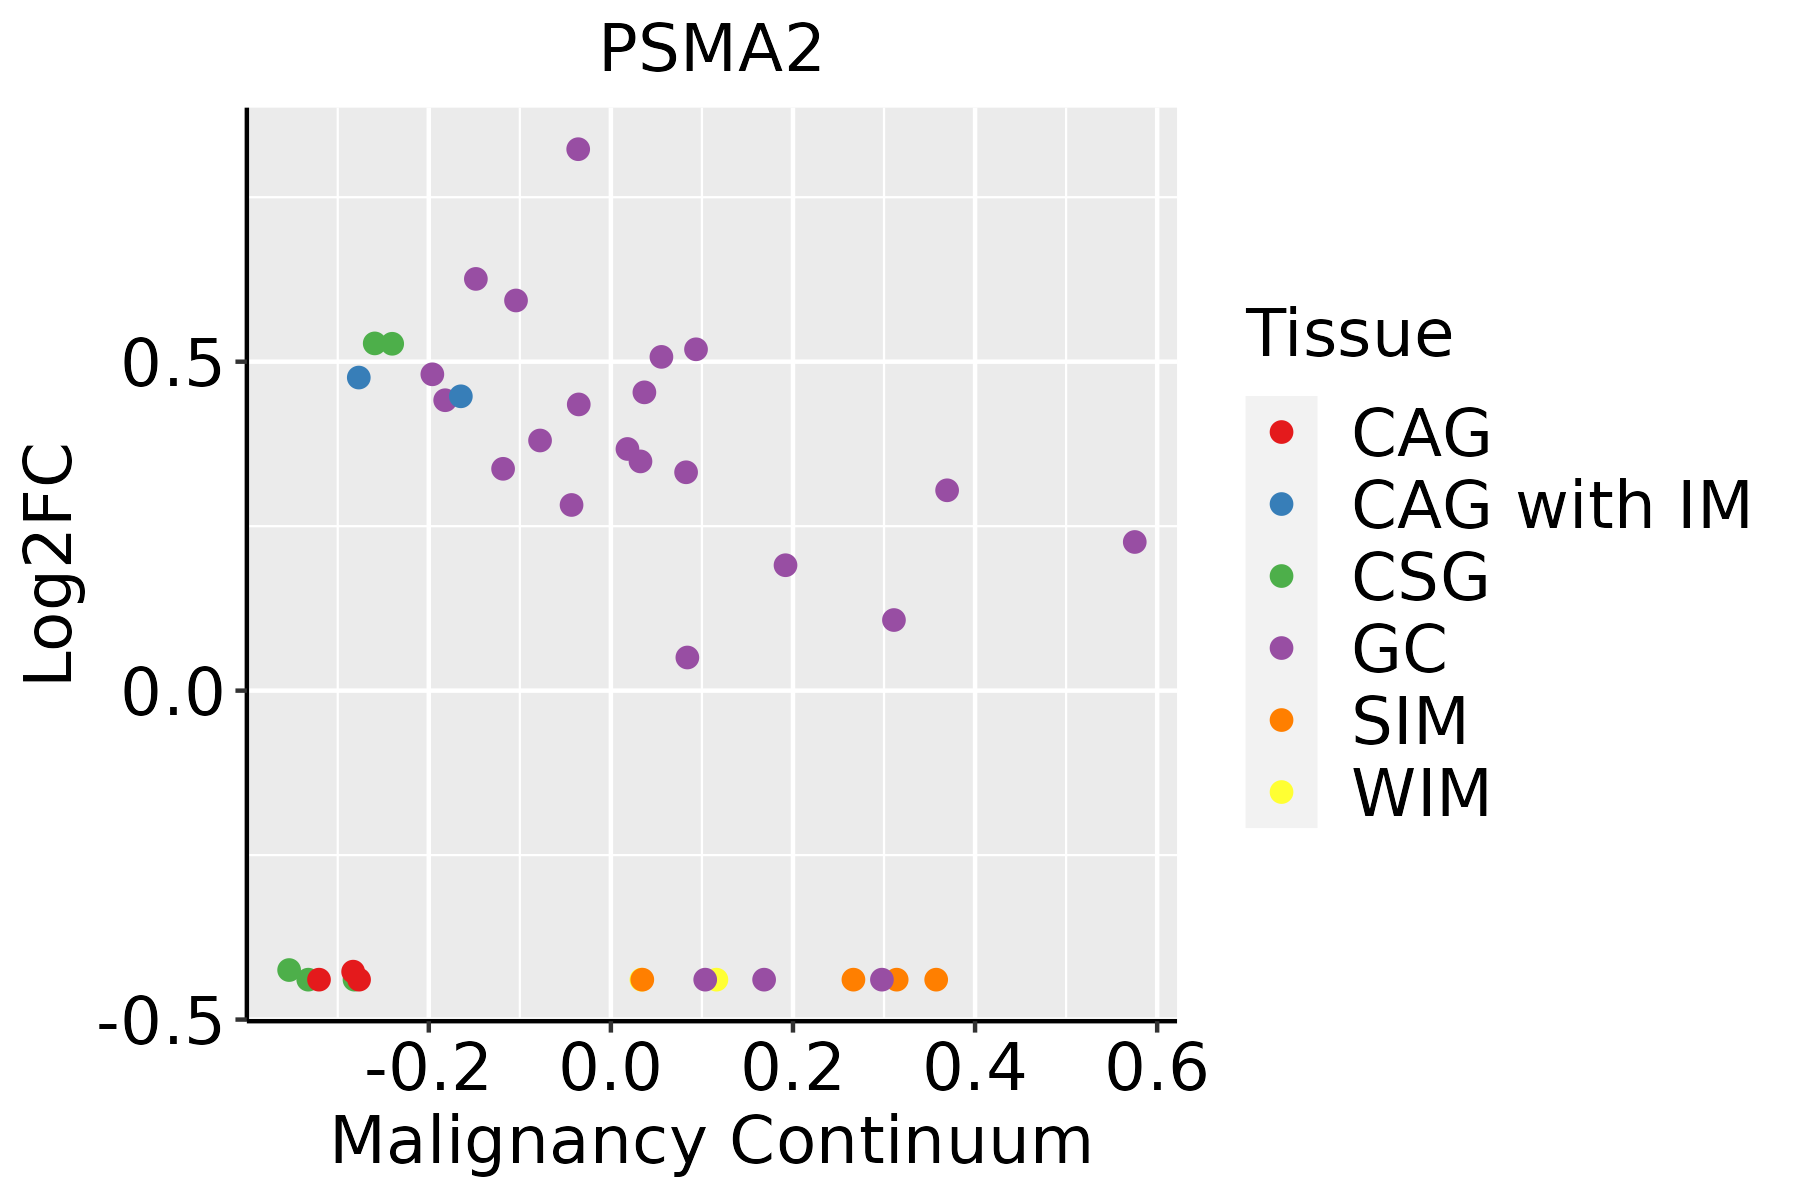 | CAG: Chronic atrophic gastritis |
| CAG with IM: Chronic atrophic gastritis with intestinal metaplasia |
| CSG: Chronic superficial gastritis |
| GC: Gastric cancer |
| SIM: Severe intestinal metaplasia |
| WIM: Wild intestinal metaplasia |
| Liver |  | HCC: Hepatocellular carcinoma |
| NAFLD: Non-alcoholic fatty liver disease |
| Oral Cavity | 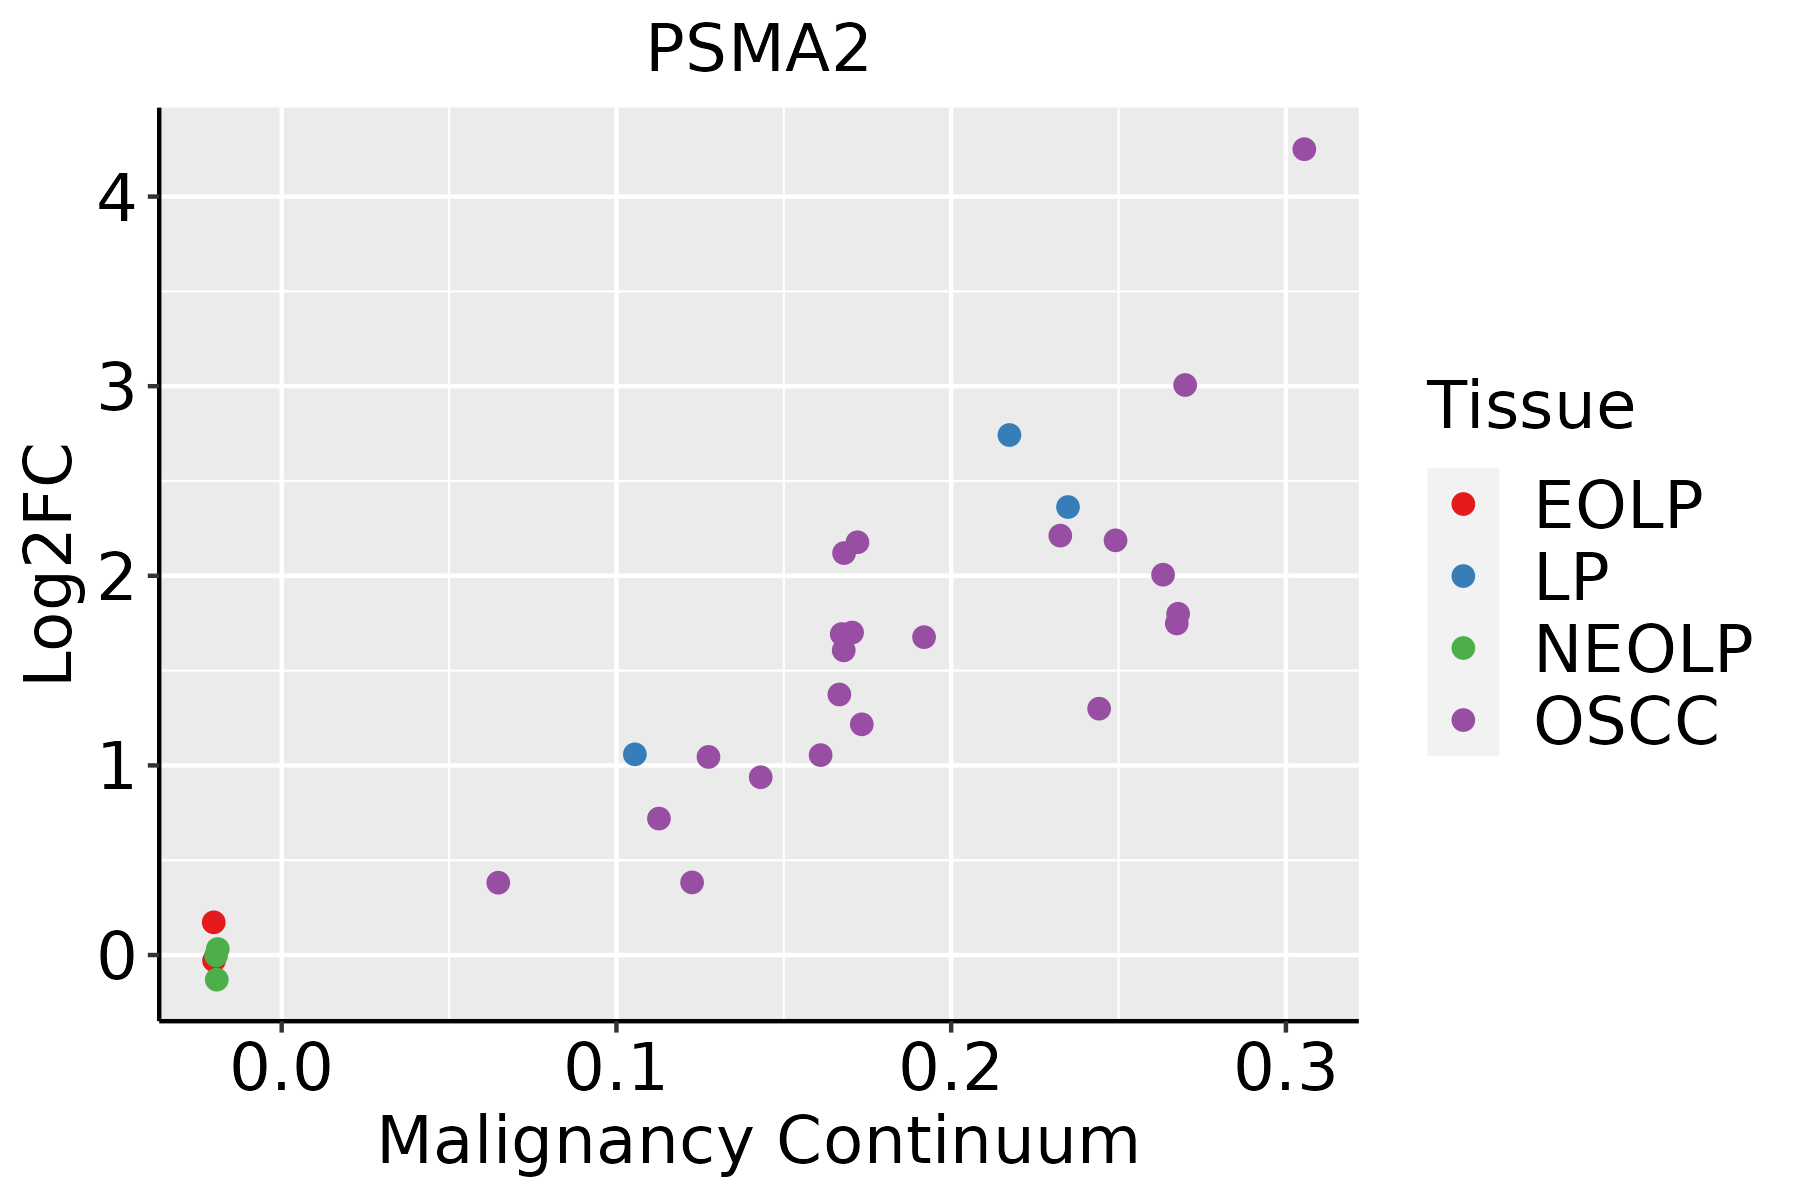 | EOLP: Erosive Oral lichen planus |
| LP: leukoplakia |
| NEOLP: Non-erosive oral lichen planus |
| OSCC: Oral squamous cell carcinoma |
| Prostate |  | BPH: Benign Prostatic Hyperplasia |
| Skin | 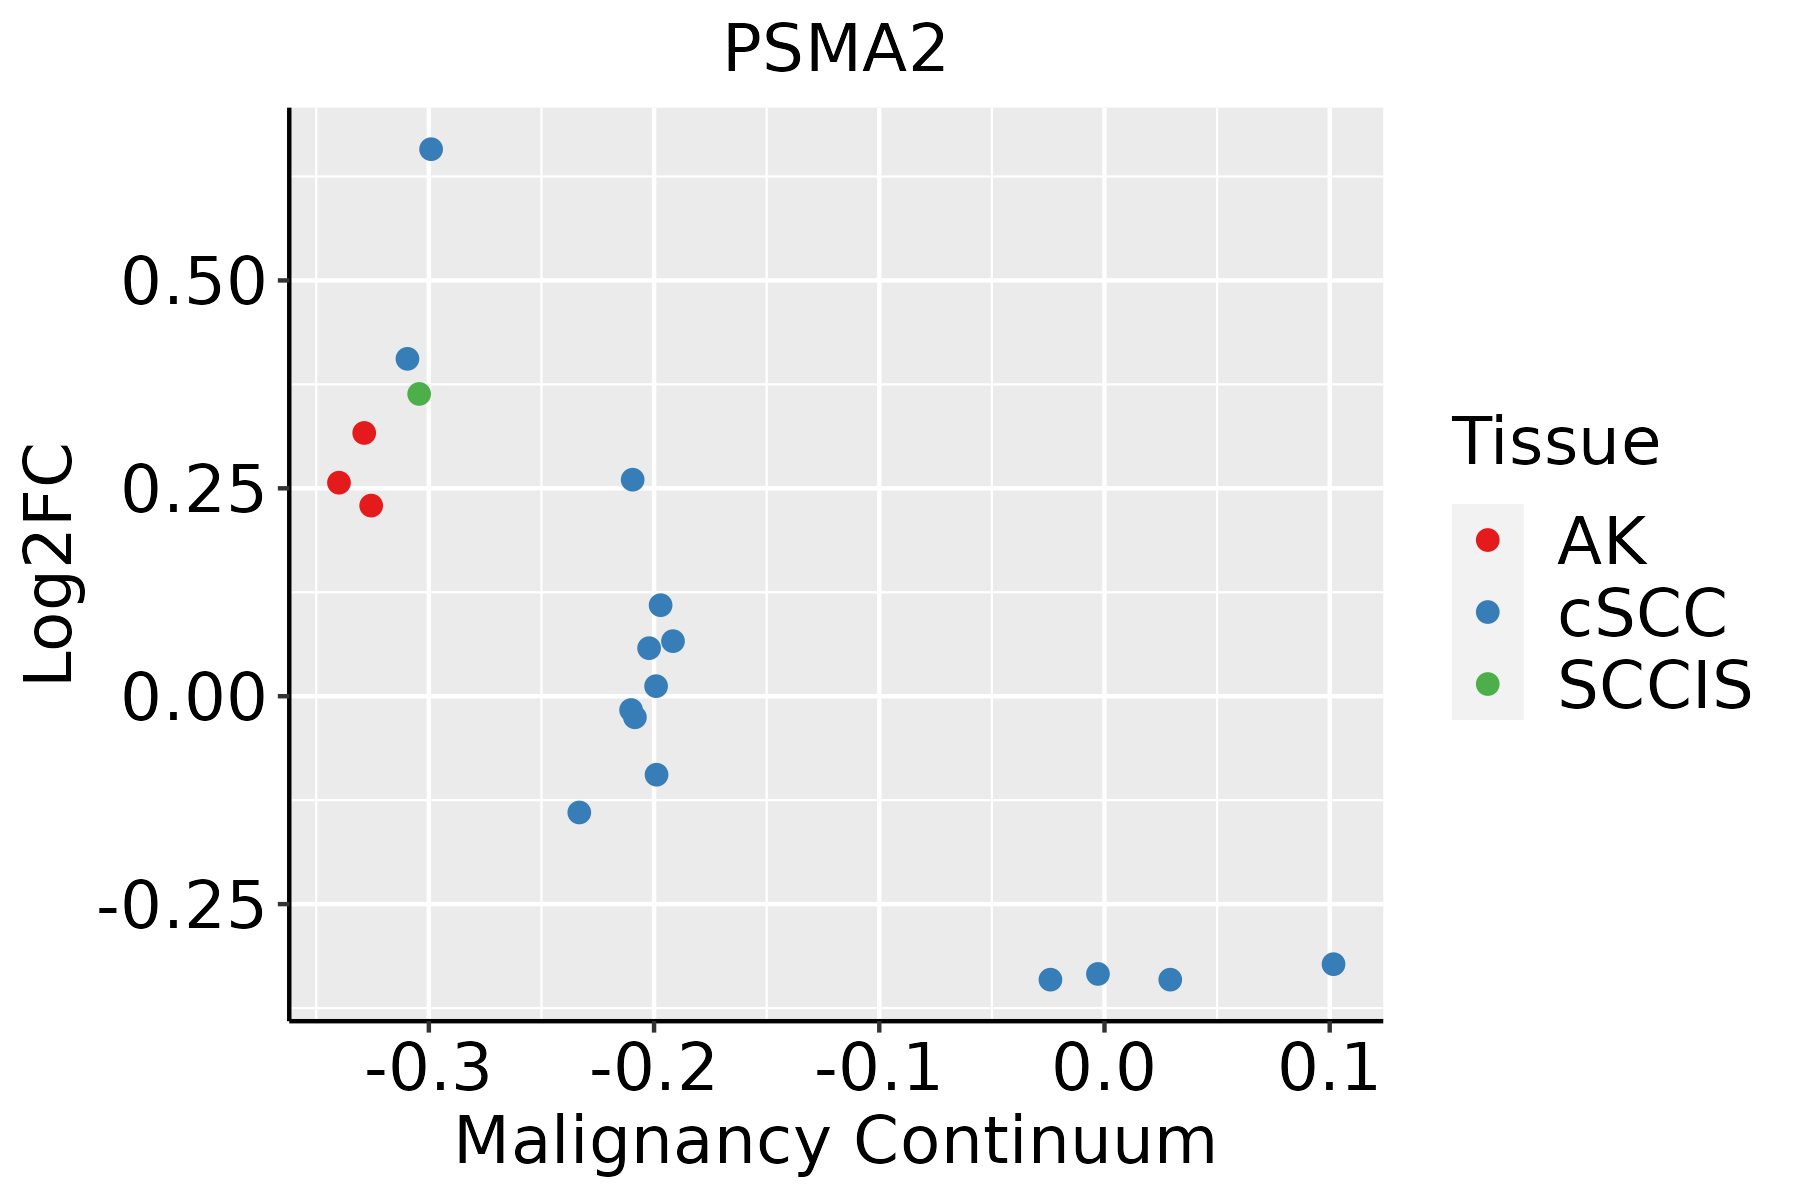 | AK: Actinic keratosis |
| cSCC: Cutaneous squamous cell carcinoma |
| SCCIS:squamous cell carcinoma in situ |
| Thyroid | 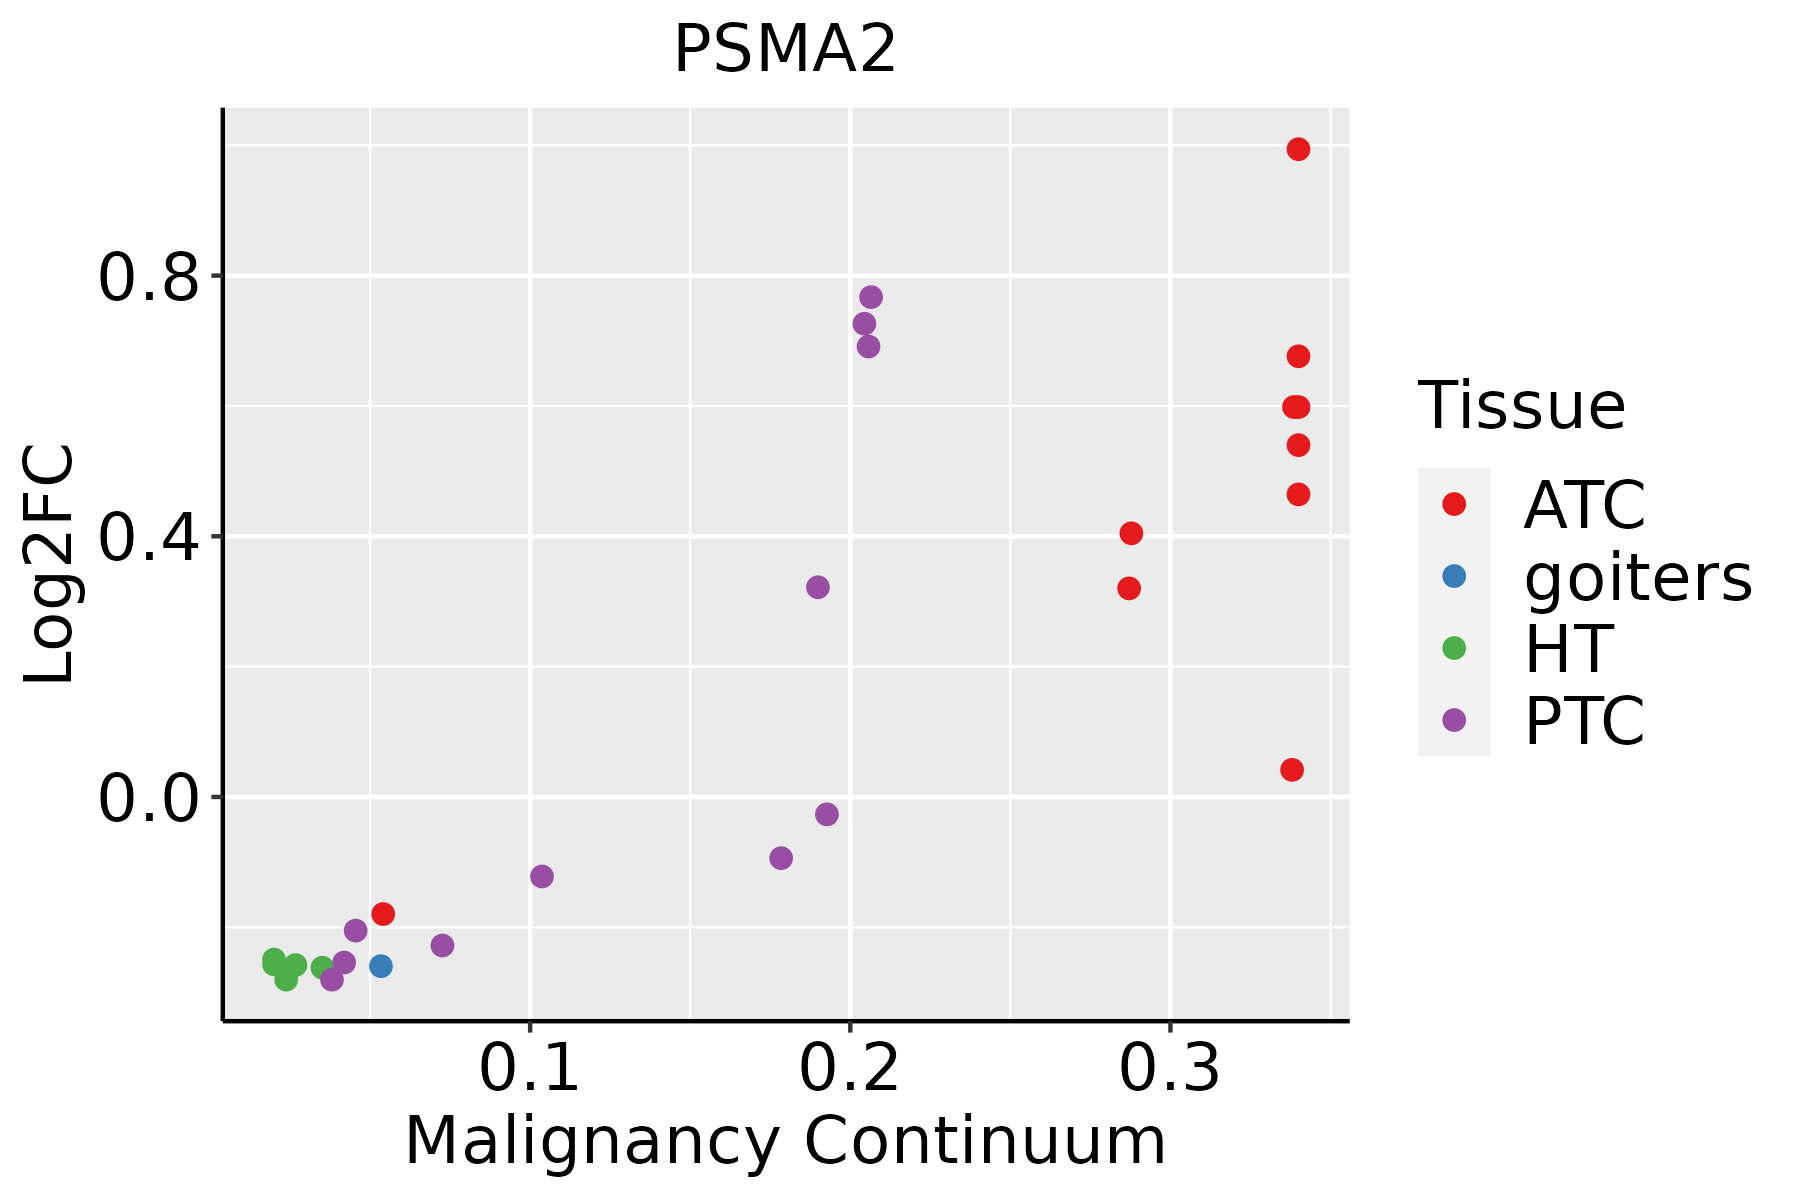 | ATC: Anaplastic thyroid cancer |
| HT: Hashimoto's thyroiditis |
| PTC: Papillary thyroid cancer |
| GO ID | Tissue | Disease Stage | Description | Gene Ratio | Bg Ratio | pvalue | p.adjust | Count |
| GO:001049810 | Cervix | CC | proteasomal protein catabolic process | 111/2311 | 490/18723 | 8.98e-11 | 1.58e-08 | 111 |
| GO:004316110 | Cervix | CC | proteasome-mediated ubiquitin-dependent protein catabolic process | 91/2311 | 412/18723 | 1.65e-08 | 1.25e-06 | 91 |
| GO:00096158 | Cervix | CC | response to virus | 73/2311 | 367/18723 | 2.22e-05 | 3.95e-04 | 73 |
| GO:001049816 | Endometrium | AEH | proteasomal protein catabolic process | 108/2100 | 490/18723 | 2.73e-12 | 4.67e-10 | 108 |
| GO:004316116 | Endometrium | AEH | proteasome-mediated ubiquitin-dependent protein catabolic process | 88/2100 | 412/18723 | 1.54e-09 | 1.36e-07 | 88 |
| GO:00096159 | Endometrium | AEH | response to virus | 63/2100 | 367/18723 | 3.81e-04 | 4.10e-03 | 63 |
| GO:001049817 | Endometrium | EEC | proteasomal protein catabolic process | 112/2168 | 490/18723 | 6.99e-13 | 1.40e-10 | 112 |
| GO:004316117 | Endometrium | EEC | proteasome-mediated ubiquitin-dependent protein catabolic process | 92/2168 | 412/18723 | 3.01e-10 | 3.23e-08 | 92 |
| GO:000961513 | Endometrium | EEC | response to virus | 66/2168 | 367/18723 | 1.78e-04 | 2.20e-03 | 66 |
| GO:0010498111 | Esophagus | ESCC | proteasomal protein catabolic process | 369/8552 | 490/18723 | 1.13e-41 | 1.80e-38 | 369 |
| GO:0043161111 | Esophagus | ESCC | proteasome-mediated ubiquitin-dependent protein catabolic process | 312/8552 | 412/18723 | 3.53e-36 | 4.48e-33 | 312 |
| GO:000961518 | Esophagus | ESCC | response to virus | 238/8552 | 367/18723 | 6.65e-14 | 3.32e-12 | 238 |
| GO:001049812 | Liver | Cirrhotic | proteasomal protein catabolic process | 216/4634 | 490/18723 | 2.52e-21 | 9.29e-19 | 216 |
| GO:004316112 | Liver | Cirrhotic | proteasome-mediated ubiquitin-dependent protein catabolic process | 184/4634 | 412/18723 | 4.52e-19 | 8.85e-17 | 184 |
| GO:00096155 | Liver | Cirrhotic | response to virus | 126/4634 | 367/18723 | 2.10e-05 | 2.77e-04 | 126 |
| GO:001049822 | Liver | HCC | proteasomal protein catabolic process | 351/7958 | 490/18723 | 6.92e-40 | 1.46e-36 | 351 |
| GO:004316122 | Liver | HCC | proteasome-mediated ubiquitin-dependent protein catabolic process | 299/7958 | 412/18723 | 7.82e-36 | 8.27e-33 | 299 |
| GO:000961511 | Liver | HCC | response to virus | 210/7958 | 367/18723 | 7.32e-09 | 1.86e-07 | 210 |
| GO:001049820 | Oral cavity | OSCC | proteasomal protein catabolic process | 336/7305 | 490/18723 | 5.45e-41 | 8.63e-38 | 336 |
| GO:004316120 | Oral cavity | OSCC | proteasome-mediated ubiquitin-dependent protein catabolic process | 285/7305 | 412/18723 | 5.68e-36 | 5.99e-33 | 285 |
| Hugo Symbol | Variant Class | Variant Classification | dbSNP RS | HGVSc | HGVSp | HGVSp Short | SWISSPROT | BIOTYPE | SIFT | PolyPhen | Tumor Sample Barcode | Tissue | Histology | Sex | Age | Stage | Therapy Types | Drugs | Outcome |
| PSMA2 | SNV | Missense_Mutation | novel | c.474G>C | p.Trp158Cys | p.W158C | P25787 | protein_coding | deleterious(0) | probably_damaging(1) | TCGA-D8-A1XW-01 | Breast | breast invasive carcinoma | Female | <65 | I/II | Chemotherapy | adriamycin+cyclophosphamide | SD |
| PSMA2 | SNV | Missense_Mutation | novel | c.643G>A | p.Glu215Lys | p.E215K | P25787 | protein_coding | tolerated(0.36) | benign(0.001) | TCGA-OL-A5DA-01 | Breast | breast invasive carcinoma | Female | <65 | I/II | Unknown | Unknown | SD |
| PSMA2 | insertion | Frame_Shift_Ins | novel | c.278_279insTTACTTCACTTTTTGTGCCATTTCAGGAGGGAAA | p.Ala94TyrfsTer59 | p.A94Yfs*59 | P25787 | protein_coding | | | TCGA-BH-A0AY-01 | Breast | breast invasive carcinoma | Female | <65 | I/II | Chemotherapy | | SD |
| PSMA2 | SNV | Missense_Mutation | | c.383N>A | p.Arg128His | p.R128H | P25787 | protein_coding | deleterious(0.03) | benign(0.095) | TCGA-AA-3811-01 | Colorectum | colon adenocarcinoma | Female | >=65 | III/IV | Unknown | Unknown | PD |
| PSMA2 | SNV | Missense_Mutation | novel | c.503T>G | p.Val168Gly | p.V168G | P25787 | protein_coding | tolerated(0.38) | benign(0.09) | TCGA-CA-6717-01 | Colorectum | colon adenocarcinoma | Male | <65 | I/II | Chemotherapy | oxaliplatin | CR |
| PSMA2 | SNV | Missense_Mutation | | c.323C>A | p.Ala108Asp | p.A108D | P25787 | protein_coding | tolerated(0.53) | benign(0.129) | TCGA-F4-6570-01 | Colorectum | colon adenocarcinoma | Female | >=65 | I/II | Unknown | Unknown | SD |
| PSMA2 | SNV | Missense_Mutation | novel | c.244G>A | p.Asp82Asn | p.D82N | P25787 | protein_coding | deleterious(0) | probably_damaging(0.953) | TCGA-A5-A0G2-01 | Endometrium | uterine corpus endometrioid carcinoma | Female | <65 | III/IV | Unknown | Unknown | SD |
| PSMA2 | SNV | Missense_Mutation | novel | c.495G>T | p.Lys165Asn | p.K165N | P25787 | protein_coding | deleterious(0.04) | benign(0.308) | TCGA-AX-A2HC-01 | Endometrium | uterine corpus endometrioid carcinoma | Female | <65 | III/IV | Chemotherapy | paclitaxel | PD |
| PSMA2 | SNV | Missense_Mutation | novel | c.681N>T | p.Lys227Asn | p.K227N | P25787 | protein_coding | tolerated(0.18) | possibly_damaging(0.494) | TCGA-B5-A1MR-01 | Endometrium | uterine corpus endometrioid carcinoma | Female | >=65 | III/IV | Unknown | Unknown | SD |
| PSMA2 | SNV | Missense_Mutation | | c.383N>A | p.Arg128His | p.R128H | P25787 | protein_coding | deleterious(0.03) | benign(0.095) | TCGA-BG-A0LX-01 | Endometrium | uterine corpus endometrioid carcinoma | Female | <65 | I/II | Unknown | Unknown | SD |
| Entrez ID | Symbol | Category | Interaction Types | Drug Claim Name | Drug Name | PMIDs |
| 5683 | PSMA2 | DRUGGABLE GENOME, PROTEASE | inhibitor | CHEMBL3545432 | IXAZOMIB CITRATE | |
| 5683 | PSMA2 | DRUGGABLE GENOME, PROTEASE | inhibitor | CHEMBL451887 | CARFILZOMIB | |
| 5683 | PSMA2 | DRUGGABLE GENOME, PROTEASE | | BORTEZOMIB | BORTEZOMIB | 24524217 |
| 5683 | PSMA2 | DRUGGABLE GENOME, PROTEASE | inhibitor | BORTEZOMIB | BORTEZOMIB | |
| 5683 | PSMA2 | DRUGGABLE GENOME, PROTEASE | | CARFILZOMIB | CARFILZOMIB | 24524217 |
| 5683 | PSMA2 | DRUGGABLE GENOME, PROTEASE | inhibitor | CHEMBL2103884 | OPROZOMIB | |
| 5683 | PSMA2 | DRUGGABLE GENOME, PROTEASE | inhibitor | CARFILZOMIB | CARFILZOMIB | |
| 5683 | PSMA2 | DRUGGABLE GENOME, PROTEASE | inhibitor | CHEMBL371405 | MARIZOMIB | |
| 5683 | PSMA2 | DRUGGABLE GENOME, PROTEASE | inhibitor | CHEMBL325041 | BORTEZOMIB | |


