
|
|||||
|
 | |
| |
| |
| |
| |
| |
|
Gene: PRKAR1A |
Gene summary for PRKAR1A |
| Gene information | Species | Human | Gene symbol | PRKAR1A | Gene ID | 5573 |
| Gene name | protein kinase cAMP-dependent type I regulatory subunit alpha | |
| Gene Alias | ACRDYS1 | |
| Cytomap | 17q24.2 | |
| Gene Type | protein-coding | GO ID | GO:0000003 | UniProtAcc | B2R5T5 |
Top |
Malignant transformation analysis |
| Identification of the aberrant gene expression in precancerous and cancerous lesions by comparing the gene expression of stem-like cells in diseased tissues with normal stem cells |
| Entrez ID | Symbol | Replicates | Species | Organ | Tissue | Adj P-value | Log2FC | Malignancy |
| 5573 | PRKAR1A | ATC09 | Human | Thyroid | ATC | 1.14e-12 | -3.75e-01 | 0.2871 |
| 5573 | PRKAR1A | ATC11 | Human | Thyroid | ATC | 3.52e-10 | 4.32e-02 | 0.3386 |
| 5573 | PRKAR1A | ATC12 | Human | Thyroid | ATC | 3.82e-08 | 3.50e-02 | 0.34 |
| 5573 | PRKAR1A | ATC13 | Human | Thyroid | ATC | 8.74e-13 | 6.98e-02 | 0.34 |
| 5573 | PRKAR1A | ATC1 | Human | Thyroid | ATC | 1.23e-12 | -2.93e-01 | 0.2878 |
| 5573 | PRKAR1A | ATC2 | Human | Thyroid | ATC | 1.09e-03 | 9.59e-01 | 0.34 |
| 5573 | PRKAR1A | ATC3 | Human | Thyroid | ATC | 5.79e-12 | -8.14e-02 | 0.338 |
| 5573 | PRKAR1A | ATC4 | Human | Thyroid | ATC | 2.69e-08 | 2.45e-01 | 0.34 |
| 5573 | PRKAR1A | ATC5 | Human | Thyroid | ATC | 1.37e-08 | 1.37e-01 | 0.34 |
| Page: 1 2 3 4 5 6 7 8 |
| Tissue | Expression Dynamics | Abbreviation |
| Endometrium | 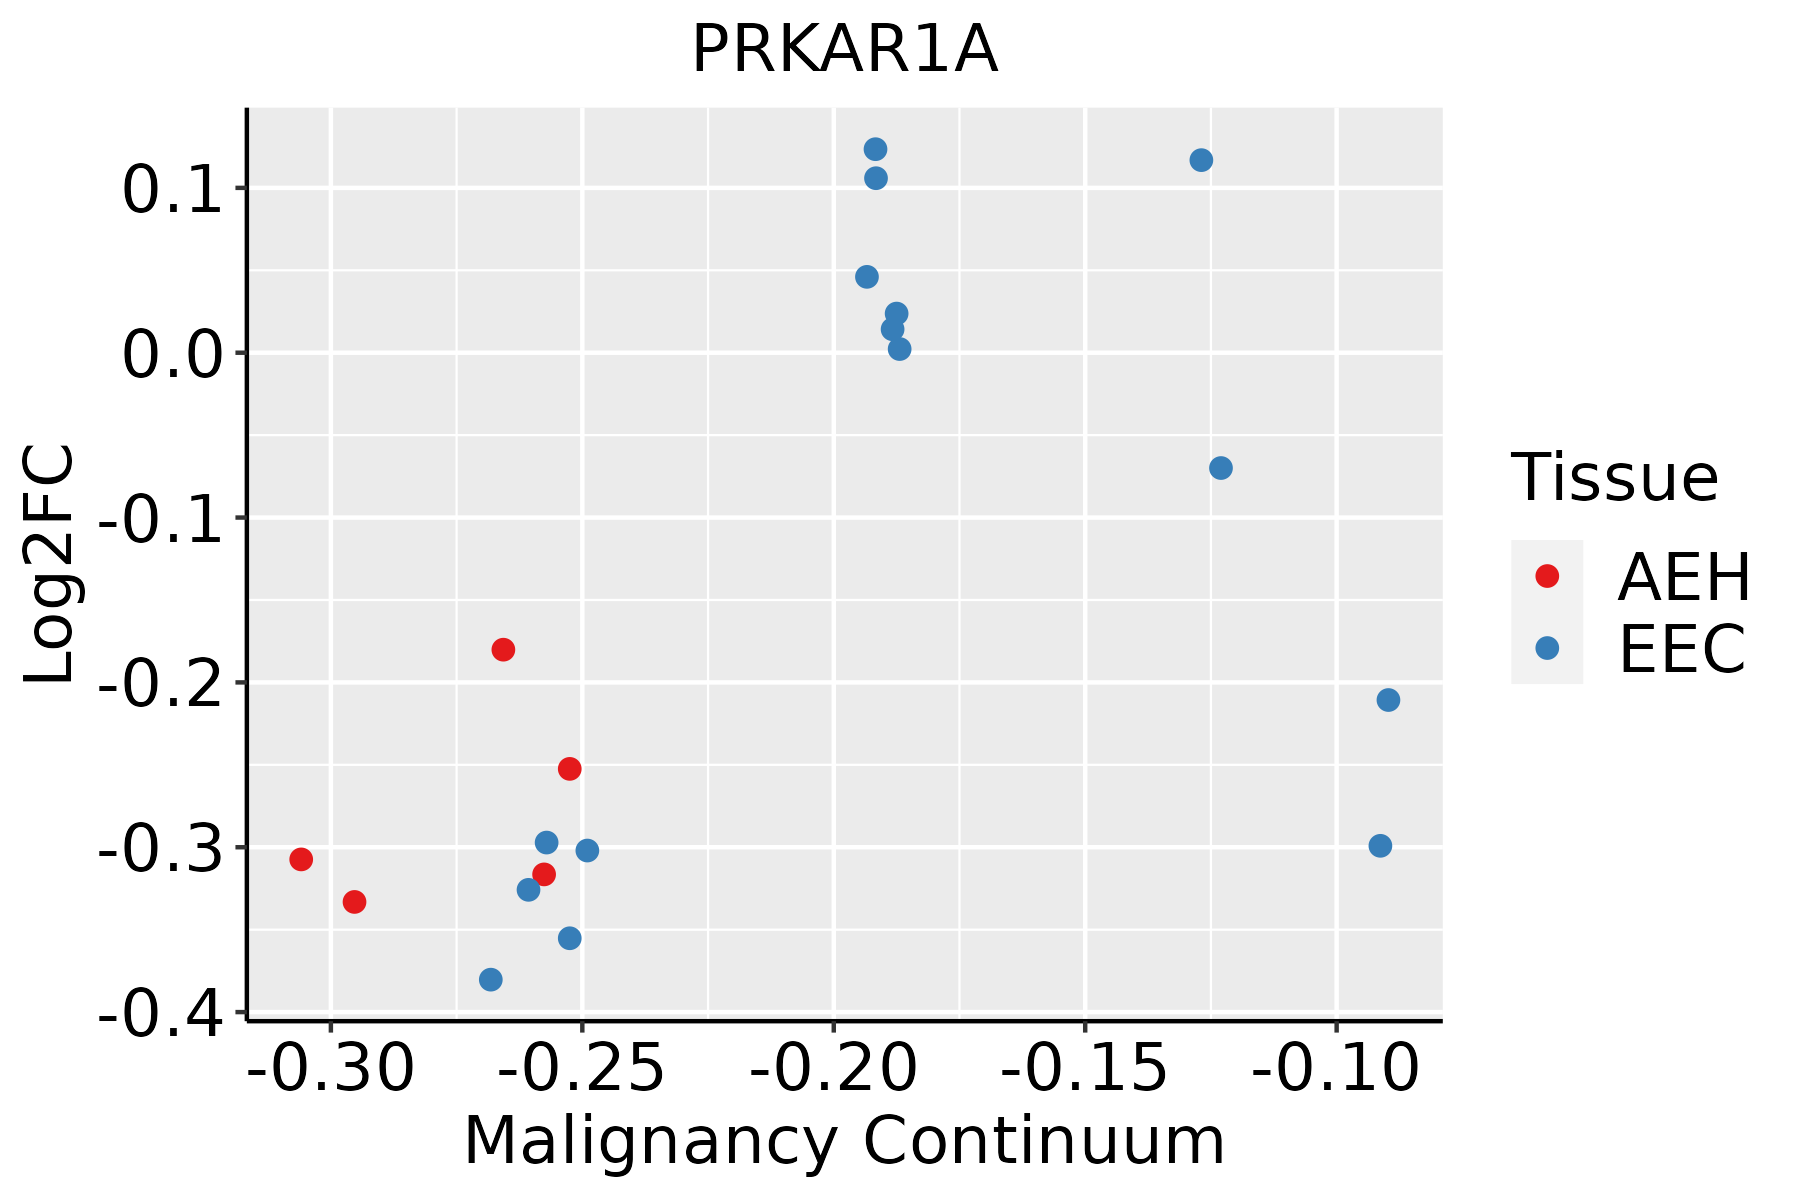 | AEH: Atypical endometrial hyperplasia |
| EEC: Endometrioid Cancer | ||
| Esophagus |  | ESCC: Esophageal squamous cell carcinoma |
| HGIN: High-grade intraepithelial neoplasias | ||
| LGIN: Low-grade intraepithelial neoplasias | ||
| Liver |  | HCC: Hepatocellular carcinoma |
| NAFLD: Non-alcoholic fatty liver disease | ||
| Oral Cavity |  | EOLP: Erosive Oral lichen planus |
| LP: leukoplakia | ||
| NEOLP: Non-erosive oral lichen planus | ||
| OSCC: Oral squamous cell carcinoma | ||
| Skin | 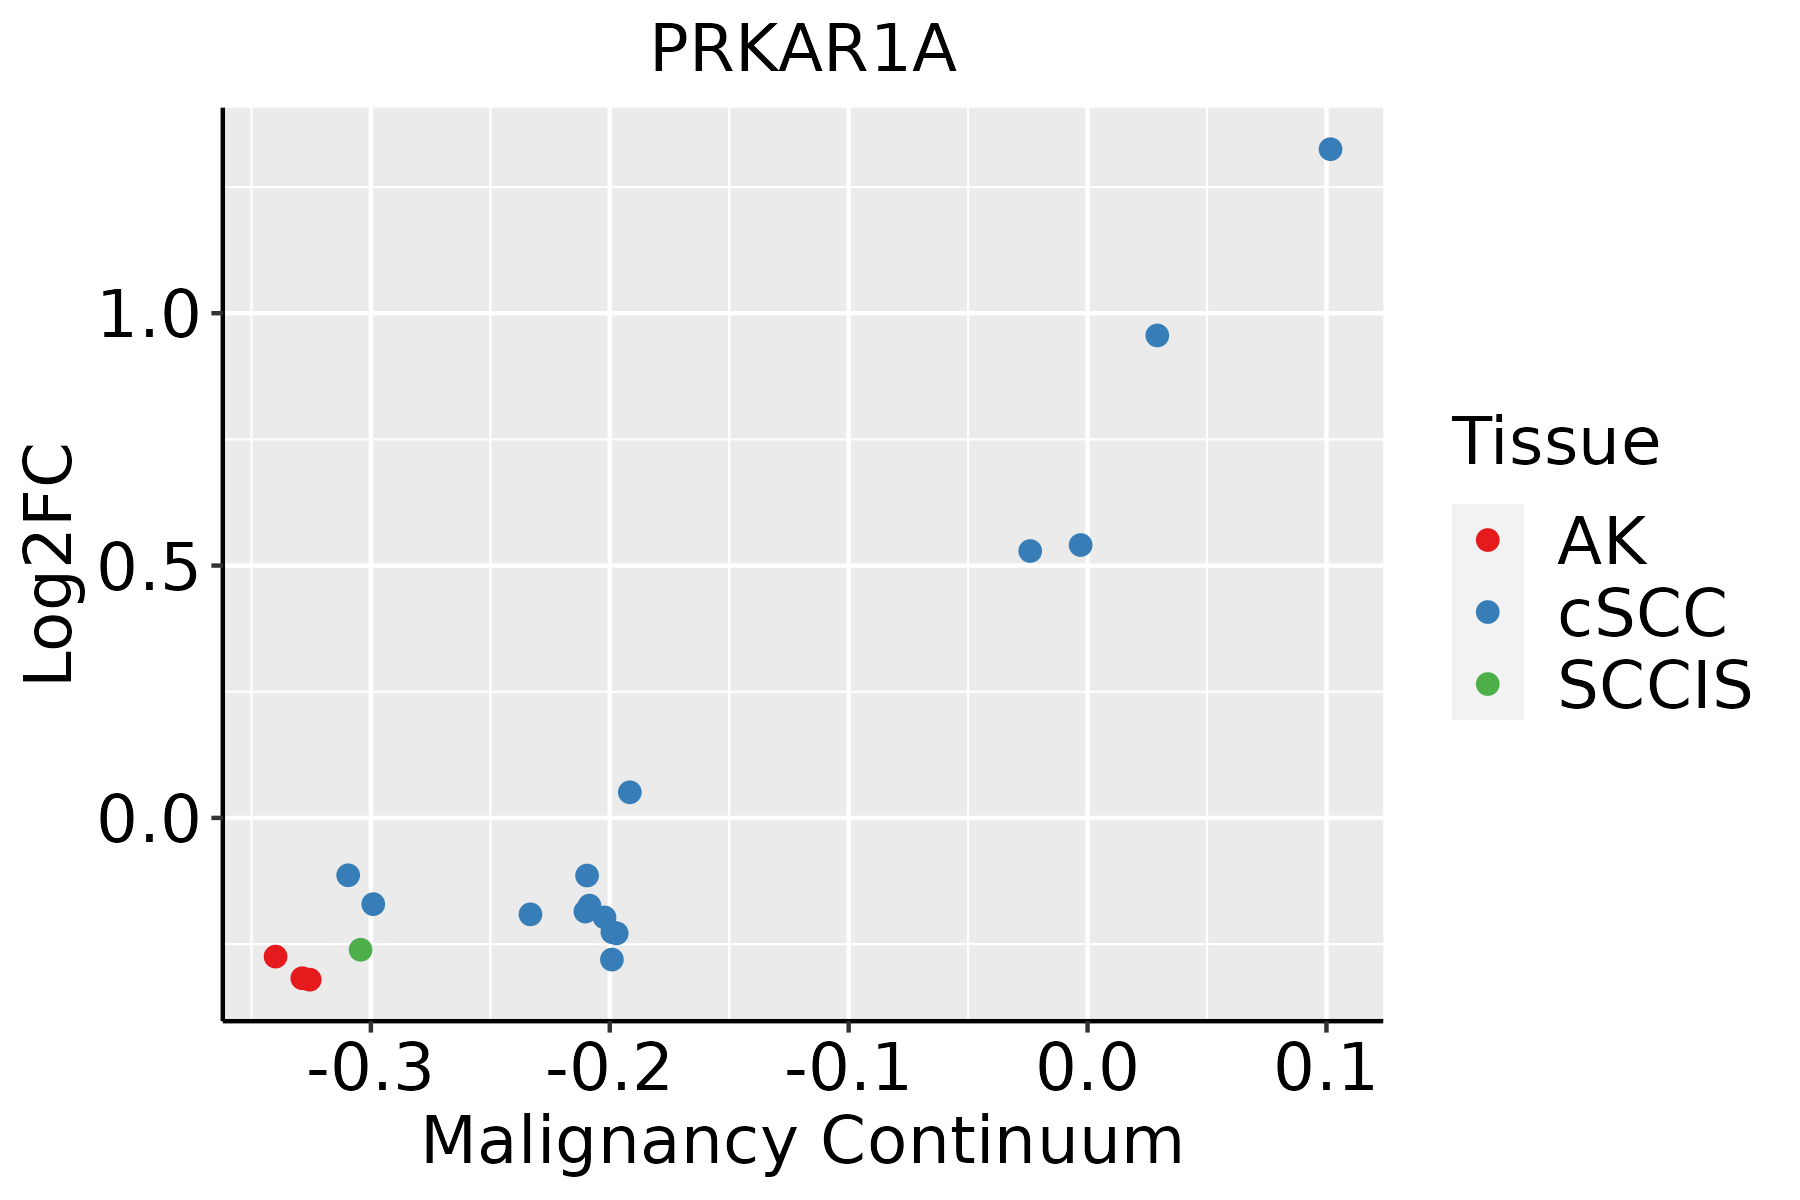 | AK: Actinic keratosis |
| cSCC: Cutaneous squamous cell carcinoma | ||
| SCCIS:squamous cell carcinoma in situ | ||
| Thyroid | 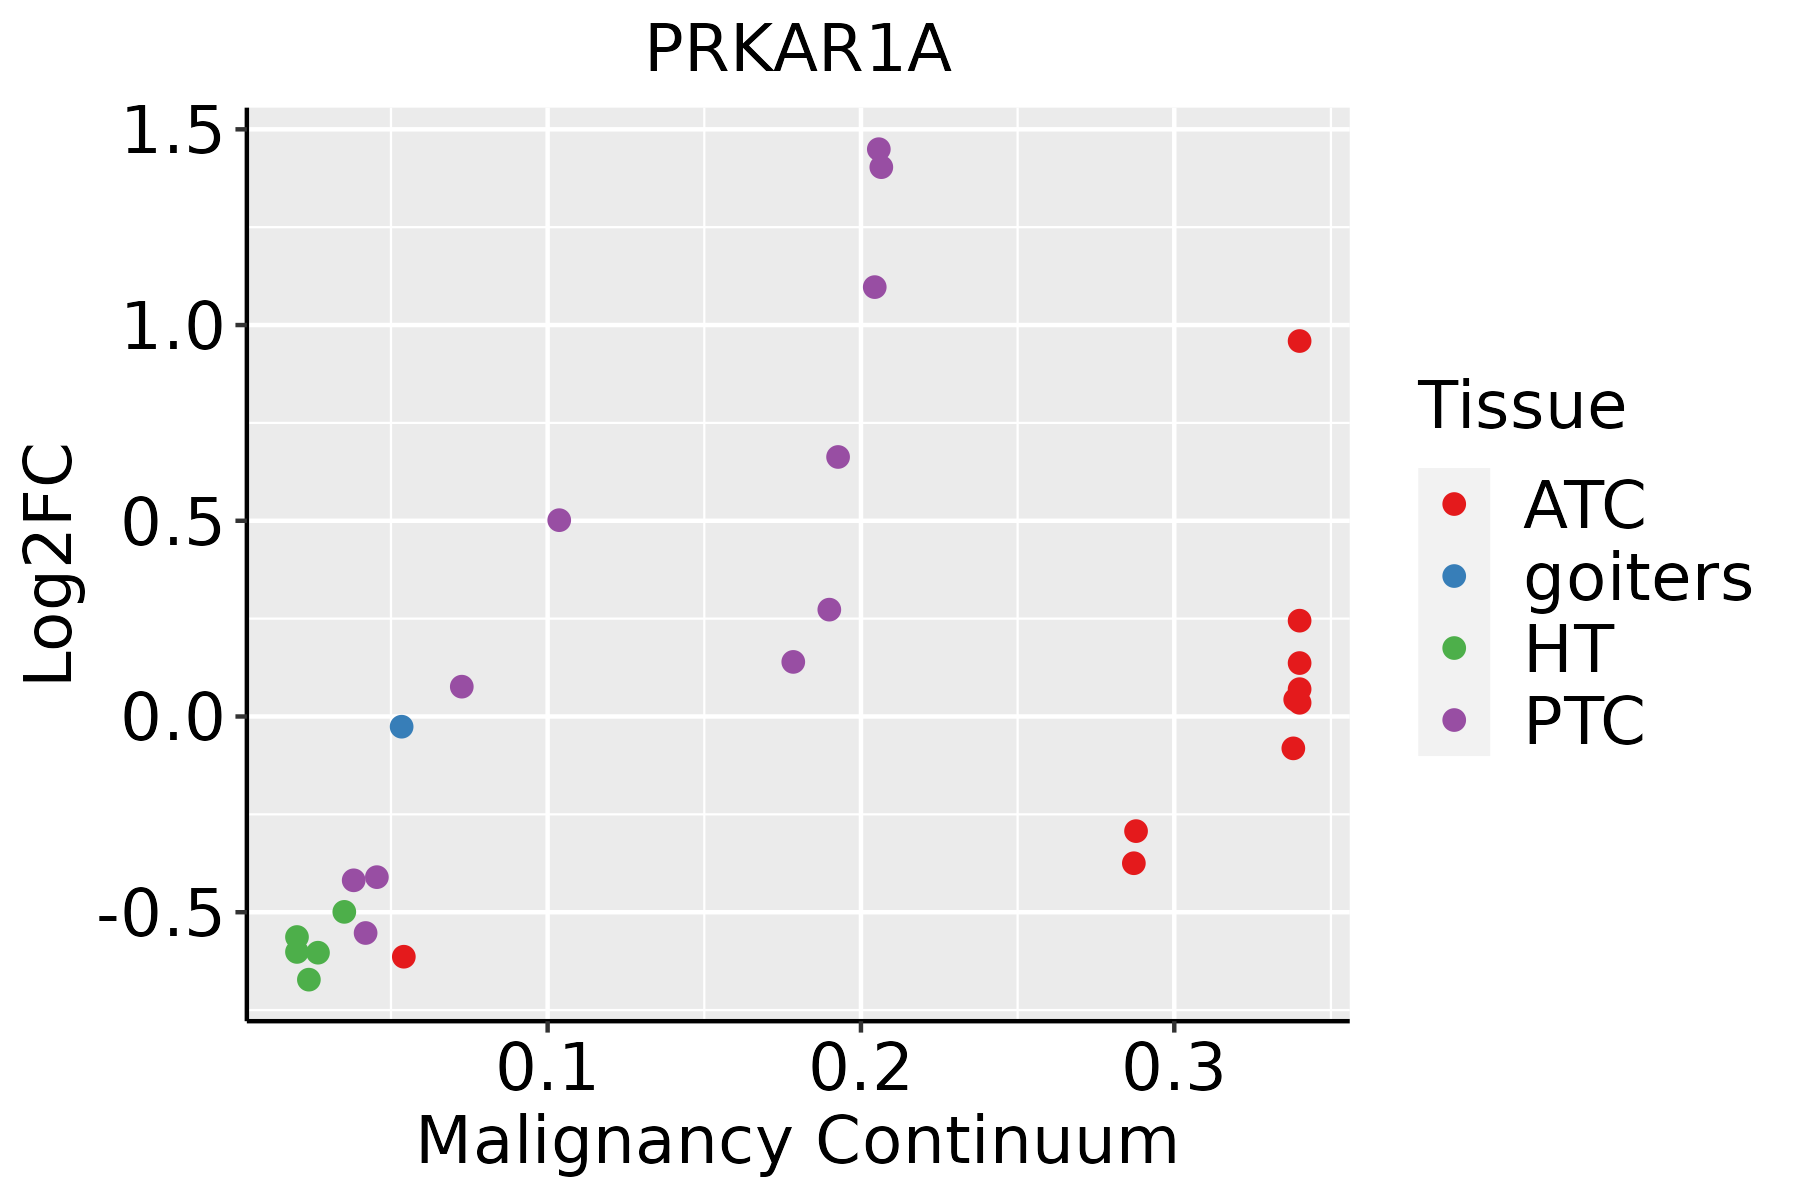 | ATC: Anaplastic thyroid cancer |
| HT: Hashimoto's thyroiditis | ||
| PTC: Papillary thyroid cancer |
| ∗log2FC in expression of this searched gene in stem-like cells from each diseased tissue sample relative to stem-like cells in normal samples in each tissue plotted against the malignancy continuum. Samples are colored based on if they are from different disease stage. |
Top |
Malignant transformation related pathway analysis |
| Find out the enriched GO biological processes and KEGG pathways involved in transition from healthy to precancer to cancer |
| Tissue | Disease Stage | Enriched GO biological Processes |
| Colorectum | AD |  |
| Colorectum | SER |  |
| Colorectum | MSS |  |
| Colorectum | MSI-H |  |
| Colorectum | FAP |  |
| ∗Top 15 enriched GO BP terms are showed in the bar plot of each disease state in each tissue. Each row represents a significant GO biological process which is colored according to the -log10(p.adjust). |
| Page: 1 2 3 4 5 6 7 8 9 |
| GO ID | Tissue | Disease Stage | Description | Gene Ratio | Bg Ratio | pvalue | p.adjust | Count |
| GO:00605376 | Endometrium | AEH | muscle tissue development | 83/2100 | 403/18723 | 2.57e-08 | 1.50e-06 | 83 |
| GO:003103210 | Endometrium | AEH | actomyosin structure organization | 46/2100 | 196/18723 | 8.00e-07 | 2.91e-05 | 46 |
| GO:00147065 | Endometrium | AEH | striated muscle tissue development | 75/2100 | 384/18723 | 1.06e-06 | 3.62e-05 | 75 |
| GO:00330022 | Endometrium | AEH | muscle cell proliferation | 51/2100 | 248/18723 | 1.26e-05 | 2.77e-04 | 51 |
| GO:002240714 | Endometrium | AEH | regulation of cell-cell adhesion | 79/2100 | 448/18723 | 2.90e-05 | 5.40e-04 | 79 |
| GO:004593616 | Endometrium | AEH | negative regulation of phosphate metabolic process | 77/2100 | 441/18723 | 5.13e-05 | 8.25e-04 | 77 |
| GO:001056316 | Endometrium | AEH | negative regulation of phosphorus metabolic process | 77/2100 | 442/18723 | 5.54e-05 | 8.79e-04 | 77 |
| GO:00426925 | Endometrium | AEH | muscle cell differentiation | 68/2100 | 384/18723 | 8.88e-05 | 1.30e-03 | 68 |
| GO:005134816 | Endometrium | AEH | negative regulation of transferase activity | 51/2100 | 268/18723 | 1.06e-04 | 1.52e-03 | 51 |
| GO:00421109 | Endometrium | AEH | T cell activation | 81/2100 | 487/18723 | 1.78e-04 | 2.30e-03 | 81 |
| GO:001063910 | Endometrium | AEH | negative regulation of organelle organization | 61/2100 | 348/18723 | 2.65e-04 | 3.09e-03 | 61 |
| GO:000193315 | Endometrium | AEH | negative regulation of protein phosphorylation | 60/2100 | 342/18723 | 2.89e-04 | 3.31e-03 | 60 |
| GO:00511465 | Endometrium | AEH | striated muscle cell differentiation | 51/2100 | 283/18723 | 4.20e-04 | 4.46e-03 | 51 |
| GO:004232615 | Endometrium | AEH | negative regulation of phosphorylation | 65/2100 | 385/18723 | 4.93e-04 | 5.06e-03 | 65 |
| GO:00071599 | Endometrium | AEH | leukocyte cell-cell adhesion | 63/2100 | 371/18723 | 5.11e-04 | 5.21e-03 | 63 |
| GO:00508639 | Endometrium | AEH | regulation of T cell activation | 57/2100 | 329/18723 | 5.58e-04 | 5.59e-03 | 57 |
| GO:00719008 | Endometrium | AEH | regulation of protein serine/threonine kinase activity | 61/2100 | 359/18723 | 6.11e-04 | 5.98e-03 | 61 |
| GO:0048738 | Endometrium | AEH | cardiac muscle tissue development | 43/2100 | 236/18723 | 9.06e-04 | 8.30e-03 | 43 |
| GO:19030379 | Endometrium | AEH | regulation of leukocyte cell-cell adhesion | 57/2100 | 336/18723 | 9.42e-04 | 8.57e-03 | 57 |
| GO:00026838 | Endometrium | AEH | negative regulation of immune system process | 69/2100 | 434/18723 | 1.76e-03 | 1.41e-02 | 69 |
| Page: 1 2 3 4 5 6 7 8 9 10 11 12 13 14 15 16 17 18 19 |
| Pathway ID | Tissue | Disease Stage | Description | Gene Ratio | Bg Ratio | pvalue | p.adjust | qvalue | Count |
| hsa049109 | Esophagus | ESCC | Insulin signaling pathway | 89/4205 | 137/8465 | 1.97e-04 | 7.32e-04 | 3.75e-04 | 89 |
| hsa0491014 | Esophagus | ESCC | Insulin signaling pathway | 89/4205 | 137/8465 | 1.97e-04 | 7.32e-04 | 3.75e-04 | 89 |
| hsa049106 | Liver | NAFLD | Insulin signaling pathway | 29/1043 | 137/8465 | 2.23e-03 | 2.46e-02 | 1.99e-02 | 29 |
| hsa0491011 | Liver | NAFLD | Insulin signaling pathway | 29/1043 | 137/8465 | 2.23e-03 | 2.46e-02 | 1.99e-02 | 29 |
| hsa0491021 | Liver | Cirrhotic | Insulin signaling pathway | 56/2530 | 137/8465 | 3.74e-03 | 1.50e-02 | 9.26e-03 | 56 |
| hsa0491031 | Liver | Cirrhotic | Insulin signaling pathway | 56/2530 | 137/8465 | 3.74e-03 | 1.50e-02 | 9.26e-03 | 56 |
| hsa0491041 | Liver | HCC | Insulin signaling pathway | 95/4020 | 137/8465 | 1.53e-07 | 1.97e-06 | 1.10e-06 | 95 |
| hsa0491051 | Liver | HCC | Insulin signaling pathway | 95/4020 | 137/8465 | 1.53e-07 | 1.97e-06 | 1.10e-06 | 95 |
| hsa049108 | Oral cavity | OSCC | Insulin signaling pathway | 83/3704 | 137/8465 | 4.83e-05 | 2.00e-04 | 1.02e-04 | 83 |
| hsa0491013 | Oral cavity | OSCC | Insulin signaling pathway | 83/3704 | 137/8465 | 4.83e-05 | 2.00e-04 | 1.02e-04 | 83 |
| hsa0491023 | Oral cavity | EOLP | Insulin signaling pathway | 33/1218 | 137/8465 | 1.61e-03 | 5.60e-03 | 3.30e-03 | 33 |
| hsa0491033 | Oral cavity | EOLP | Insulin signaling pathway | 33/1218 | 137/8465 | 1.61e-03 | 5.60e-03 | 3.30e-03 | 33 |
| Page: 1 |
Top |
Cell-cell communication analysis |
| Identification of potential cell-cell interactions between two cell types and their ligand-receptor pairs for different disease states |
| Ligand | Receptor | LRpair | Pathway | Tissue | Disease Stage |
| Page: 1 |
Top |
Single-cell gene regulatory network inference analysis |
| Find out the significant the regulons (TFs) and the target genes of each regulon across cell types for different disease states |
| TF | Cell Type | Tissue | Disease Stage | Target Gene | RSS | Regulon Activity |
| ∗The dot plots of a searched regulon are shown for all cell subpopulations in each disease state of each tissue based on the regulon specific score inferred using pySCENIC and by calculating the average expression. |
| Page: 1 |
Top |
Somatic mutation of malignant transformation related genes |
| Annotation of somatic variants for genes involved in malignant transformation |
| Hugo Symbol | Variant Class | Variant Classification | dbSNP RS | HGVSc | HGVSp | HGVSp Short | SWISSPROT | BIOTYPE | SIFT | PolyPhen | Tumor Sample Barcode | Tissue | Histology | Sex | Age | Stage | Therapy Types | Drugs | Outcome |
| PRKAR1A | SNV | Missense_Mutation | rs751660273 | c.1090N>T | p.Asp364Tyr | p.D364Y | P10644 | protein_coding | deleterious(0) | probably_damaging(0.981) | TCGA-A8-A08O-01 | Breast | breast invasive carcinoma | Female | <65 | III/IV | Chemotherapy | docetaxel | PD |
| PRKAR1A | SNV | Missense_Mutation | c.230N>T | p.Ser77Leu | p.S77L | P10644 | protein_coding | tolerated(0.13) | benign(0.006) | TCGA-AC-A23H-01 | Breast | breast invasive carcinoma | Female | >=65 | I/II | Unknown | Unknown | PD | |
| PRKAR1A | deletion | Frame_Shift_Del | c.15_21delTACCGCC | p.Ser5ArgfsTer122 | p.S5Rfs*122 | P10644 | protein_coding | TCGA-E9-A1RA-01 | Breast | breast invasive carcinoma | Female | <65 | I/II | Hormone Therapy | tamoxiphen | SD | |||
| PRKAR1A | deletion | Frame_Shift_Del | novel | c.386_404delCCAAAGCCATTGAAAAGAA | p.Ala129ValfsTer30 | p.A129Vfs*30 | P10644 | protein_coding | TCGA-EW-A3U0-01 | Breast | breast invasive carcinoma | Female | <65 | III/IV | Chemotherapy | cisplatin | CR | ||
| PRKAR1A | SNV | Missense_Mutation | novel | c.464C>G | p.Ser155Trp | p.S155W | P10644 | protein_coding | deleterious(0.02) | possibly_damaging(0.78) | TCGA-C5-A8ZZ-01 | Cervix | cervical & endocervical cancer | Female | <65 | I/II | Unspecific | Cisplatin | SD |
| PRKAR1A | SNV | Missense_Mutation | c.758N>C | p.Val253Ala | p.V253A | P10644 | protein_coding | deleterious(0) | probably_damaging(0.987) | TCGA-AA-3672-01 | Colorectum | colon adenocarcinoma | Female | >=65 | III/IV | Unknown | Unknown | SD | |
| PRKAR1A | SNV | Missense_Mutation | c.317N>T | p.Thr106Met | p.T106M | P10644 | protein_coding | deleterious(0.04) | benign(0.042) | TCGA-AY-6197-01 | Colorectum | colon adenocarcinoma | Male | <65 | I/II | Unknown | Unknown | SD | |
| PRKAR1A | SNV | Missense_Mutation | c.361N>T | p.Asp121Tyr | p.D121Y | P10644 | protein_coding | deleterious(0) | probably_damaging(0.969) | TCGA-AG-A002-01 | Colorectum | rectum adenocarcinoma | Male | <65 | I/II | Unknown | Unknown | SD | |
| PRKAR1A | SNV | Missense_Mutation | novel | c.974N>T | p.Gly325Val | p.G325V | P10644 | protein_coding | deleterious(0) | probably_damaging(1) | TCGA-AG-A002-01 | Colorectum | rectum adenocarcinoma | Male | <65 | I/II | Unknown | Unknown | SD |
| PRKAR1A | SNV | Missense_Mutation | novel | c.1103N>A | p.Arg368Gln | p.R368Q | P10644 | protein_coding | deleterious(0) | probably_damaging(0.988) | TCGA-AG-A002-01 | Colorectum | rectum adenocarcinoma | Male | <65 | I/II | Unknown | Unknown | SD |
| Page: 1 2 3 4 |
Top |
Related drugs of malignant transformation related genes |
| Identification of chemicals and drugs interact with genes involved in malignant transfromation |
| (DGIdb 4.0) |
| Entrez ID | Symbol | Category | Interaction Types | Drug Claim Name | Drug Name | PMIDs |
| Page: 1 |

Copyright 2023-Present -The University of Texas Health Science Center at Houston |