
|
|||||
|
 | |
| |
| |
| |
| |
| |
|
Gene: PRDM2 |
Gene summary for PRDM2 |
| Gene information | Species | Human | Gene symbol | PRDM2 | Gene ID | 7799 |
| Gene name | PR/SET domain 2 | |
| Gene Alias | HUMHOXY1 | |
| Cytomap | 1p36.21 | |
| Gene Type | protein-coding | GO ID | GO:0000122 | UniProtAcc | Q13029 |
Top |
Malignant transformation analysis |
| Identification of the aberrant gene expression in precancerous and cancerous lesions by comparing the gene expression of stem-like cells in diseased tissues with normal stem cells |
| Entrez ID | Symbol | Replicates | Species | Organ | Tissue | Adj P-value | Log2FC | Malignancy |
| 7799 | PRDM2 | cSCC_p8 | Human | Skin | cSCC | 4.95e-02 | 6.33e-02 | -0.1971 |
| 7799 | PRDM2 | male-WTA | Human | Thyroid | PTC | 1.19e-32 | 1.59e-01 | 0.1037 |
| 7799 | PRDM2 | PTC01 | Human | Thyroid | PTC | 1.88e-17 | 1.07e-01 | 0.1899 |
| 7799 | PRDM2 | PTC03 | Human | Thyroid | PTC | 5.13e-09 | 7.40e-01 | 0.1784 |
| 7799 | PRDM2 | PTC04 | Human | Thyroid | PTC | 1.87e-24 | 3.65e-01 | 0.1927 |
| 7799 | PRDM2 | PTC05 | Human | Thyroid | PTC | 1.71e-25 | 1.13e+00 | 0.2065 |
| 7799 | PRDM2 | PTC06 | Human | Thyroid | PTC | 2.15e-32 | 9.98e-01 | 0.2057 |
| 7799 | PRDM2 | PTC07 | Human | Thyroid | PTC | 1.33e-37 | 7.04e-01 | 0.2044 |
| 7799 | PRDM2 | ATC09 | Human | Thyroid | ATC | 1.55e-07 | 9.86e-04 | 0.2871 |
| 7799 | PRDM2 | ATC12 | Human | Thyroid | ATC | 2.03e-11 | -5.24e-02 | 0.34 |
| 7799 | PRDM2 | ATC13 | Human | Thyroid | ATC | 5.20e-33 | 7.64e-01 | 0.34 |
| 7799 | PRDM2 | ATC1 | Human | Thyroid | ATC | 1.24e-06 | 4.73e-02 | 0.2878 |
| 7799 | PRDM2 | ATC2 | Human | Thyroid | ATC | 7.64e-07 | 7.30e-01 | 0.34 |
| 7799 | PRDM2 | ATC3 | Human | Thyroid | ATC | 2.42e-04 | 5.52e-02 | 0.338 |
| 7799 | PRDM2 | ATC4 | Human | Thyroid | ATC | 1.98e-09 | 7.10e-02 | 0.34 |
| 7799 | PRDM2 | ATC5 | Human | Thyroid | ATC | 9.40e-39 | 8.25e-01 | 0.34 |
| Page: 1 2 3 4 5 6 7 8 |
| Tissue | Expression Dynamics | Abbreviation |
| Cervix |  | CC: Cervix cancer |
| HSIL_HPV: HPV-infected high-grade squamous intraepithelial lesions | ||
| N_HPV: HPV-infected normal cervix | ||
| Endometrium | 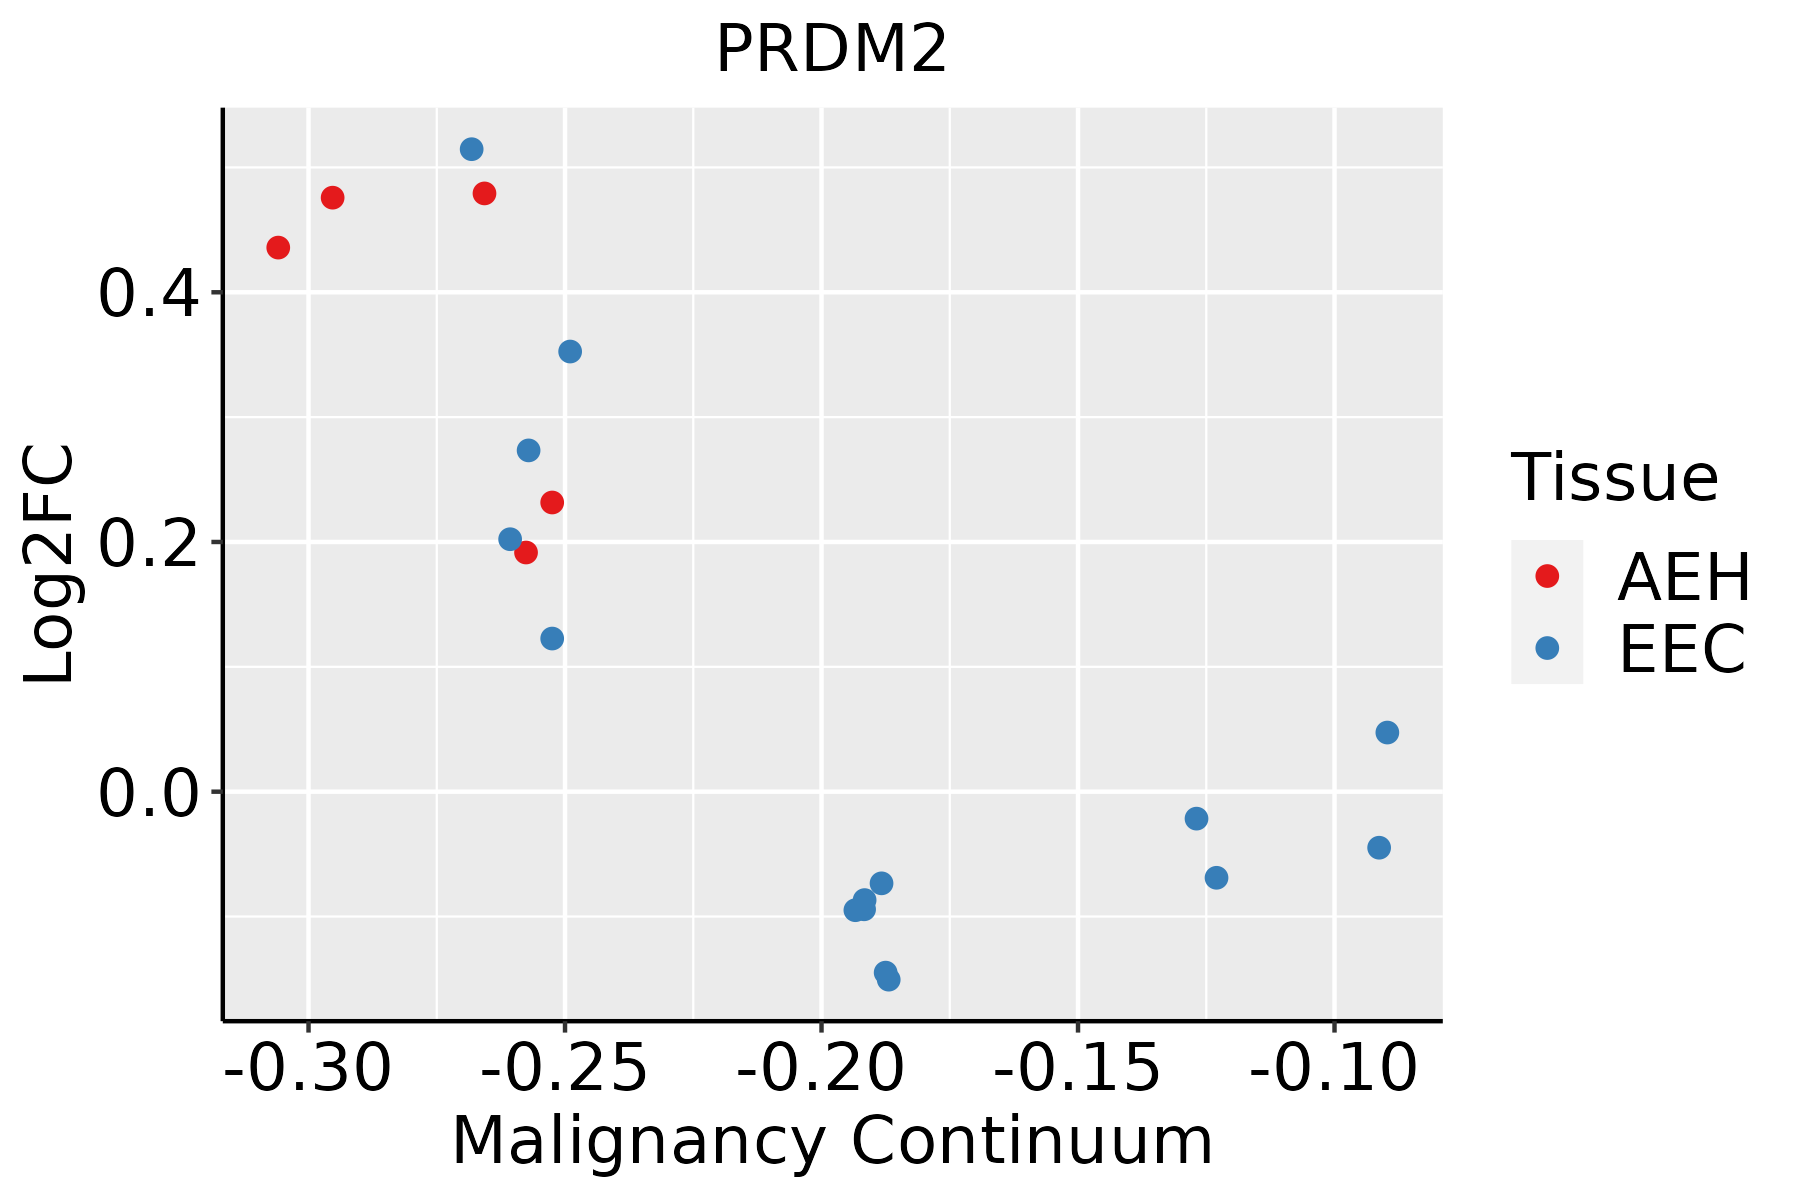 | AEH: Atypical endometrial hyperplasia |
| EEC: Endometrioid Cancer | ||
| Esophagus | 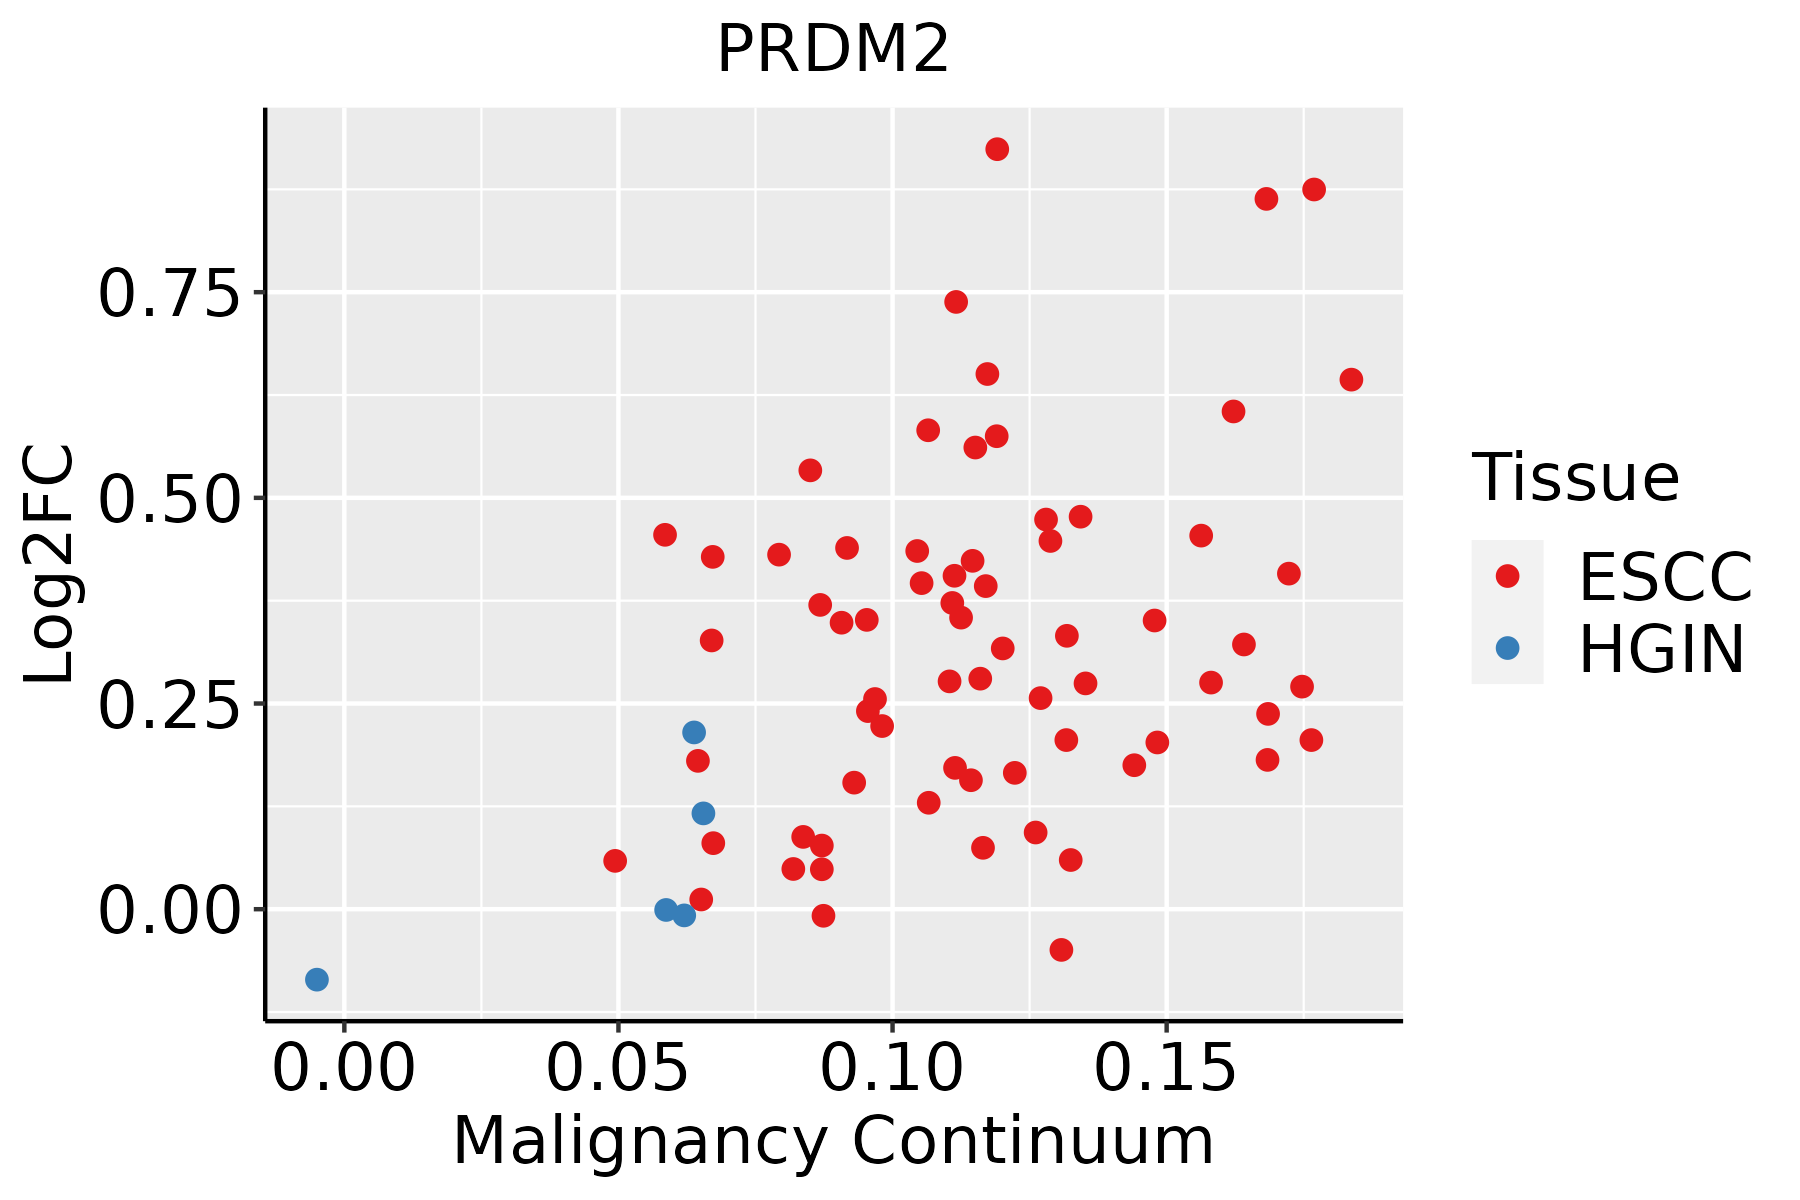 | ESCC: Esophageal squamous cell carcinoma |
| HGIN: High-grade intraepithelial neoplasias | ||
| LGIN: Low-grade intraepithelial neoplasias | ||
| Liver | 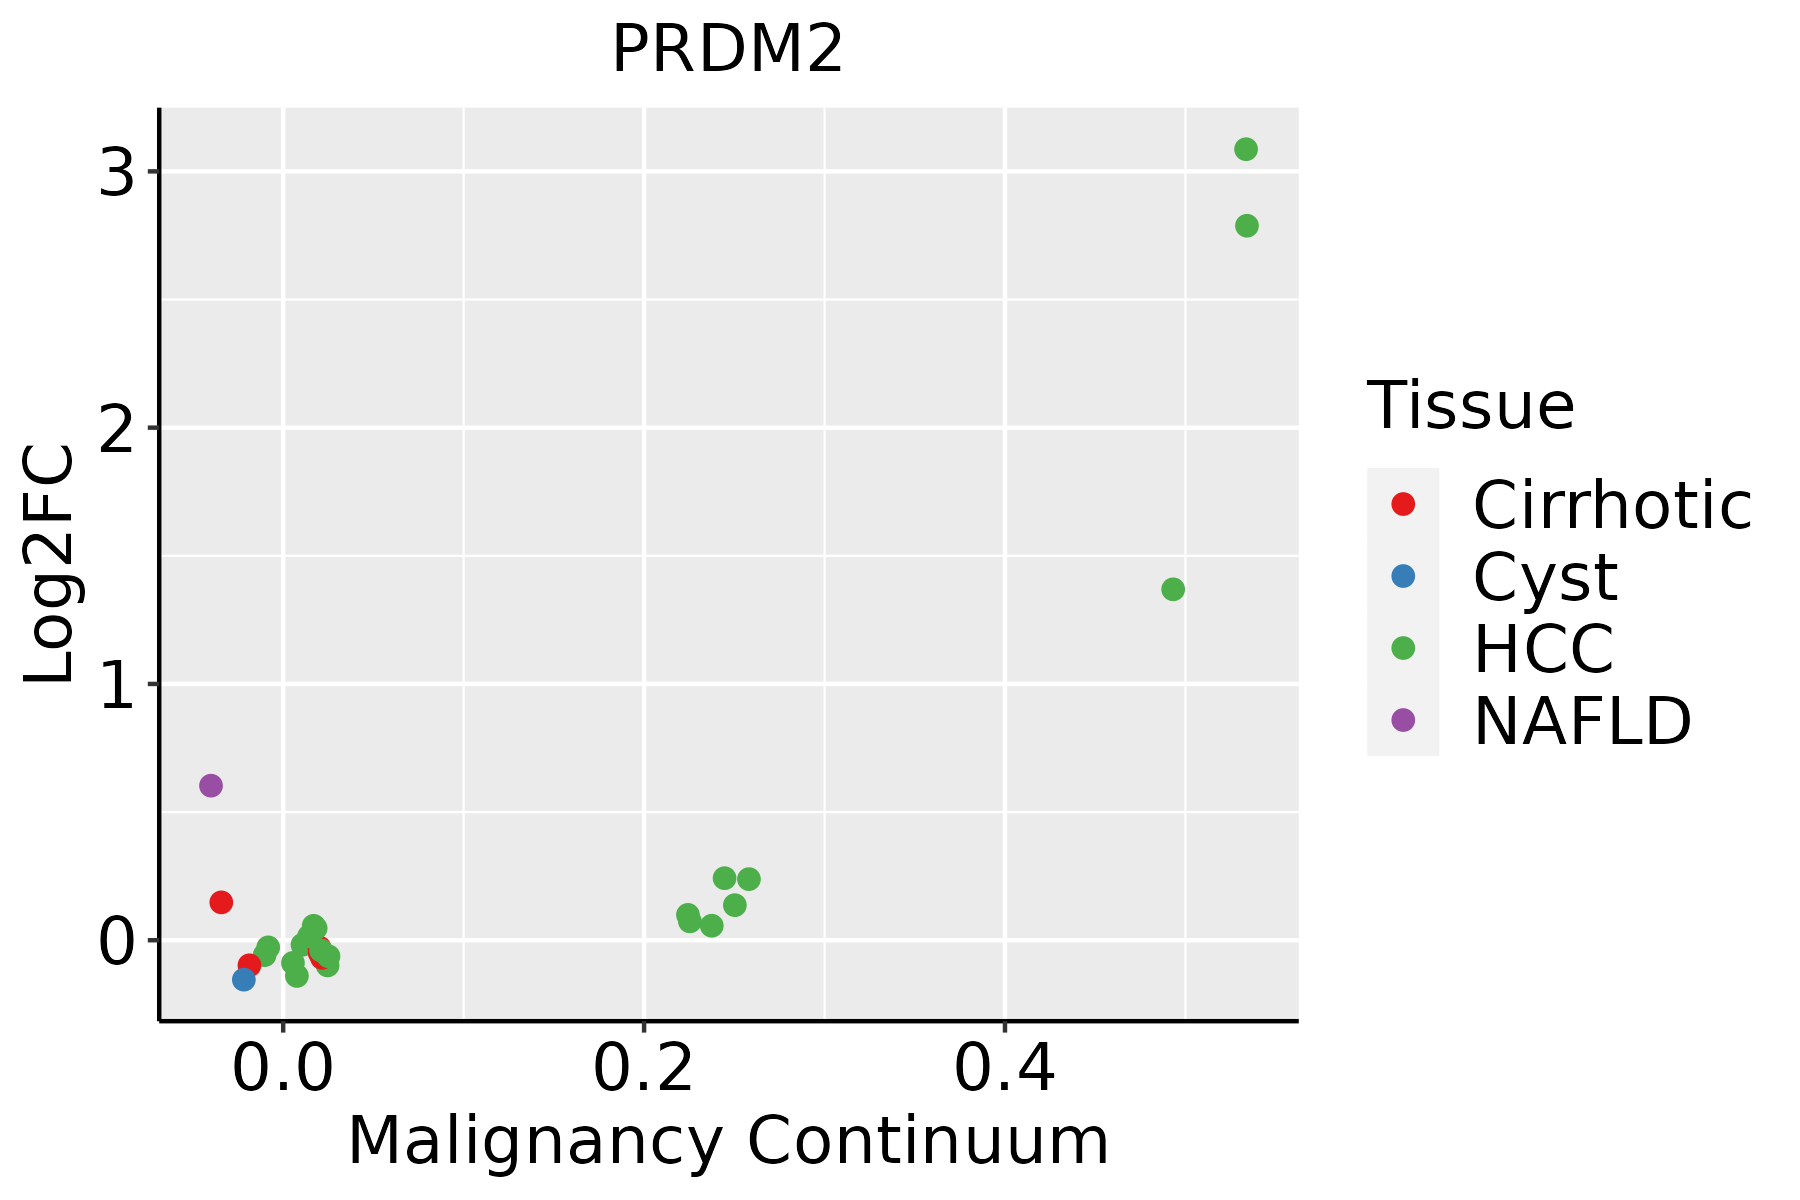 | HCC: Hepatocellular carcinoma |
| NAFLD: Non-alcoholic fatty liver disease | ||
| Lung | 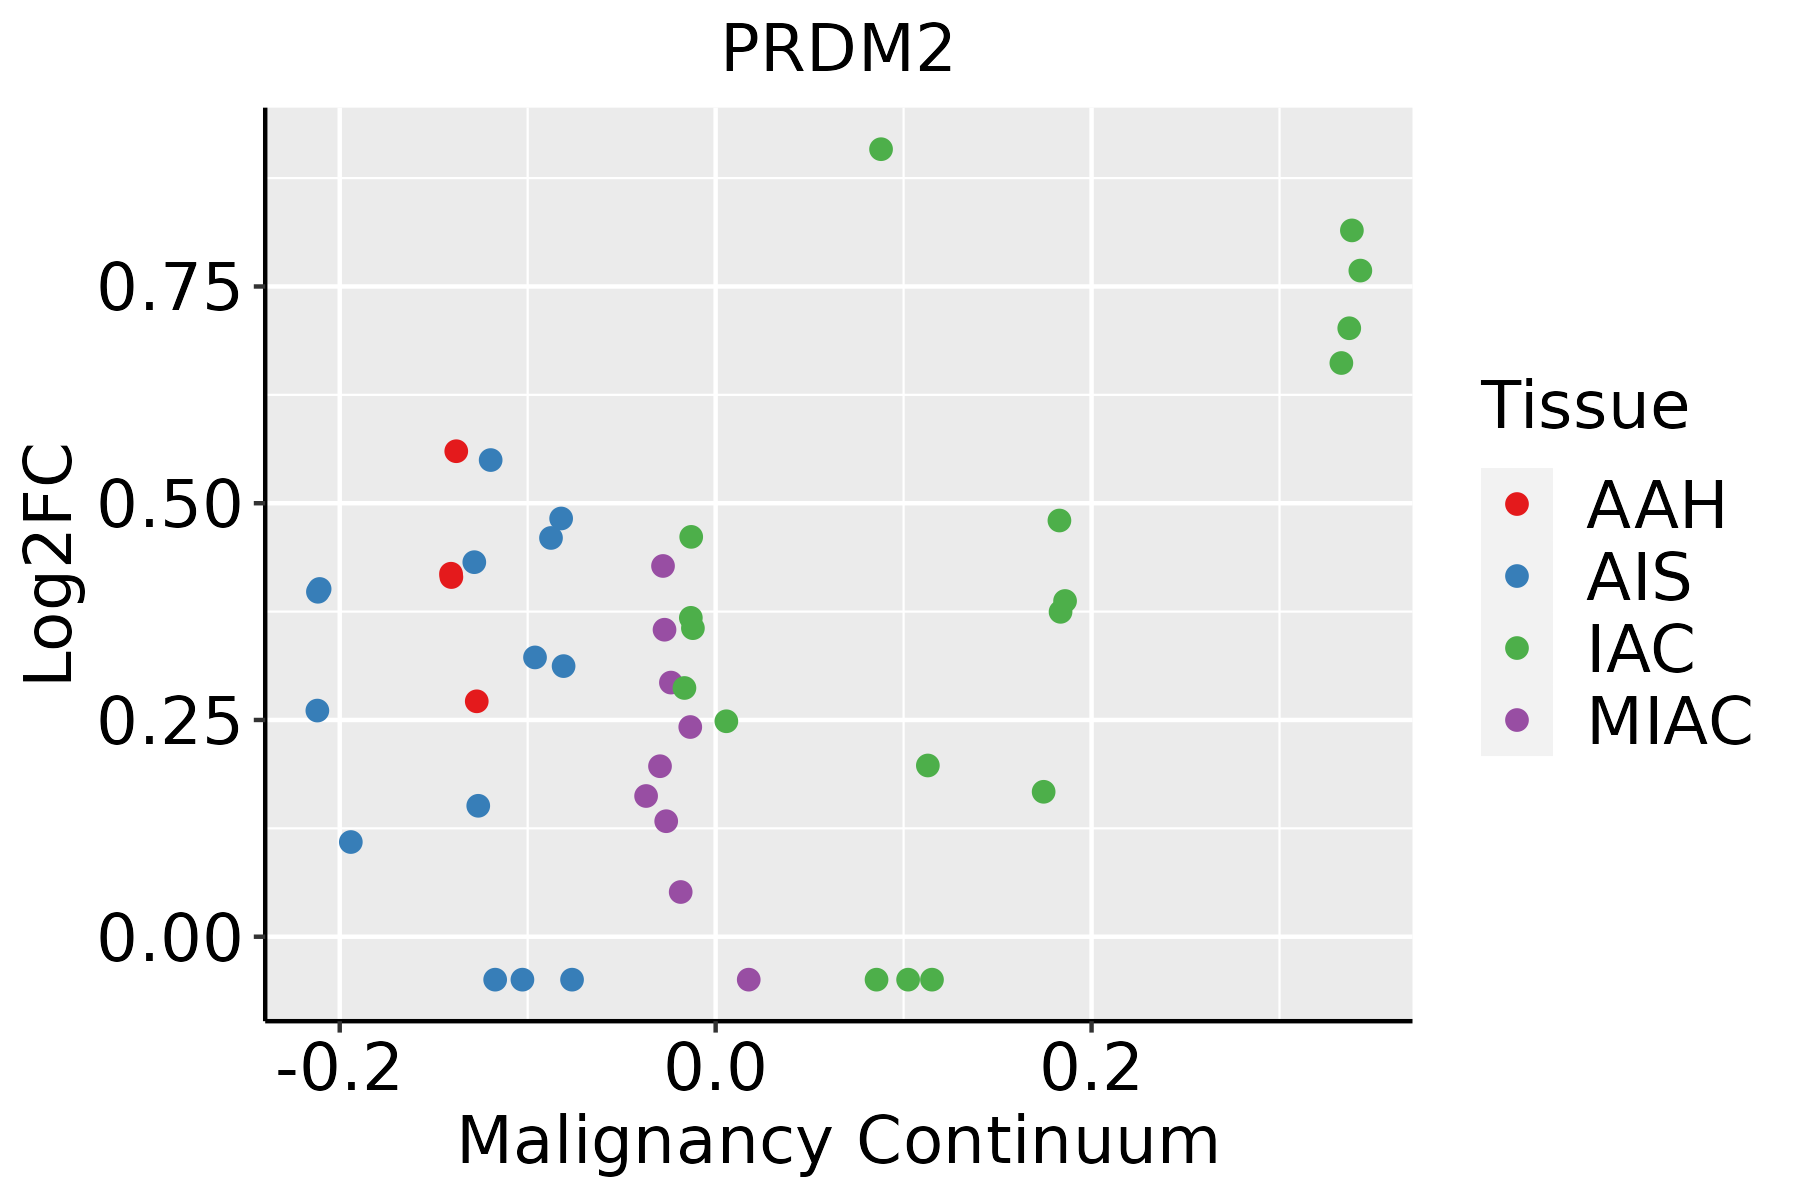 | AAH: Atypical adenomatous hyperplasia |
| AIS: Adenocarcinoma in situ | ||
| IAC: Invasive lung adenocarcinoma | ||
| MIA: Minimally invasive adenocarcinoma | ||
| Oral Cavity |  | EOLP: Erosive Oral lichen planus |
| LP: leukoplakia | ||
| NEOLP: Non-erosive oral lichen planus | ||
| OSCC: Oral squamous cell carcinoma | ||
| Prostate | 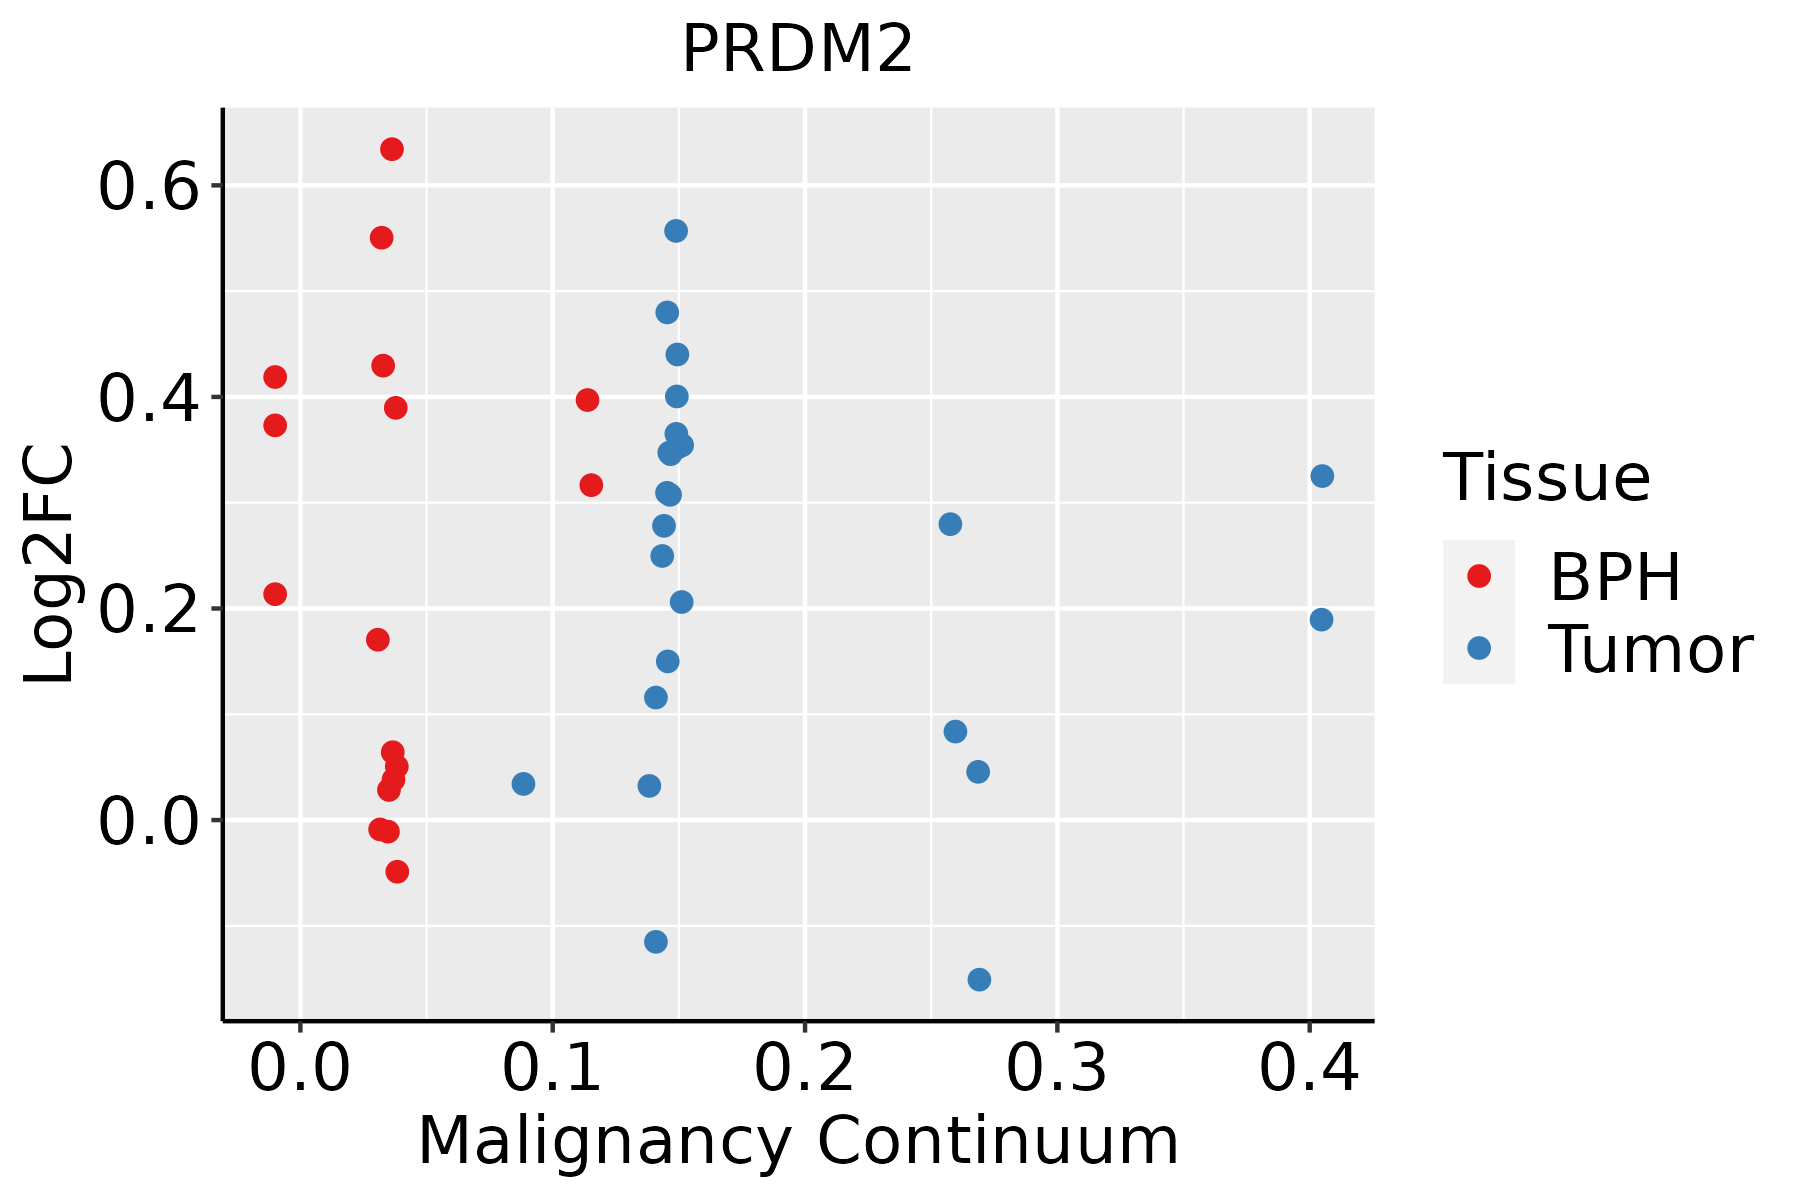 | BPH: Benign Prostatic Hyperplasia |
| Skin |  | AK: Actinic keratosis |
| cSCC: Cutaneous squamous cell carcinoma | ||
| SCCIS:squamous cell carcinoma in situ | ||
| Thyroid |  | ATC: Anaplastic thyroid cancer |
| HT: Hashimoto's thyroiditis | ||
| PTC: Papillary thyroid cancer |
| ∗log2FC in expression of this searched gene in stem-like cells from each diseased tissue sample relative to stem-like cells in normal samples in each tissue plotted against the malignancy continuum. Samples are colored based on if they are from different disease stage. |
Top |
Malignant transformation related pathway analysis |
| Find out the enriched GO biological processes and KEGG pathways involved in transition from healthy to precancer to cancer |
| Tissue | Disease Stage | Enriched GO biological Processes |
| Colorectum | AD |  |
| Colorectum | SER |  |
| Colorectum | MSS |  |
| Colorectum | MSI-H |  |
| Colorectum | FAP |  |
| ∗Top 15 enriched GO BP terms are showed in the bar plot of each disease state in each tissue. Each row represents a significant GO biological process which is colored according to the -log10(p.adjust). |
| Page: 1 2 3 4 5 6 7 8 9 |
| GO ID | Tissue | Disease Stage | Description | Gene Ratio | Bg Ratio | pvalue | p.adjust | Count |
| GO:00075689 | Cervix | CC | aging | 75/2311 | 339/18723 | 2.75e-07 | 1.13e-05 | 75 |
| GO:00165705 | Cervix | CC | histone modification | 84/2311 | 463/18723 | 1.70e-04 | 2.01e-03 | 84 |
| GO:00165715 | Cervix | CC | histone methylation | 30/2311 | 141/18723 | 1.88e-03 | 1.39e-02 | 30 |
| GO:00064795 | Cervix | CC | protein methylation | 36/2311 | 181/18723 | 2.46e-03 | 1.71e-02 | 36 |
| GO:00082135 | Cervix | CC | protein alkylation | 36/2311 | 181/18723 | 2.46e-03 | 1.71e-02 | 36 |
| GO:000756810 | Endometrium | AEH | aging | 59/2100 | 339/18723 | 4.00e-04 | 4.28e-03 | 59 |
| GO:000756815 | Endometrium | EEC | aging | 66/2168 | 339/18723 | 1.46e-05 | 2.87e-04 | 66 |
| GO:001657015 | Esophagus | ESCC | histone modification | 323/8552 | 463/18723 | 2.61e-26 | 7.88e-24 | 323 |
| GO:00434143 | Esophagus | ESCC | macromolecule methylation | 199/8552 | 316/18723 | 3.44e-10 | 9.57e-09 | 199 |
| GO:00322592 | Esophagus | ESCC | methylation | 222/8552 | 364/18723 | 2.26e-09 | 5.09e-08 | 222 |
| GO:000756820 | Esophagus | ESCC | aging | 201/8552 | 339/18723 | 2.64e-07 | 3.94e-06 | 201 |
| GO:000647914 | Esophagus | ESCC | protein methylation | 115/8552 | 181/18723 | 9.07e-07 | 1.16e-05 | 115 |
| GO:000821314 | Esophagus | ESCC | protein alkylation | 115/8552 | 181/18723 | 9.07e-07 | 1.16e-05 | 115 |
| GO:00165718 | Esophagus | ESCC | histone methylation | 89/8552 | 141/18723 | 2.17e-05 | 1.87e-04 | 89 |
| GO:00165703 | Liver | NAFLD | histone modification | 90/1882 | 463/18723 | 5.74e-10 | 1.28e-07 | 90 |
| GO:00165713 | Liver | NAFLD | histone methylation | 29/1882 | 141/18723 | 1.40e-04 | 2.63e-03 | 29 |
| GO:00064793 | Liver | NAFLD | protein methylation | 33/1882 | 181/18723 | 5.36e-04 | 7.35e-03 | 33 |
| GO:00082133 | Liver | NAFLD | protein alkylation | 33/1882 | 181/18723 | 5.36e-04 | 7.35e-03 | 33 |
| GO:00075687 | Liver | NAFLD | aging | 53/1882 | 339/18723 | 7.78e-04 | 9.77e-03 | 53 |
| GO:0043414 | Liver | NAFLD | macromolecule methylation | 47/1882 | 316/18723 | 4.08e-03 | 3.41e-02 | 47 |
| Page: 1 2 3 4 5 |
| Pathway ID | Tissue | Disease Stage | Description | Gene Ratio | Bg Ratio | pvalue | p.adjust | qvalue | Count |
| hsa0031010 | Esophagus | ESCC | Lysine degradation | 41/4205 | 63/8465 | 9.63e-03 | 2.27e-02 | 1.16e-02 | 41 |
| hsa0031013 | Esophagus | ESCC | Lysine degradation | 41/4205 | 63/8465 | 9.63e-03 | 2.27e-02 | 1.16e-02 | 41 |
| hsa003108 | Liver | NAFLD | Lysine degradation | 21/1043 | 63/8465 | 1.09e-05 | 3.58e-04 | 2.89e-04 | 21 |
| hsa0031011 | Liver | NAFLD | Lysine degradation | 21/1043 | 63/8465 | 1.09e-05 | 3.58e-04 | 2.89e-04 | 21 |
| hsa0031041 | Liver | HCC | Lysine degradation | 47/4020 | 63/8465 | 1.02e-05 | 7.58e-05 | 4.22e-05 | 47 |
| hsa0031051 | Liver | HCC | Lysine degradation | 47/4020 | 63/8465 | 1.02e-05 | 7.58e-05 | 4.22e-05 | 47 |
| hsa003109 | Lung | IAC | Lysine degradation | 17/1053 | 63/8465 | 1.35e-03 | 8.63e-03 | 5.73e-03 | 17 |
| hsa0031012 | Lung | IAC | Lysine degradation | 17/1053 | 63/8465 | 1.35e-03 | 8.63e-03 | 5.73e-03 | 17 |
| hsa0031022 | Lung | AIS | Lysine degradation | 16/961 | 63/8465 | 1.41e-03 | 9.49e-03 | 6.07e-03 | 16 |
| hsa0031032 | Lung | AIS | Lysine degradation | 16/961 | 63/8465 | 1.41e-03 | 9.49e-03 | 6.07e-03 | 16 |
| Page: 1 |
Top |
Cell-cell communication analysis |
| Identification of potential cell-cell interactions between two cell types and their ligand-receptor pairs for different disease states |
| Ligand | Receptor | LRpair | Pathway | Tissue | Disease Stage |
| Page: 1 |
Top |
Single-cell gene regulatory network inference analysis |
| Find out the significant the regulons (TFs) and the target genes of each regulon across cell types for different disease states |
| TF | Cell Type | Tissue | Disease Stage | Target Gene | RSS | Regulon Activity |
| ∗The dot plots of a searched regulon are shown for all cell subpopulations in each disease state of each tissue based on the regulon specific score inferred using pySCENIC and by calculating the average expression. |
| Page: 1 |
Top |
Somatic mutation of malignant transformation related genes |
| Annotation of somatic variants for genes involved in malignant transformation |
| Hugo Symbol | Variant Class | Variant Classification | dbSNP RS | HGVSc | HGVSp | HGVSp Short | SWISSPROT | BIOTYPE | SIFT | PolyPhen | Tumor Sample Barcode | Tissue | Histology | Sex | Age | Stage | Therapy Types | Drugs | Outcome |
| PRDM2 | SNV | Missense_Mutation | c.1294N>A | p.Asp432Asn | p.D432N | Q13029 | protein_coding | tolerated(0.12) | benign(0) | TCGA-A2-A0EQ-01 | Breast | breast invasive carcinoma | Female | <65 | I/II | Chemotherapy | adriamycin | SD | |
| PRDM2 | SNV | Missense_Mutation | c.3889N>T | p.Ser1297Cys | p.S1297C | Q13029 | protein_coding | deleterious(0) | probably_damaging(0.997) | TCGA-A8-A06X-01 | Breast | breast invasive carcinoma | Female | >=65 | I/II | Unknown | Unknown | SD | |
| PRDM2 | SNV | Missense_Mutation | c.4396N>C | p.Tyr1466His | p.Y1466H | Q13029 | protein_coding | deleterious(0) | probably_damaging(0.999) | TCGA-A8-A09Z-01 | Breast | breast invasive carcinoma | Female | >=65 | I/II | Unknown | Unknown | SD | |
| PRDM2 | SNV | Missense_Mutation | c.1567G>C | p.Glu523Gln | p.E523Q | Q13029 | protein_coding | tolerated(0.3) | possibly_damaging(0.857) | TCGA-AC-A23H-01 | Breast | breast invasive carcinoma | Female | >=65 | I/II | Unknown | Unknown | PD | |
| PRDM2 | SNV | Missense_Mutation | rs200363632 | c.2299N>A | p.Gly767Arg | p.G767R | Q13029 | protein_coding | tolerated(0.53) | benign(0.013) | TCGA-BH-A0HF-01 | Breast | breast invasive carcinoma | Female | >=65 | I/II | Hormone Therapy | arimidex | SD |
| PRDM2 | SNV | Missense_Mutation | c.994N>C | p.Glu332Gln | p.E332Q | Q13029 | protein_coding | tolerated(0.06) | possibly_damaging(0.715) | TCGA-D8-A1JA-01 | Breast | breast invasive carcinoma | Female | <65 | III/IV | Chemotherapy | adriamycin | PD | |
| PRDM2 | SNV | Missense_Mutation | c.4739G>A | p.Arg1580Lys | p.R1580K | Q13029 | protein_coding | tolerated(0.15) | benign(0.069) | TCGA-D8-A1XQ-01 | Breast | breast invasive carcinoma | Female | >=65 | I/II | Unknown | Unknown | SD | |
| PRDM2 | SNV | Missense_Mutation | novel | c.940N>A | p.Glu314Lys | p.E314K | Q13029 | protein_coding | tolerated_low_confidence(0.08) | possibly_damaging(0.901) | TCGA-PE-A5DD-01 | Breast | breast invasive carcinoma | Female | <65 | I/II | Chemotherapy | CR | |
| PRDM2 | insertion | Nonsense_Mutation | novel | c.5001_5002insACCTTTTCTTTCCATTAAA | p.Asp1668ThrfsTer6 | p.D1668Tfs*6 | Q13029 | protein_coding | TCGA-A8-A07W-01 | Breast | breast invasive carcinoma | Female | >=65 | III/IV | Hormone Therapy | exemestane | SD | ||
| PRDM2 | insertion | Frame_Shift_Ins | novel | c.5003_5004insTCTAACCAAA | p.Gly1669LeufsTer36 | p.G1669Lfs*36 | Q13029 | protein_coding | TCGA-A8-A07W-01 | Breast | breast invasive carcinoma | Female | >=65 | III/IV | Hormone Therapy | exemestane | SD |
| Page: 1 2 3 4 5 6 7 8 9 10 11 12 13 14 15 16 17 18 19 20 |
Top |
Related drugs of malignant transformation related genes |
| Identification of chemicals and drugs interact with genes involved in malignant transfromation |
| (DGIdb 4.0) |
| Entrez ID | Symbol | Category | Interaction Types | Drug Claim Name | Drug Name | PMIDs |
| Page: 1 |

Copyright 2023-Present -The University of Texas Health Science Center at Houston |