| Tissue | Expression Dynamics | Abbreviation |
| Cervix | 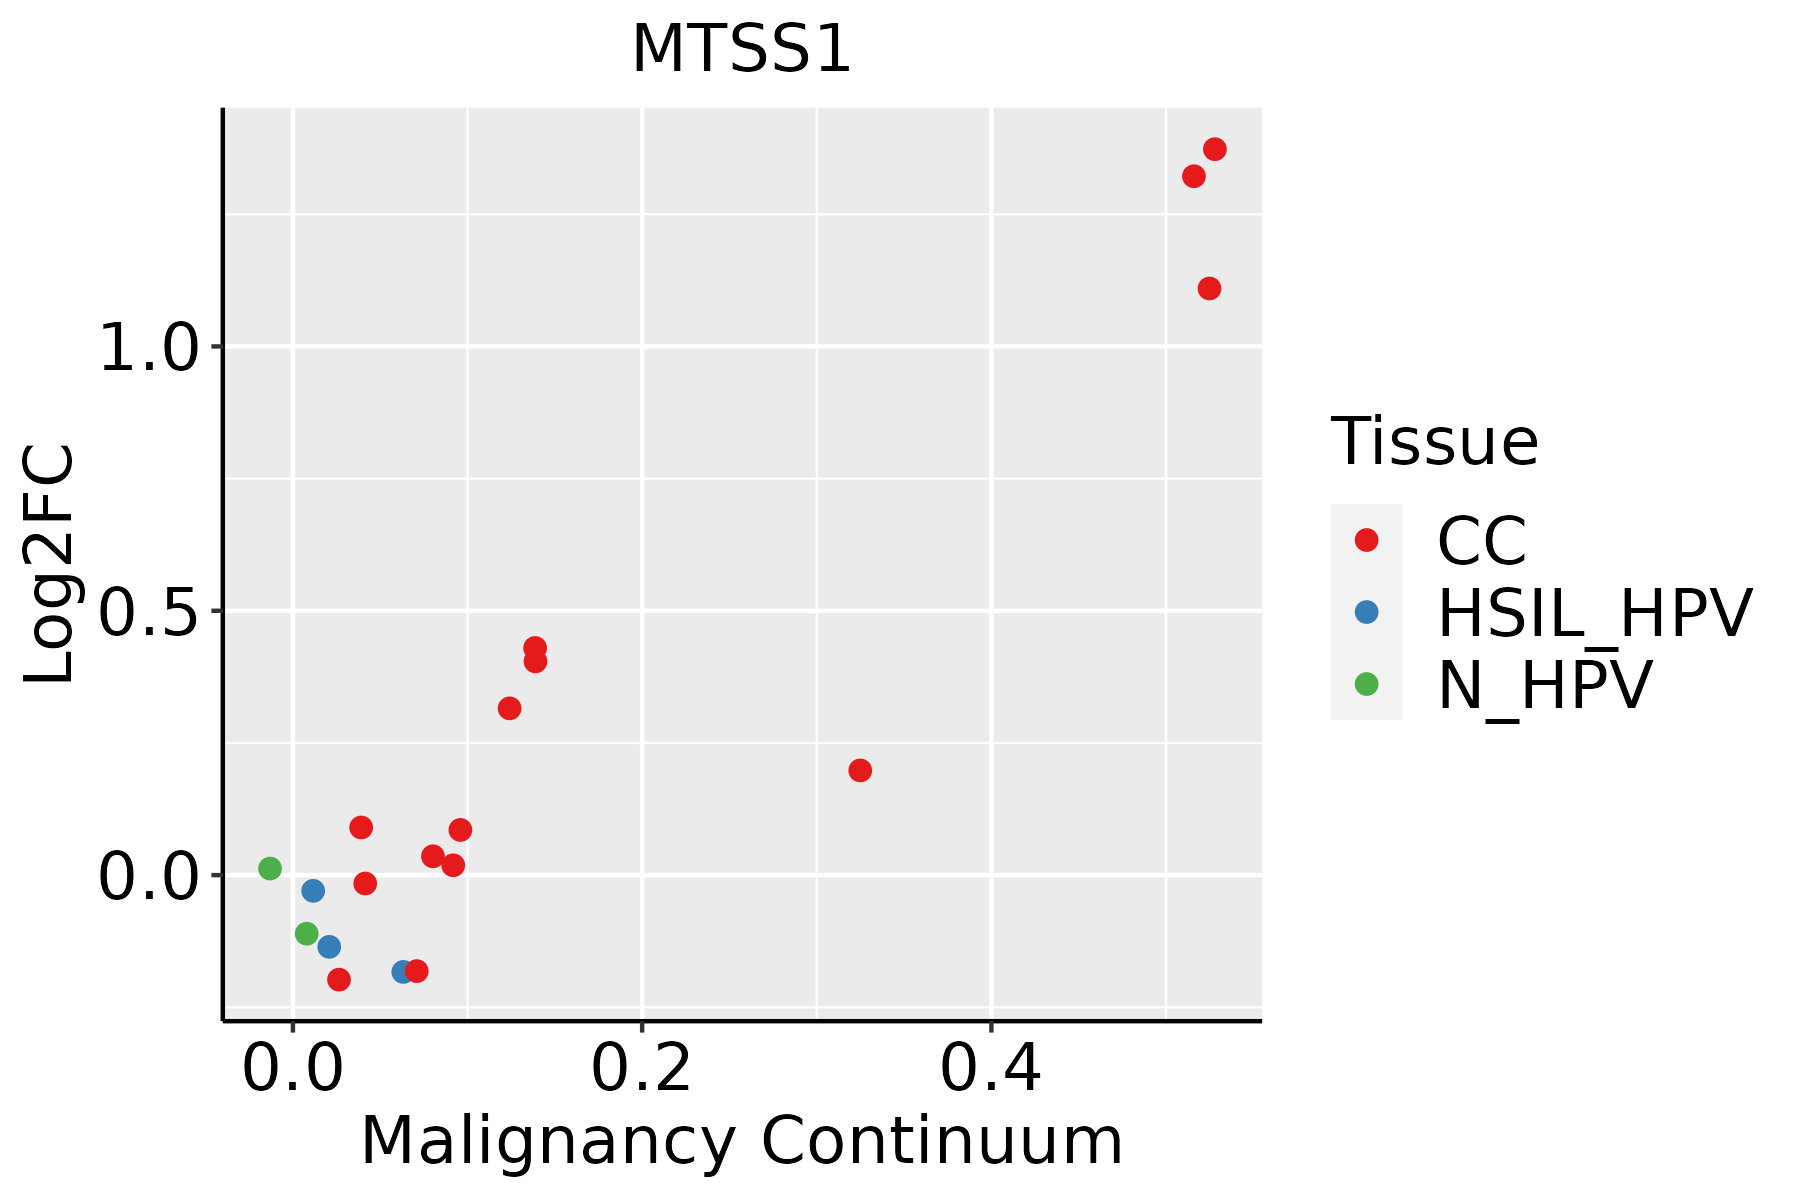 | CC: Cervix cancer |
| HSIL_HPV: HPV-infected high-grade squamous intraepithelial lesions |
| N_HPV: HPV-infected normal cervix |
| Colorectum (GSE201348) |  | FAP: Familial adenomatous polyposis |
| CRC: Colorectal cancer |
| Colorectum (HTA11) |  | AD: Adenomas |
| SER: Sessile serrated lesions |
| MSI-H: Microsatellite-high colorectal cancer |
| MSS: Microsatellite stable colorectal cancer |
| Endometrium |  | AEH: Atypical endometrial hyperplasia |
| EEC: Endometrioid Cancer |
| Esophagus | 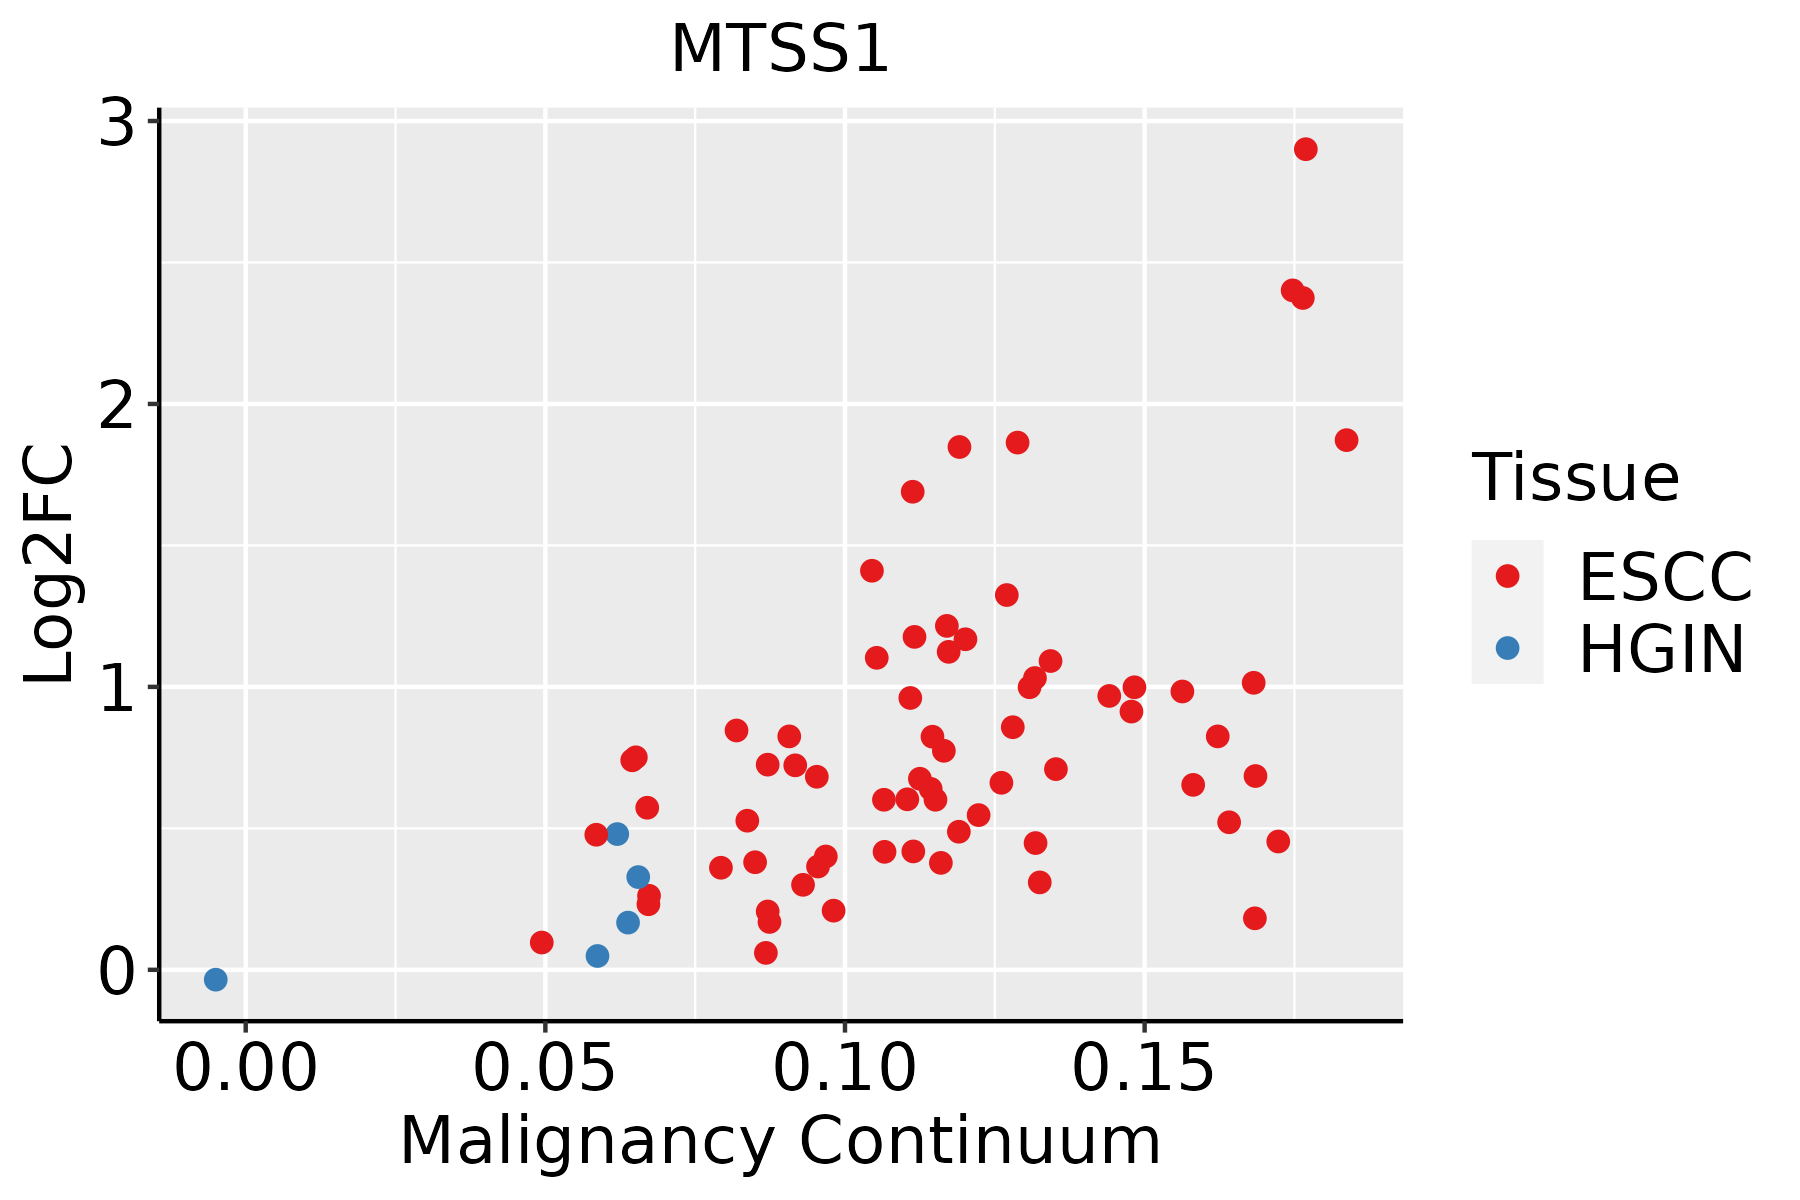 | ESCC: Esophageal squamous cell carcinoma |
| HGIN: High-grade intraepithelial neoplasias |
| LGIN: Low-grade intraepithelial neoplasias |
| Liver |  | HCC: Hepatocellular carcinoma |
| NAFLD: Non-alcoholic fatty liver disease |
| Lung | 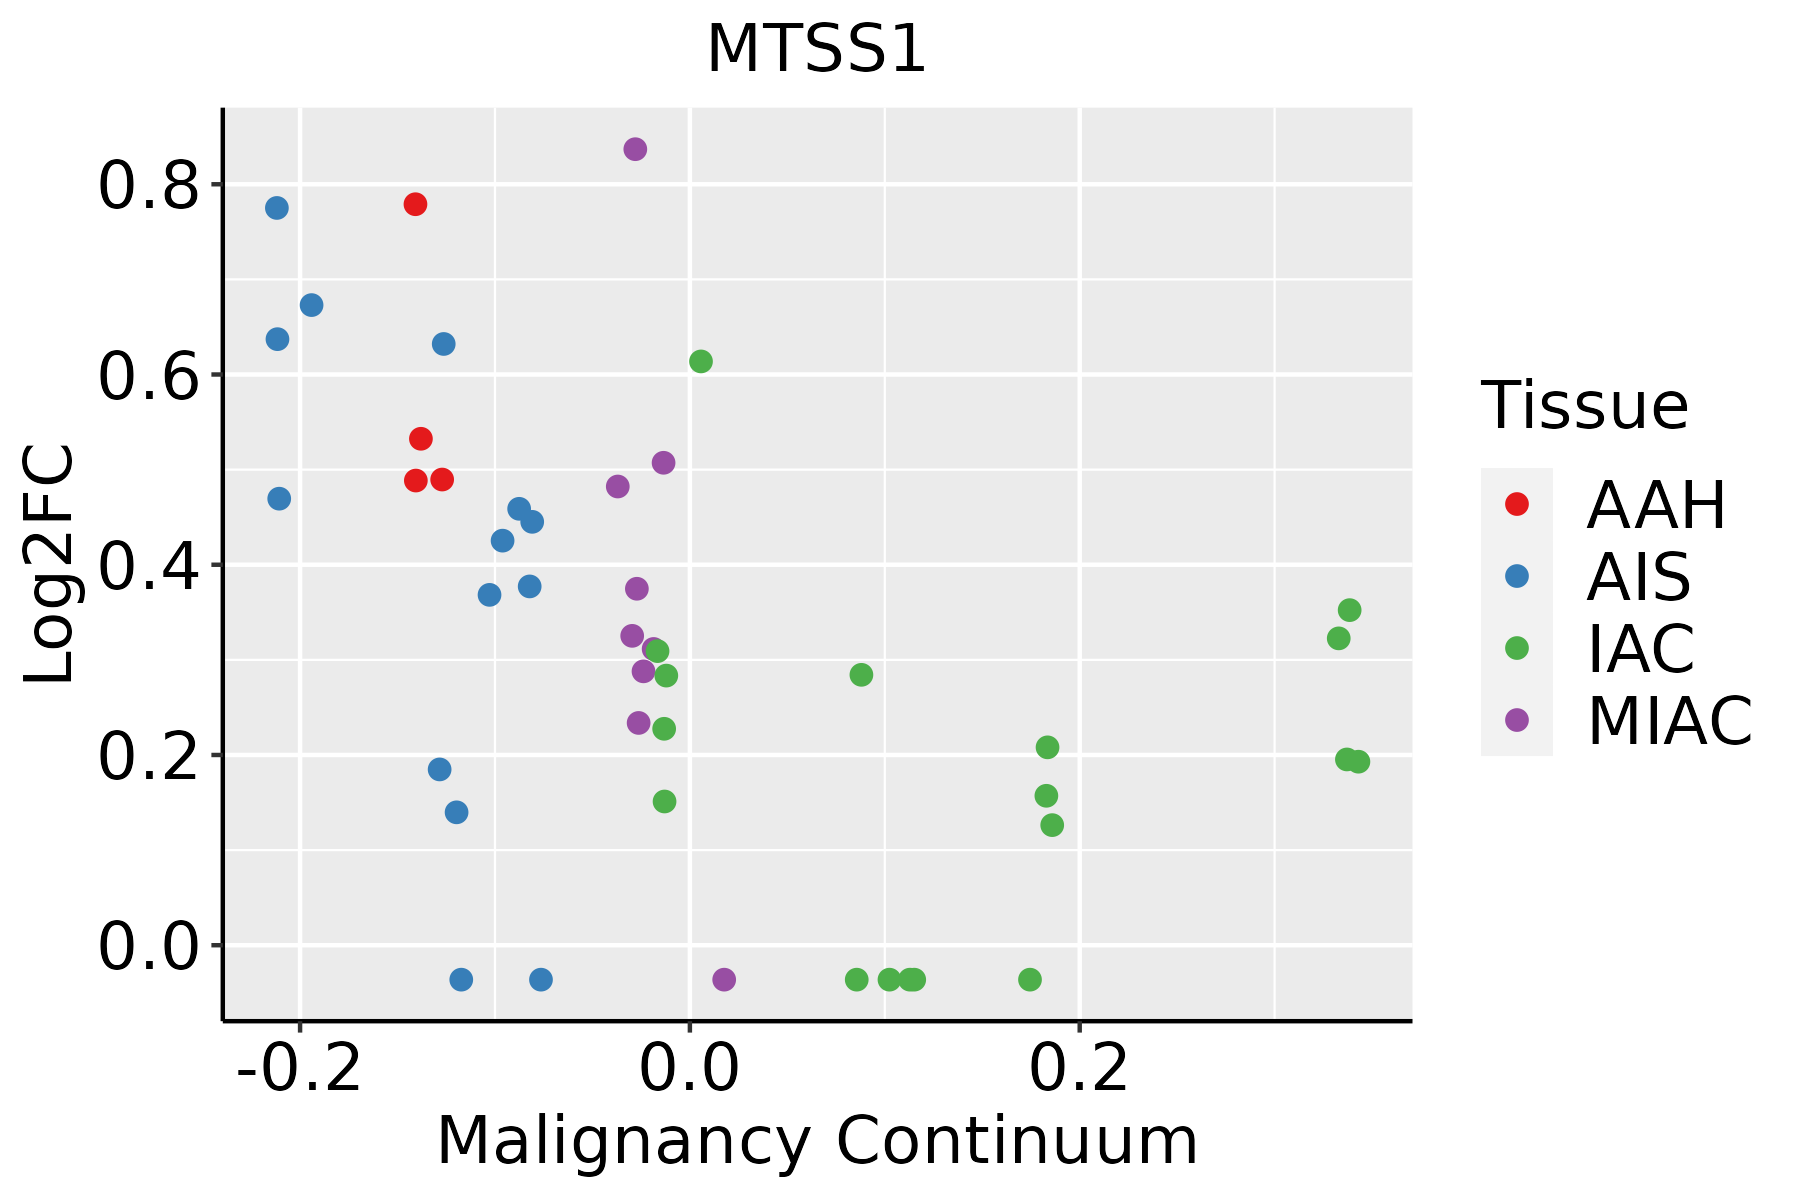 | AAH: Atypical adenomatous hyperplasia |
| AIS: Adenocarcinoma in situ |
| IAC: Invasive lung adenocarcinoma |
| MIA: Minimally invasive adenocarcinoma |
| Oral Cavity |  | EOLP: Erosive Oral lichen planus |
| LP: leukoplakia |
| NEOLP: Non-erosive oral lichen planus |
| OSCC: Oral squamous cell carcinoma |
| Prostate | 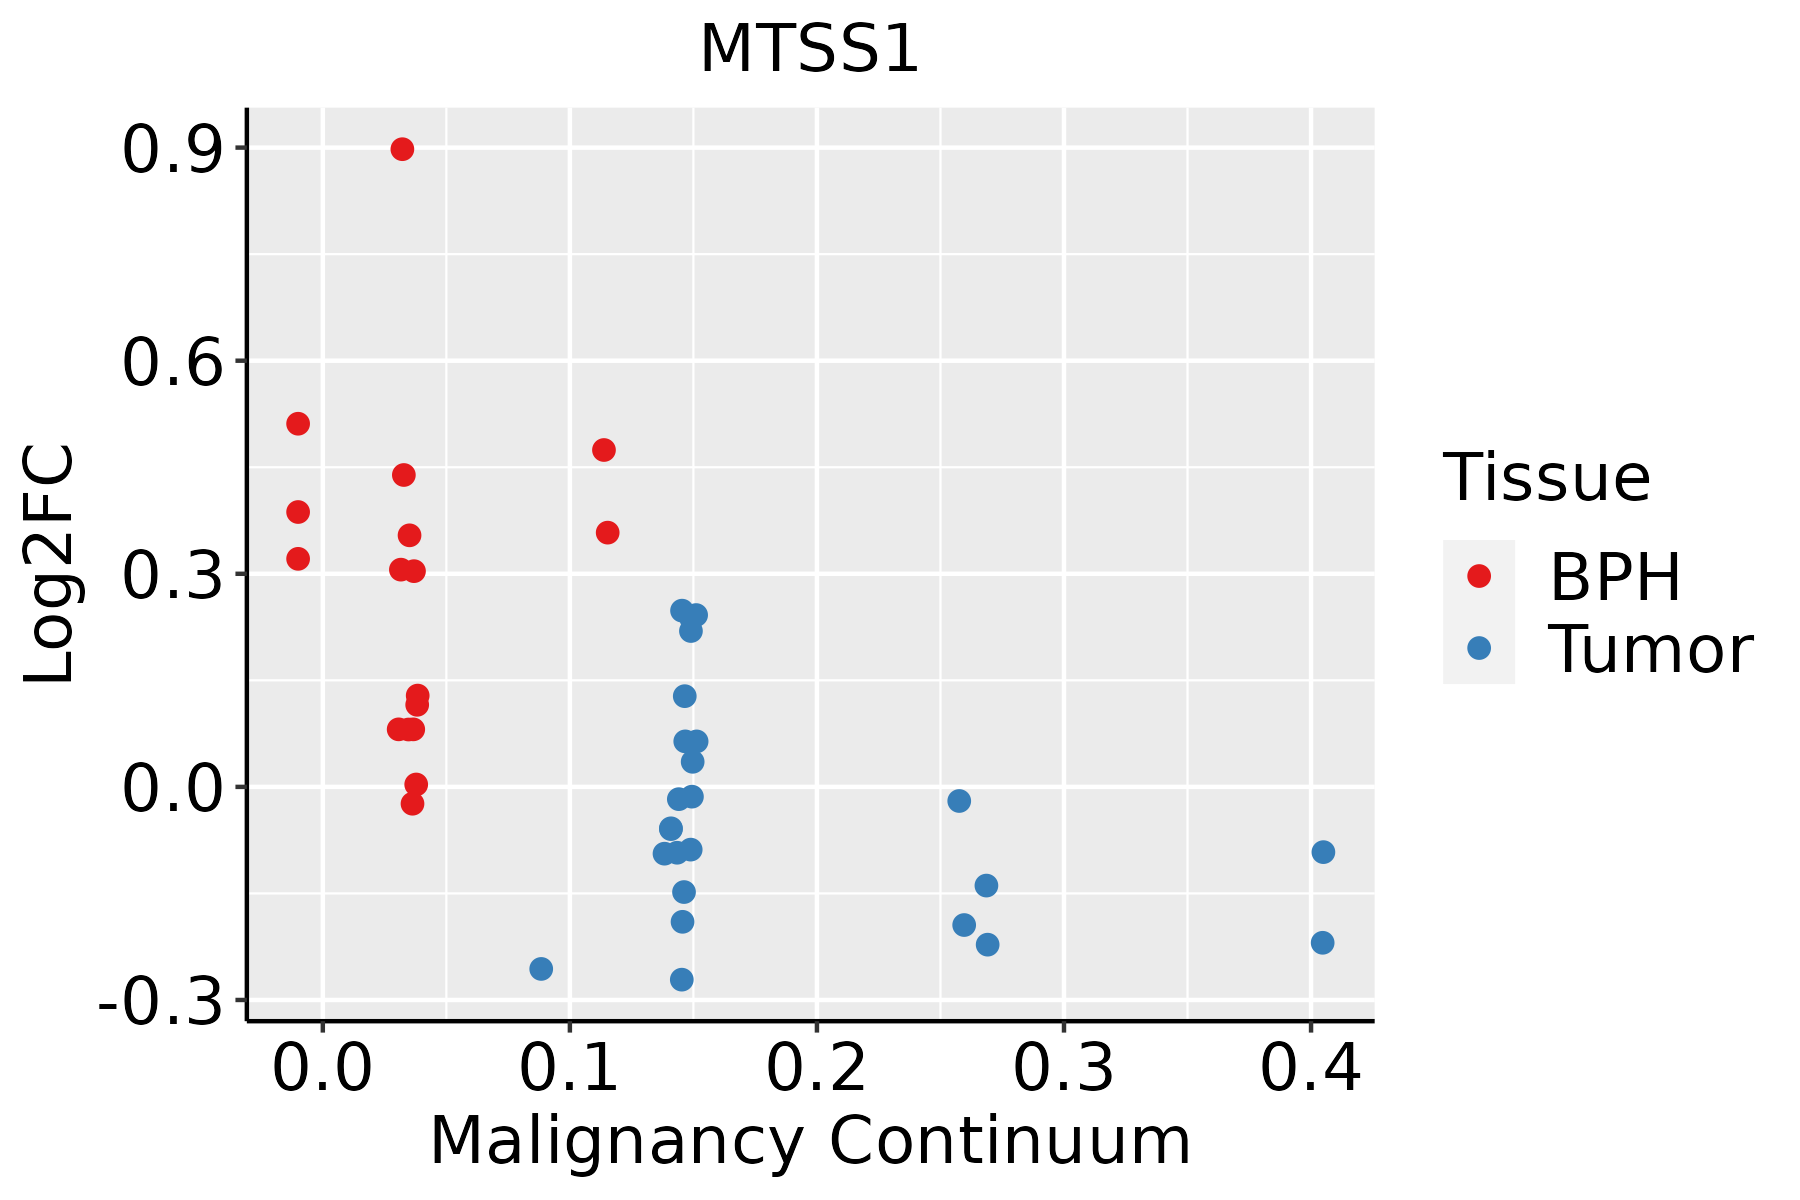 | BPH: Benign Prostatic Hyperplasia |
| Skin | 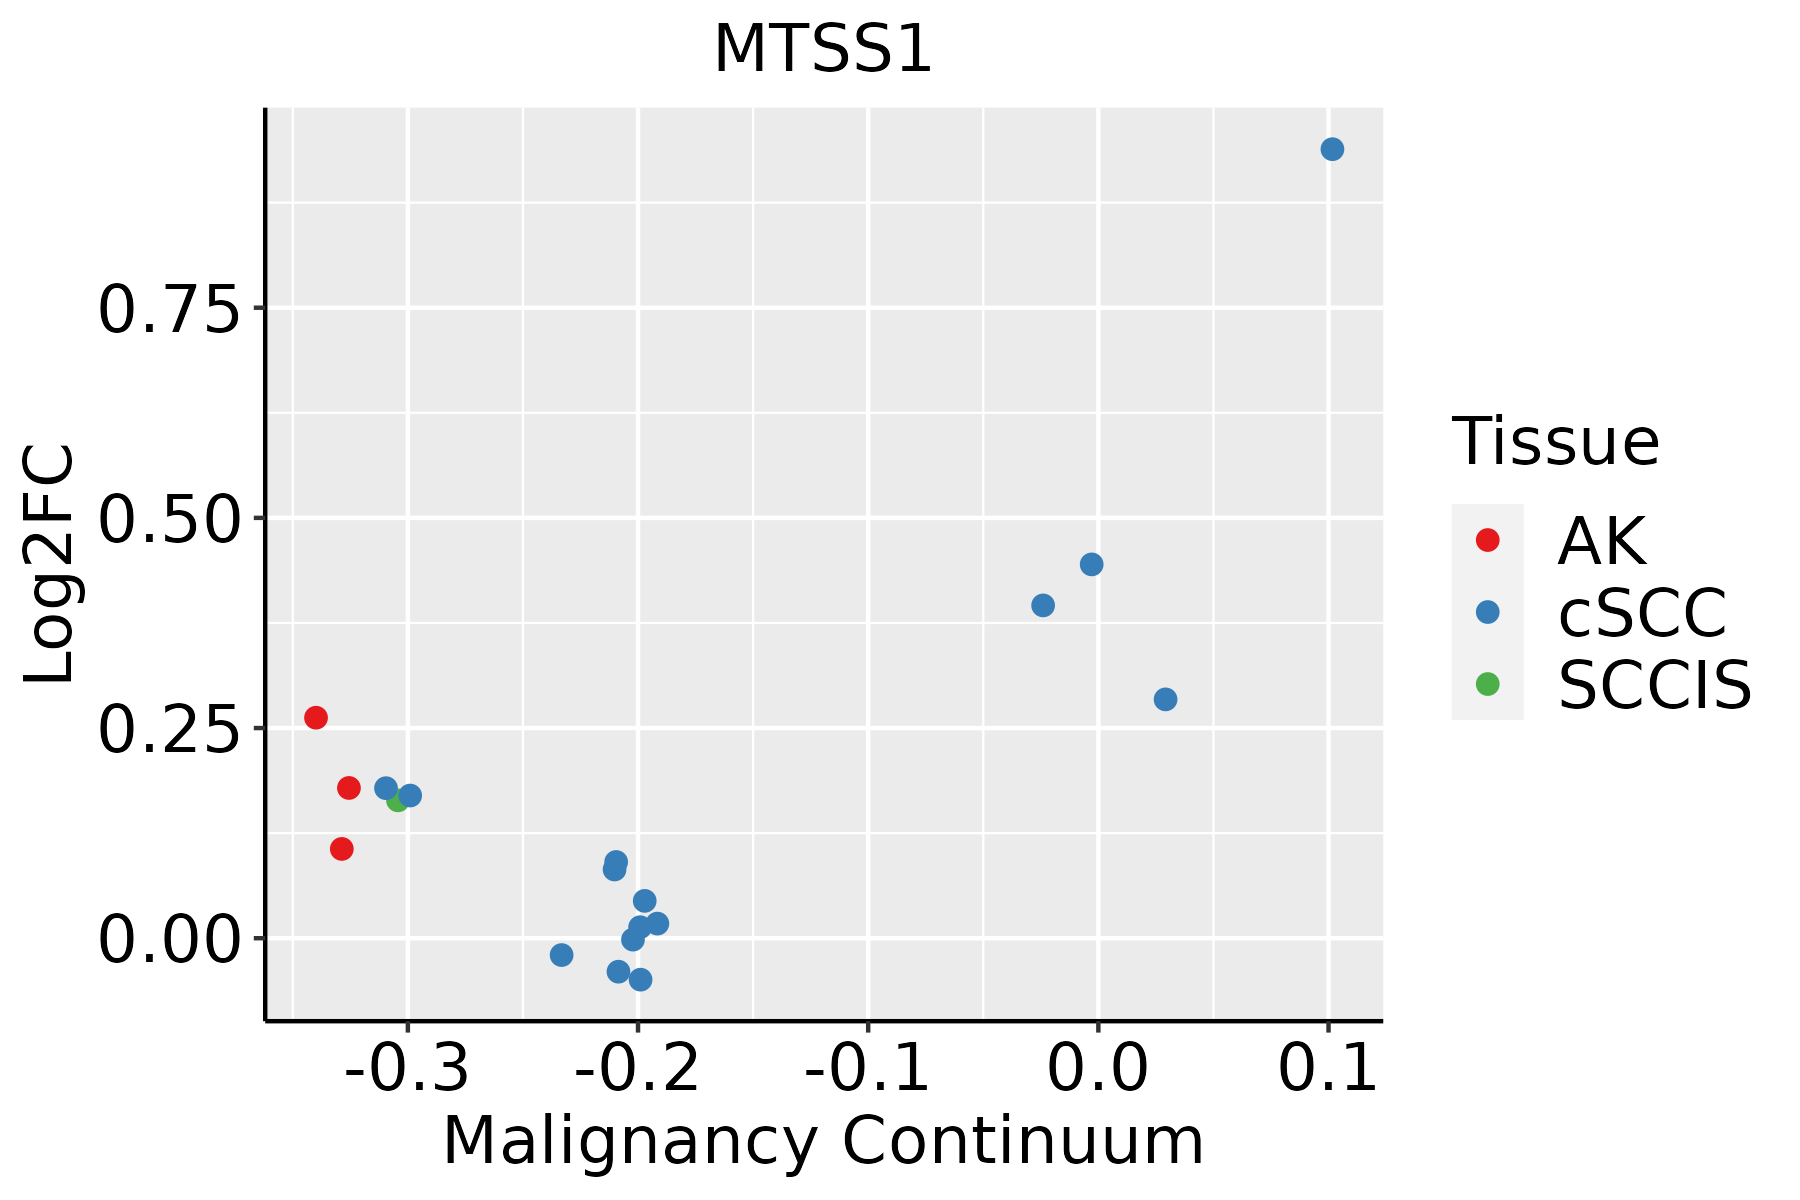 | AK: Actinic keratosis |
| cSCC: Cutaneous squamous cell carcinoma |
| SCCIS:squamous cell carcinoma in situ |
| Thyroid |  | ATC: Anaplastic thyroid cancer |
| HT: Hashimoto's thyroiditis |
| PTC: Papillary thyroid cancer |
| GO ID | Tissue | Disease Stage | Description | Gene Ratio | Bg Ratio | pvalue | p.adjust | Count |
| GO:000701510 | Cervix | CC | actin filament organization | 109/2311 | 442/18723 | 4.92e-13 | 2.45e-10 | 109 |
| GO:003297010 | Cervix | CC | regulation of actin filament-based process | 96/2311 | 397/18723 | 4.00e-11 | 8.54e-09 | 96 |
| GO:190290310 | Cervix | CC | regulation of supramolecular fiber organization | 92/2311 | 383/18723 | 1.49e-10 | 2.48e-08 | 92 |
| GO:003295610 | Cervix | CC | regulation of actin cytoskeleton organization | 86/2311 | 358/18723 | 5.90e-10 | 7.51e-08 | 86 |
| GO:00506737 | Cervix | CC | epithelial cell proliferation | 98/2311 | 437/18723 | 2.01e-09 | 2.15e-07 | 98 |
| GO:00452169 | Cervix | CC | cell-cell junction organization | 53/2311 | 200/18723 | 3.83e-08 | 2.53e-06 | 53 |
| GO:011005310 | Cervix | CC | regulation of actin filament organization | 67/2311 | 278/18723 | 4.01e-08 | 2.54e-06 | 67 |
| GO:00506787 | Cervix | CC | regulation of epithelial cell proliferation | 83/2311 | 381/18723 | 1.31e-07 | 6.42e-06 | 83 |
| GO:006157210 | Cervix | CC | actin filament bundle organization | 44/2311 | 161/18723 | 2.08e-07 | 9.34e-06 | 44 |
| GO:005101710 | Cervix | CC | actin filament bundle assembly | 43/2311 | 157/18723 | 2.66e-07 | 1.12e-05 | 43 |
| GO:190290510 | Cervix | CC | positive regulation of supramolecular fiber organization | 50/2311 | 209/18723 | 2.55e-06 | 7.54e-05 | 50 |
| GO:005149510 | Cervix | CC | positive regulation of cytoskeleton organization | 50/2311 | 226/18723 | 2.53e-05 | 4.29e-04 | 50 |
| GO:003223110 | Cervix | CC | regulation of actin filament bundle assembly | 28/2311 | 105/18723 | 5.19e-05 | 7.79e-04 | 28 |
| GO:00322339 | Cervix | CC | positive regulation of actin filament bundle assembly | 18/2311 | 63/18723 | 4.39e-04 | 4.39e-03 | 18 |
| GO:00605626 | Cervix | CC | epithelial tube morphogenesis | 57/2311 | 325/18723 | 3.79e-03 | 2.41e-02 | 57 |
| GO:00343326 | Cervix | CC | adherens junction organization | 13/2311 | 49/18723 | 5.34e-03 | 3.10e-02 | 13 |
| GO:00070092 | Cervix | CC | plasma membrane organization | 28/2311 | 142/18723 | 7.85e-03 | 4.14e-02 | 28 |
| GO:00343316 | Cervix | CC | cell junction maintenance | 10/2311 | 35/18723 | 7.99e-03 | 4.18e-02 | 10 |
| GO:00344051 | Cervix | CC | response to fluid shear stress | 10/2311 | 35/18723 | 7.99e-03 | 4.18e-02 | 10 |
| GO:00714983 | Cervix | CC | cellular response to fluid shear stress | 7/2311 | 21/18723 | 1.04e-02 | 4.97e-02 | 7 |
| Hugo Symbol | Variant Class | Variant Classification | dbSNP RS | HGVSc | HGVSp | HGVSp Short | SWISSPROT | BIOTYPE | SIFT | PolyPhen | Tumor Sample Barcode | Tissue | Histology | Sex | Age | Stage | Therapy Types | Drugs | Outcome |
| MTSS1 | SNV | Missense_Mutation | | c.923C>G | p.Ser308Cys | p.S308C | O43312 | protein_coding | tolerated(0.11) | probably_damaging(1) | TCGA-A2-A0YH-01 | Breast | breast invasive carcinoma | Female | <65 | III/IV | Chemotherapy | adriamycin | SD |
| MTSS1 | SNV | Missense_Mutation | | c.294C>A | p.Ser98Arg | p.S98R | O43312 | protein_coding | tolerated(0.06) | probably_damaging(0.988) | TCGA-A8-A07R-01 | Breast | breast invasive carcinoma | Female | >=65 | III/IV | Ancillary | zoledronic | SD |
| MTSS1 | SNV | Missense_Mutation | | c.1084N>A | p.Glu362Lys | p.E362K | O43312 | protein_coding | tolerated(0.46) | benign(0.182) | TCGA-AC-A23H-01 | Breast | breast invasive carcinoma | Female | >=65 | I/II | Unknown | Unknown | PD |
| MTSS1 | SNV | Missense_Mutation | rs762528178 | c.1930N>T | p.Arg644Trp | p.R644W | O43312 | protein_coding | tolerated(0.18) | possibly_damaging(0.84) | TCGA-AR-A1AK-01 | Breast | breast invasive carcinoma | Female | >=65 | I/II | Hormone Therapy | anastrozole | SD |
| MTSS1 | SNV | Missense_Mutation | | c.252G>A | p.Met84Ile | p.M84I | O43312 | protein_coding | deleterious(0.03) | probably_damaging(0.993) | TCGA-AR-A250-01 | Breast | breast invasive carcinoma | Female | <65 | I/II | Chemotherapy | doxorubicin | SD |
| MTSS1 | SNV | Missense_Mutation | novel | c.1532N>T | p.Thr511Ile | p.T511I | O43312 | protein_coding | deleterious(0) | probably_damaging(1) | TCGA-BH-A0HF-01 | Breast | breast invasive carcinoma | Female | >=65 | I/II | Hormone Therapy | arimidex | SD |
| MTSS1 | SNV | Missense_Mutation | novel | c.1268N>C | p.Asp423Ala | p.D423A | O43312 | protein_coding | deleterious(0) | probably_damaging(1) | TCGA-BH-A204-01 | Breast | breast invasive carcinoma | Female | >=65 | I/II | Unknown | Unknown | SD |
| MTSS1 | SNV | Missense_Mutation | rs149780096 | c.1395N>A | p.Met465Ile | p.M465I | O43312 | protein_coding | tolerated(0.46) | benign(0.023) | TCGA-C8-A12T-01 | Breast | breast invasive carcinoma | Female | <65 | I/II | Unknown | Unknown | SD |
| MTSS1 | SNV | Missense_Mutation | novel | c.421N>G | p.Ser141Ala | p.S141A | O43312 | protein_coding | deleterious(0.01) | probably_damaging(0.998) | TCGA-S3-AA11-01 | Breast | breast invasive carcinoma | Female | >=65 | I/II | Hormone Therapy | letrozole | CR |
| MTSS1 | insertion | Nonsense_Mutation | novel | c.1292_1293insAAAAAATAATAATAAATAAA | p.Arg432LysfsTer6 | p.R432Kfs*6 | O43312 | protein_coding | | | TCGA-A7-A0CJ-01 | Breast | breast invasive carcinoma | Female | <65 | I/II | Chemotherapy | cytoxan | SD |


