
|
|||||
|
 | |
| |
| |
| |
| |
| |
|
Gene: MRPL37 |
Gene summary for MRPL37 |
| Gene information | Species | Human | Gene symbol | MRPL37 | Gene ID | 51253 |
| Gene name | mitochondrial ribosomal protein L37 | |
| Gene Alias | L2mt | |
| Cytomap | 1p32.3 | |
| Gene Type | protein-coding | GO ID | GO:0006412 | UniProtAcc | S4R369 |
Top |
Malignant transformation analysis |
| Identification of the aberrant gene expression in precancerous and cancerous lesions by comparing the gene expression of stem-like cells in diseased tissues with normal stem cells |
| Entrez ID | Symbol | Replicates | Species | Organ | Tissue | Adj P-value | Log2FC | Malignancy |
| 51253 | MRPL37 | male-WTA | Human | Thyroid | PTC | 1.77e-25 | 1.28e-01 | 0.1037 |
| 51253 | MRPL37 | PTC01 | Human | Thyroid | PTC | 5.84e-14 | 1.61e-01 | 0.1899 |
| 51253 | MRPL37 | PTC04 | Human | Thyroid | PTC | 1.19e-05 | 3.85e-02 | 0.1927 |
| 51253 | MRPL37 | PTC05 | Human | Thyroid | PTC | 1.69e-06 | 2.71e-01 | 0.2065 |
| 51253 | MRPL37 | PTC06 | Human | Thyroid | PTC | 6.55e-11 | 2.66e-01 | 0.2057 |
| 51253 | MRPL37 | PTC07 | Human | Thyroid | PTC | 3.21e-14 | 2.09e-01 | 0.2044 |
| 51253 | MRPL37 | ATC09 | Human | Thyroid | ATC | 6.56e-04 | 1.33e-01 | 0.2871 |
| 51253 | MRPL37 | ATC12 | Human | Thyroid | ATC | 4.31e-13 | 2.39e-01 | 0.34 |
| 51253 | MRPL37 | ATC13 | Human | Thyroid | ATC | 3.01e-22 | 6.10e-01 | 0.34 |
| 51253 | MRPL37 | ATC1 | Human | Thyroid | ATC | 1.52e-05 | 1.83e-01 | 0.2878 |
| 51253 | MRPL37 | ATC2 | Human | Thyroid | ATC | 1.64e-15 | 1.03e+00 | 0.34 |
| 51253 | MRPL37 | ATC4 | Human | Thyroid | ATC | 2.02e-17 | 3.43e-01 | 0.34 |
| 51253 | MRPL37 | ATC5 | Human | Thyroid | ATC | 2.00e-30 | 6.87e-01 | 0.34 |
| Page: 1 2 3 4 5 6 7 8 |
| Tissue | Expression Dynamics | Abbreviation |
| Colorectum (GSE201348) | 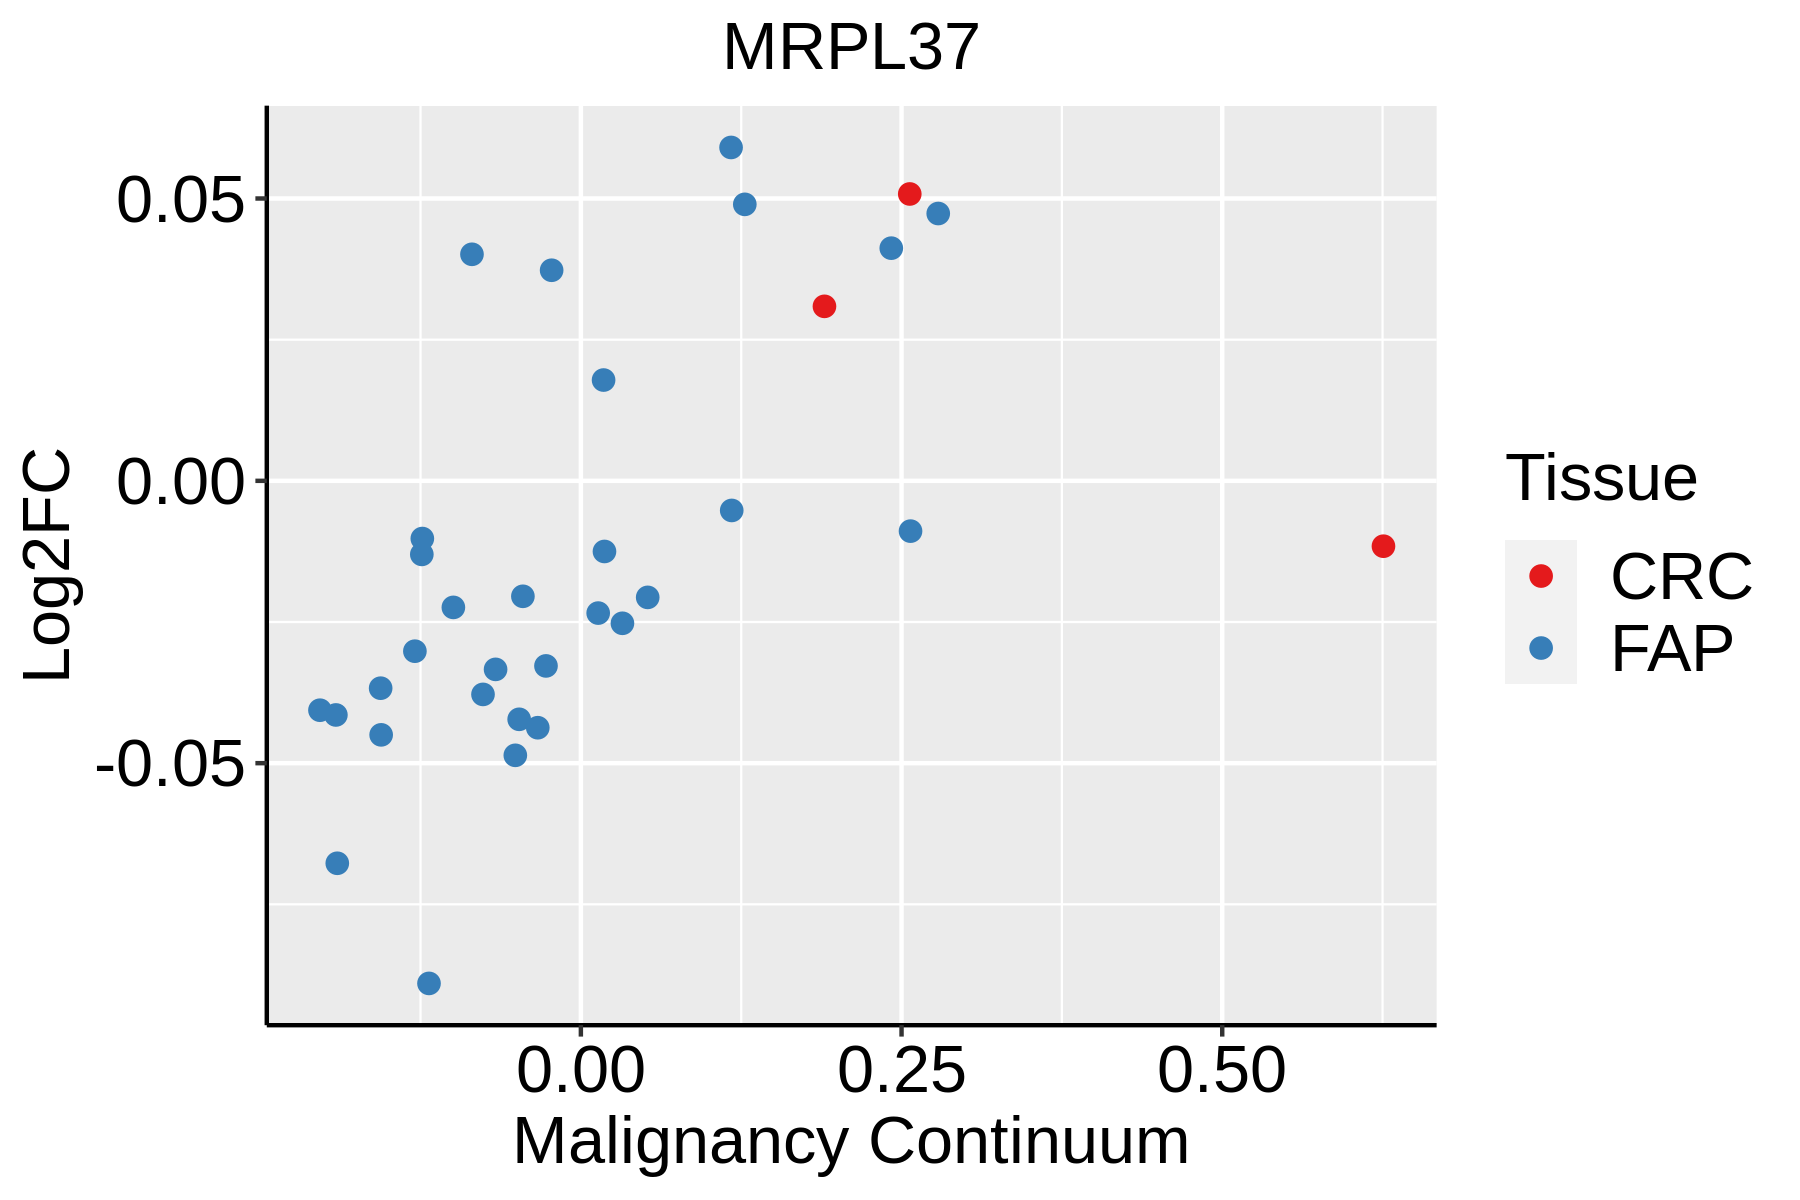 | FAP: Familial adenomatous polyposis |
| CRC: Colorectal cancer | ||
| Colorectum (HTA11) |  | AD: Adenomas |
| SER: Sessile serrated lesions | ||
| MSI-H: Microsatellite-high colorectal cancer | ||
| MSS: Microsatellite stable colorectal cancer | ||
| Esophagus | 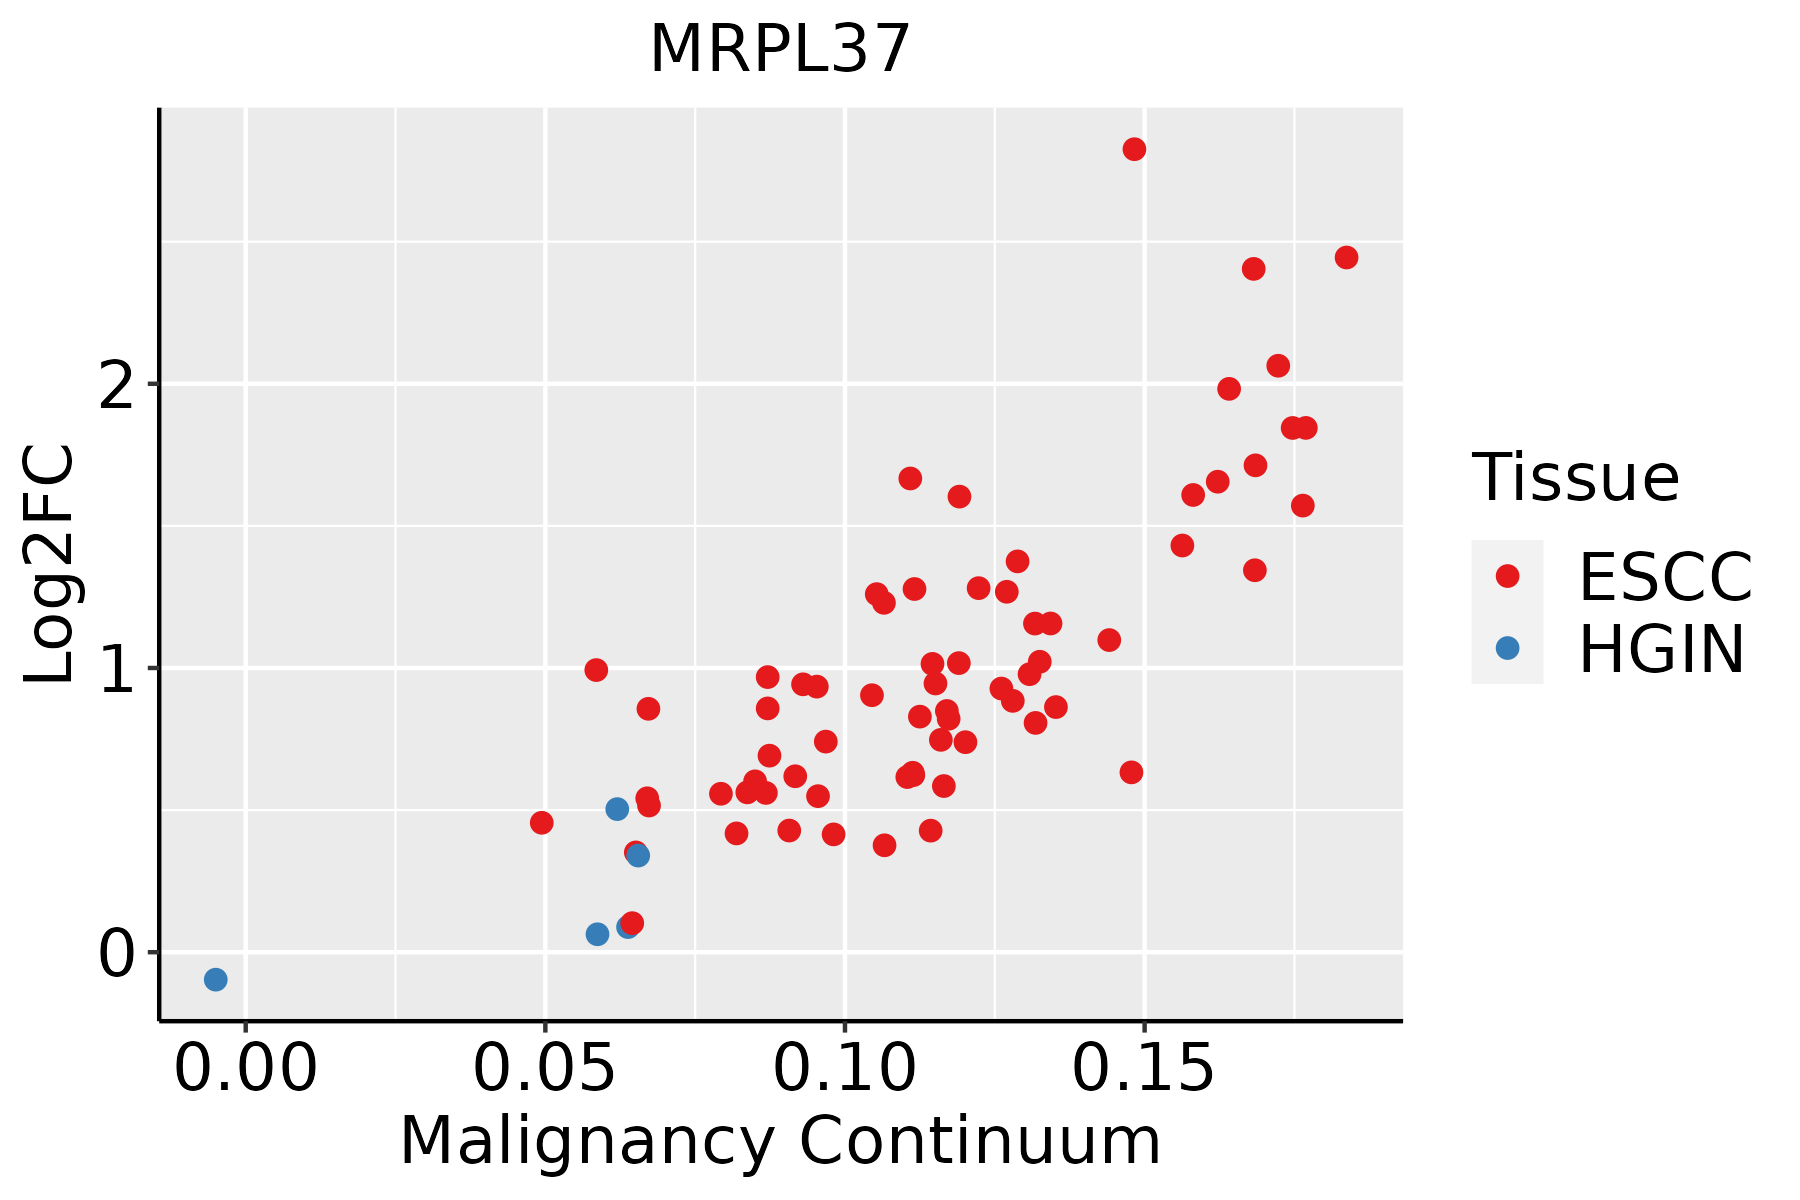 | ESCC: Esophageal squamous cell carcinoma |
| HGIN: High-grade intraepithelial neoplasias | ||
| LGIN: Low-grade intraepithelial neoplasias | ||
| Liver | 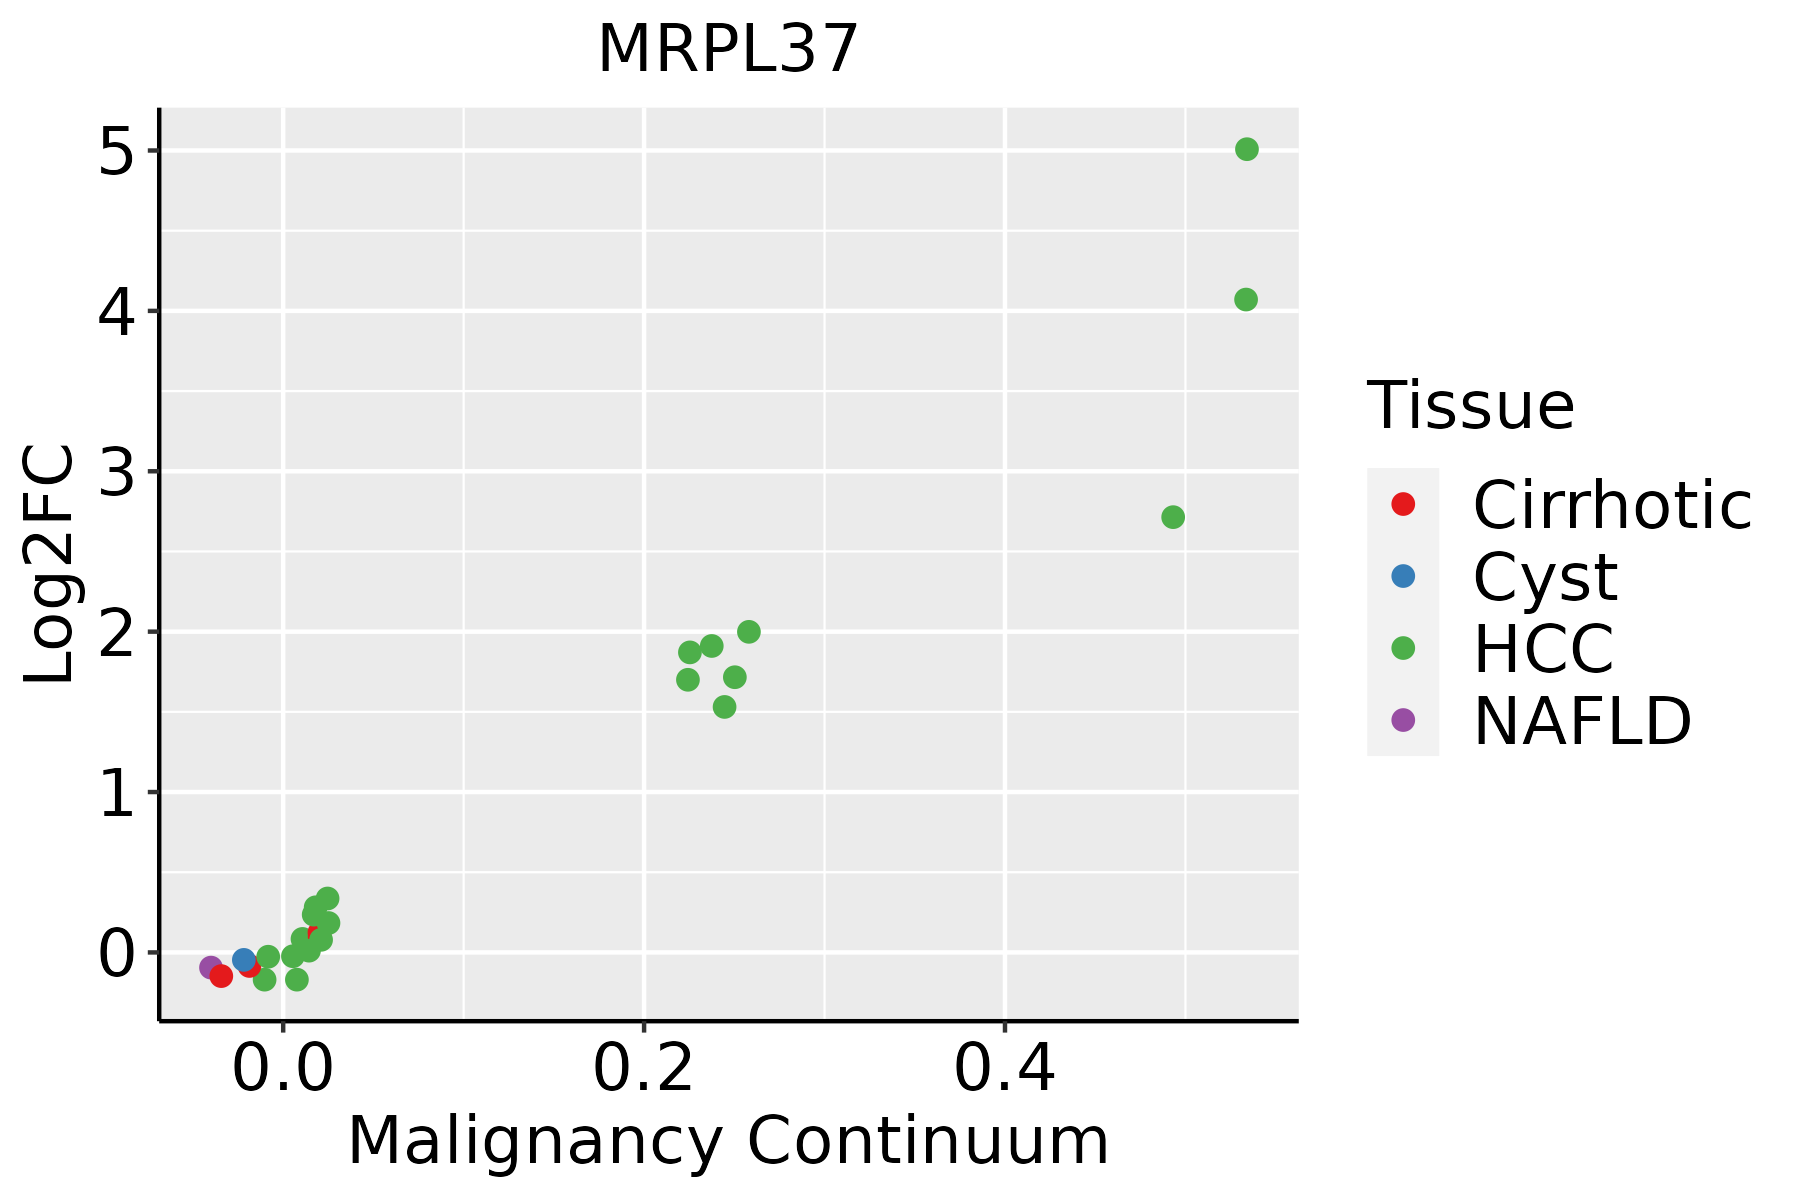 | HCC: Hepatocellular carcinoma |
| NAFLD: Non-alcoholic fatty liver disease | ||
| Oral Cavity |  | EOLP: Erosive Oral lichen planus |
| LP: leukoplakia | ||
| NEOLP: Non-erosive oral lichen planus | ||
| OSCC: Oral squamous cell carcinoma | ||
| Skin | 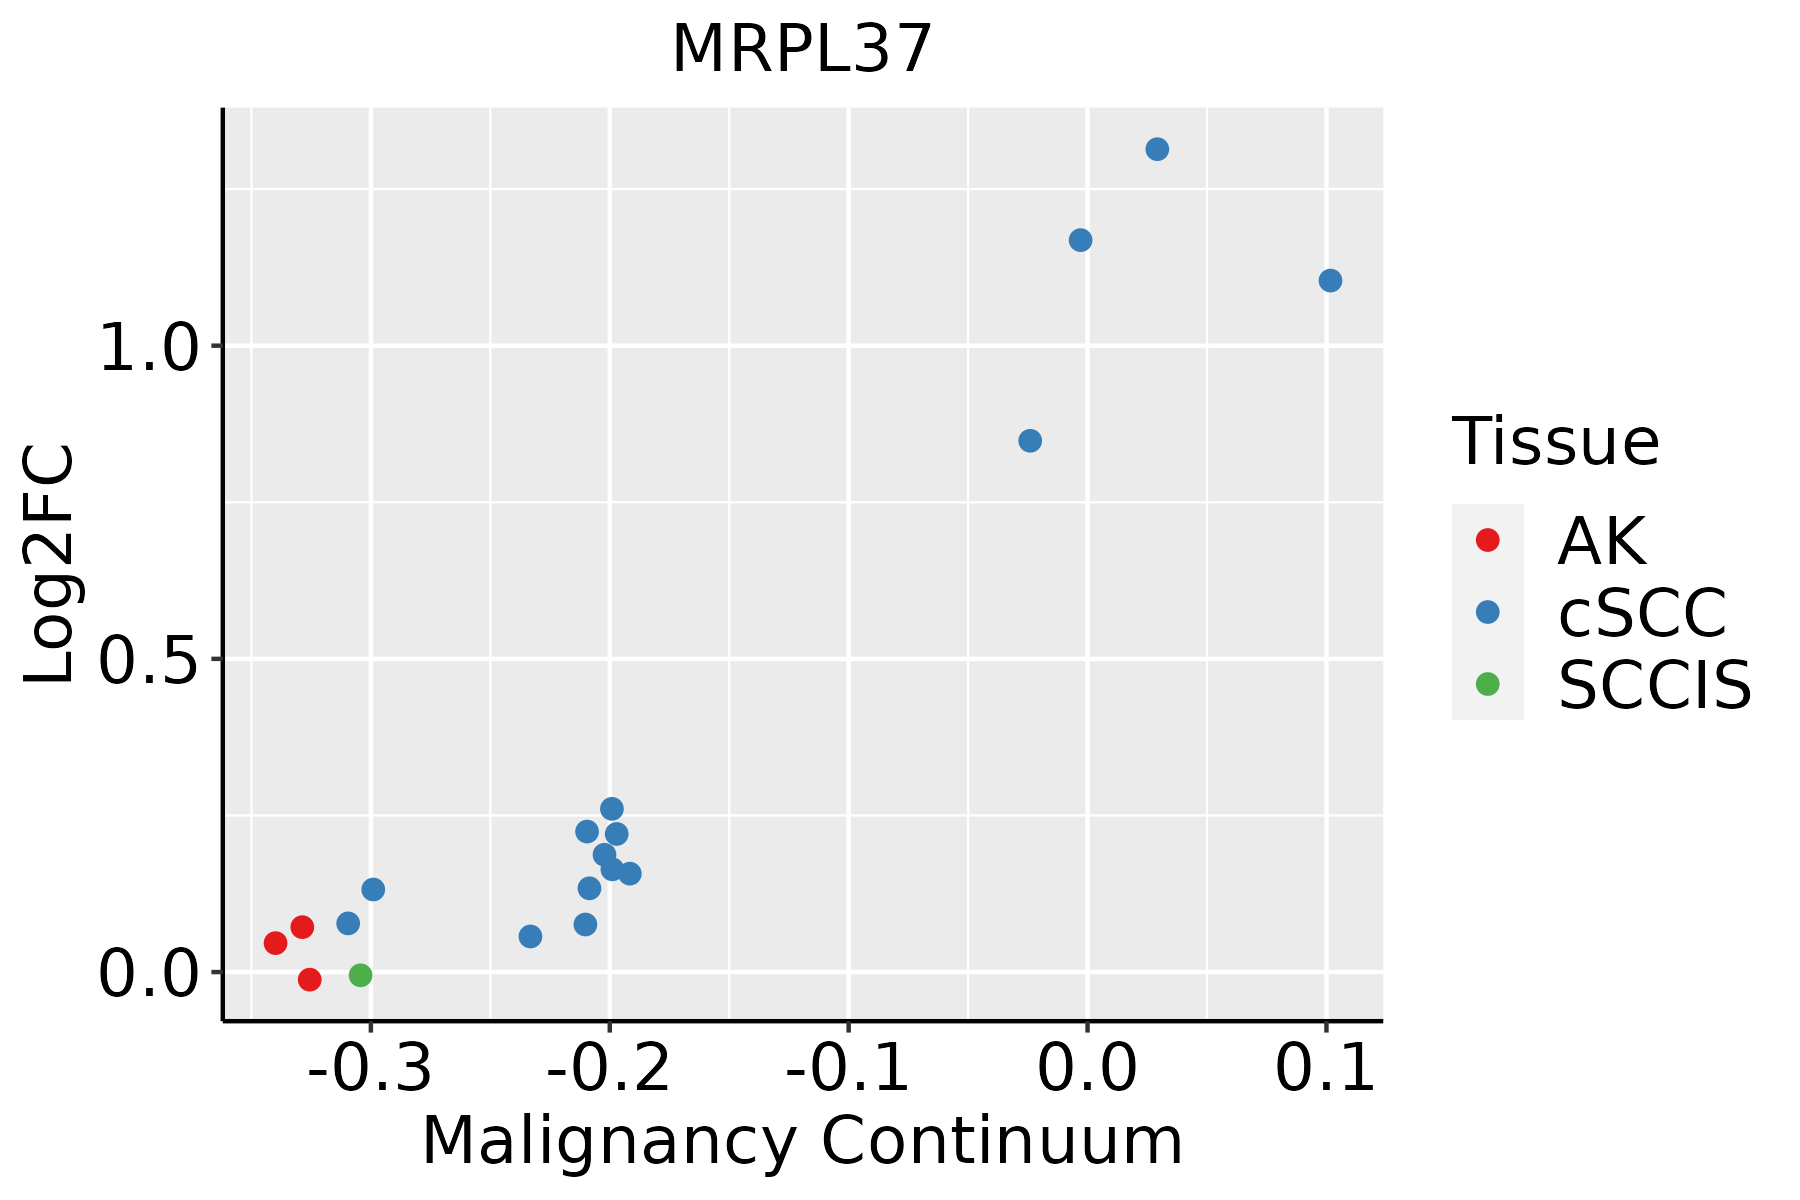 | AK: Actinic keratosis |
| cSCC: Cutaneous squamous cell carcinoma | ||
| SCCIS:squamous cell carcinoma in situ | ||
| Thyroid | 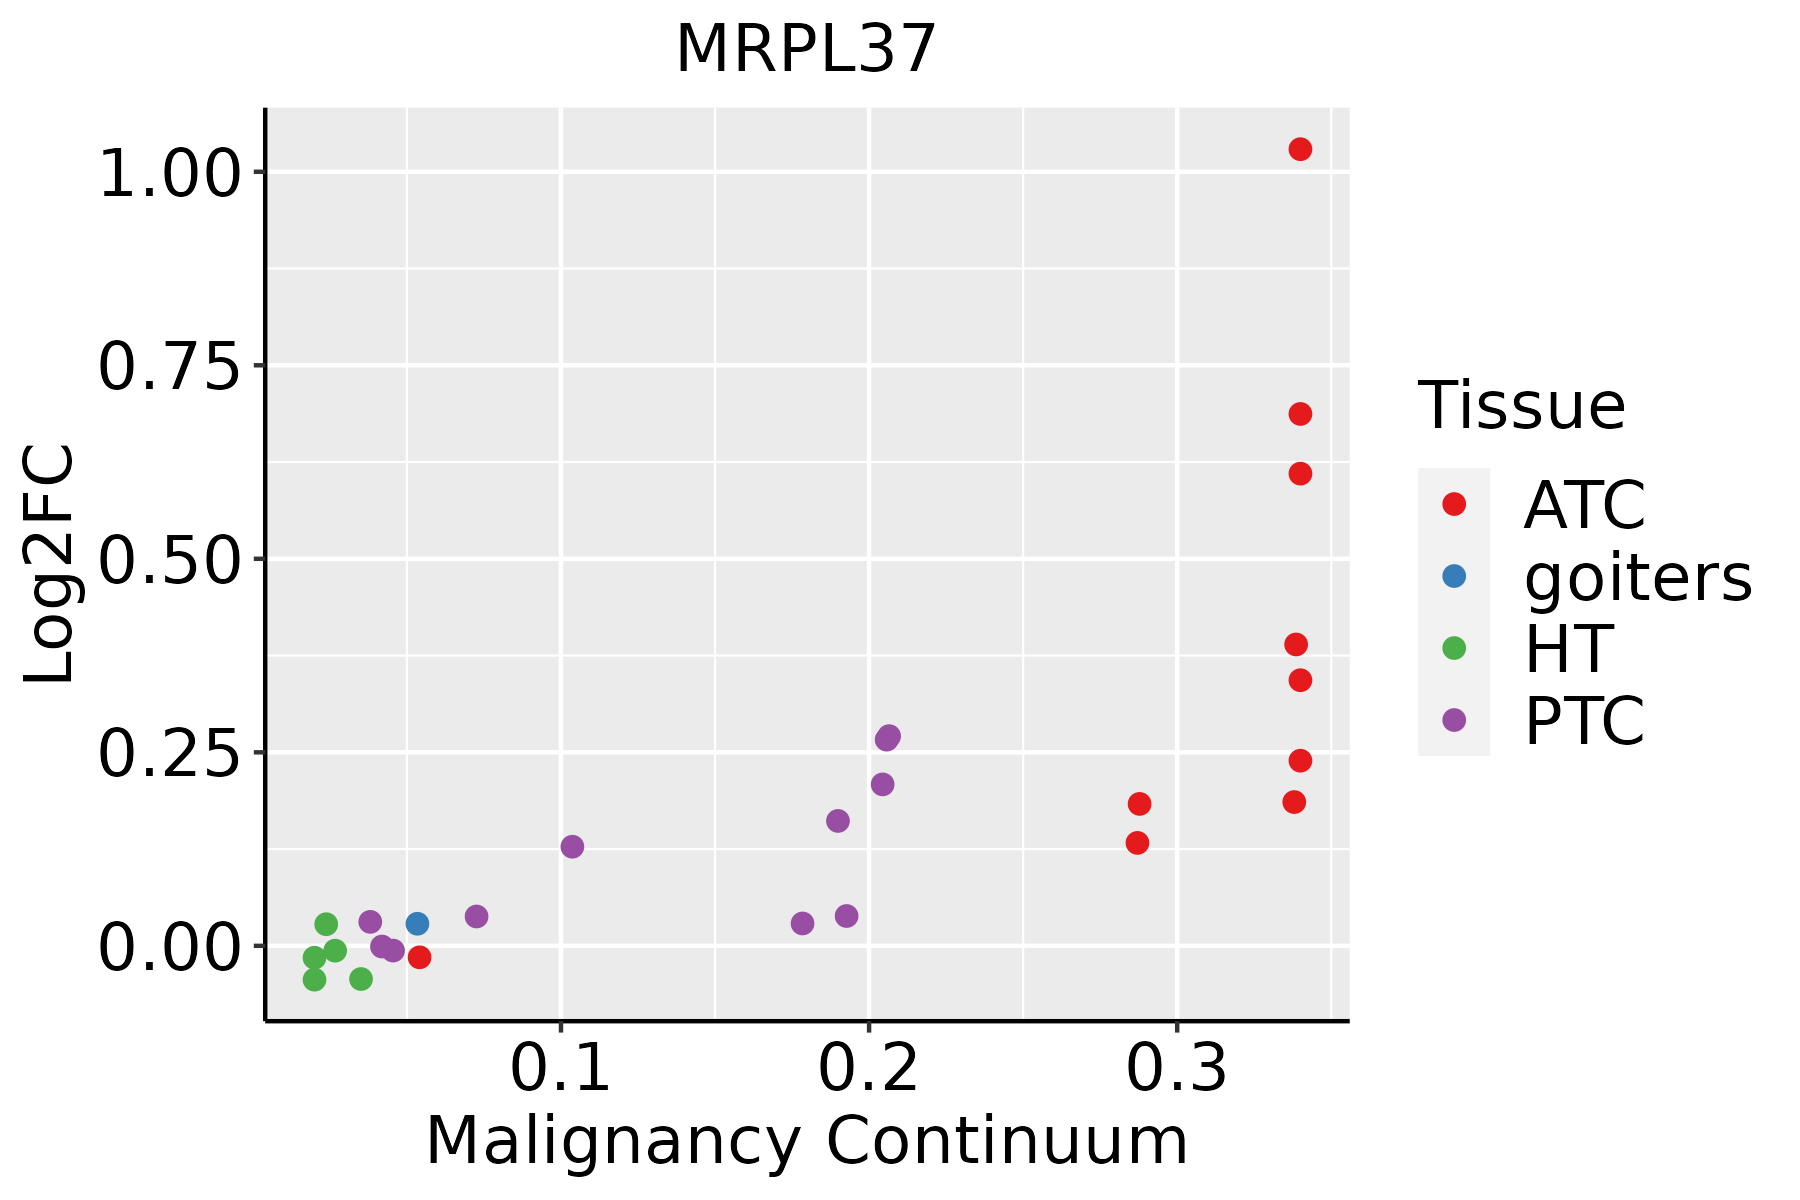 | ATC: Anaplastic thyroid cancer |
| HT: Hashimoto's thyroiditis | ||
| PTC: Papillary thyroid cancer |
| ∗log2FC in expression of this searched gene in stem-like cells from each diseased tissue sample relative to stem-like cells in normal samples in each tissue plotted against the malignancy continuum. Samples are colored based on if they are from different disease stage. |
Top |
Malignant transformation related pathway analysis |
| Find out the enriched GO biological processes and KEGG pathways involved in transition from healthy to precancer to cancer |
| Tissue | Disease Stage | Enriched GO biological Processes |
| Colorectum | AD |  |
| Colorectum | SER |  |
| Colorectum | MSS |  |
| Colorectum | MSI-H |  |
| Colorectum | FAP |  |
| ∗Top 15 enriched GO BP terms are showed in the bar plot of each disease state in each tissue. Each row represents a significant GO biological process which is colored according to the -log10(p.adjust). |
| Page: 1 2 3 4 5 6 7 8 9 |
| GO ID | Tissue | Disease Stage | Description | Gene Ratio | Bg Ratio | pvalue | p.adjust | Count |
| Page: 1 |
| Pathway ID | Tissue | Disease Stage | Description | Gene Ratio | Bg Ratio | pvalue | p.adjust | qvalue | Count |
| Page: 1 |
Top |
Cell-cell communication analysis |
| Identification of potential cell-cell interactions between two cell types and their ligand-receptor pairs for different disease states |
| Ligand | Receptor | LRpair | Pathway | Tissue | Disease Stage |
| Page: 1 |
Top |
Single-cell gene regulatory network inference analysis |
| Find out the significant the regulons (TFs) and the target genes of each regulon across cell types for different disease states |
| TF | Cell Type | Tissue | Disease Stage | Target Gene | RSS | Regulon Activity |
| ∗The dot plots of a searched regulon are shown for all cell subpopulations in each disease state of each tissue based on the regulon specific score inferred using pySCENIC and by calculating the average expression. |
| Page: 1 |
Top |
Somatic mutation of malignant transformation related genes |
| Annotation of somatic variants for genes involved in malignant transformation |
| Hugo Symbol | Variant Class | Variant Classification | dbSNP RS | HGVSc | HGVSp | HGVSp Short | SWISSPROT | BIOTYPE | SIFT | PolyPhen | Tumor Sample Barcode | Tissue | Histology | Sex | Age | Stage | Therapy Types | Drugs | Outcome |
| MRPL37 | SNV | Missense_Mutation | rs768836635 | c.110N>T | p.Ser37Phe | p.S37F | protein_coding | deleterious_low_confidence(0) | probably_damaging(0.956) | TCGA-BH-A0HF-01 | Breast | breast invasive carcinoma | Female | >=65 | I/II | Hormone Therapy | arimidex | SD | |
| MRPL37 | insertion | Nonsense_Mutation | novel | c.961_962insGTCATGGCTGAAAAGAACAAGTACTAAACTTTGATTCTCAGCA | p.Ala321GlyfsTer4 | p.A321Gfs*4 | protein_coding | TCGA-A8-A09N-01 | Breast | breast invasive carcinoma | Female | <65 | III/IV | Unknown | Unknown | SD | |||
| MRPL37 | insertion | Nonsense_Mutation | novel | c.1164_1165insTGTAAAGGGAAGAACTAGAAG | p.Cys388_Leu389insCysLysGlyLysAsnTerLys | p.C388_L389insCKGKN*K | protein_coding | TCGA-AN-A0FS-01 | Breast | breast invasive carcinoma | Female | <65 | I/II | Unknown | Unknown | SD | |||
| MRPL37 | SNV | Missense_Mutation | novel | c.832G>A | p.Gly278Arg | p.G278R | protein_coding | deleterious(0.01) | probably_damaging(0.999) | TCGA-2W-A8YY-01 | Cervix | cervical & endocervical cancer | Female | <65 | I/II | Chemotherapy | cisplatin | CR | |
| MRPL37 | SNV | Missense_Mutation | novel | c.1379G>A | p.Arg460His | p.R460H | protein_coding | deleterious_low_confidence(0) | benign(0) | TCGA-2W-A8YY-01 | Cervix | cervical & endocervical cancer | Female | <65 | I/II | Chemotherapy | cisplatin | CR | |
| MRPL37 | SNV | Missense_Mutation | rs369065705 | c.1033G>A | p.Val345Met | p.V345M | protein_coding | deleterious(0.05) | benign(0.115) | TCGA-AA-3864-01 | Colorectum | colon adenocarcinoma | Male | >=65 | I/II | Unknown | Unknown | SD | |
| MRPL37 | SNV | Missense_Mutation | c.349G>A | p.Val117Ile | p.V117I | protein_coding | tolerated(0.11) | benign(0.373) | TCGA-CM-4746-01 | Colorectum | colon adenocarcinoma | Male | <65 | I/II | Unknown | Unknown | SD | ||
| MRPL37 | SNV | Missense_Mutation | rs753105572 | c.1040C>T | p.Thr347Met | p.T347M | protein_coding | deleterious(0.05) | probably_damaging(0.959) | TCGA-AG-A02N-01 | Colorectum | rectum adenocarcinoma | Male | >=65 | I/II | Chemotherapy | folinic | CR | |
| MRPL37 | SNV | Missense_Mutation | novel | c.892N>C | p.Asn298His | p.N298H | protein_coding | deleterious(0) | benign(0.046) | TCGA-AG-A032-01 | Colorectum | rectum adenocarcinoma | Male | >=65 | III/IV | Targeted Molecular therapy | bevacizumab | PD | |
| MRPL37 | insertion | Frame_Shift_Ins | novel | c.1181dupA | p.Arg395GlufsTer7 | p.R395Efs*7 | protein_coding | TCGA-AA-3710-01 | Colorectum | colon adenocarcinoma | Female | >=65 | I/II | Unknown | Unknown | SD |
| Page: 1 2 3 4 5 |
Top |
Related drugs of malignant transformation related genes |
| Identification of chemicals and drugs interact with genes involved in malignant transfromation |
| (DGIdb 4.0) |
| Entrez ID | Symbol | Category | Interaction Types | Drug Claim Name | Drug Name | PMIDs |
| Page: 1 |

Copyright 2023-Present -The University of Texas Health Science Center at Houston |