
|
|||||
|
 | |
| |
| |
| |
| |
| |
|
Gene: MALL |
Gene summary for MALL |
| Gene information | Species | Human | Gene symbol | MALL | Gene ID | 7851 |
| Gene name | mal, T cell differentiation protein like | |
| Gene Alias | BENE | |
| Cytomap | 2q13 | |
| Gene Type | protein-coding | GO ID | GO:0007272 | UniProtAcc | Q13021 |
Top |
Malignant transformation analysis |
| Identification of the aberrant gene expression in precancerous and cancerous lesions by comparing the gene expression of stem-like cells in diseased tissues with normal stem cells |
| Entrez ID | Symbol | Replicates | Species | Organ | Tissue | Adj P-value | Log2FC | Malignancy |
| 7851 | MALL | GSM5252135_BPH511PrPUr_Fcol_3GEX | Human | Prostate | BPH | 5.55e-19 | 1.39e+00 | -0.1833 |
| 7851 | MALL | GSM5252136_BPH556PrGA1_Fcol | Human | Prostate | BPH | 2.53e-05 | -2.50e-01 | -0.23 |
| 7851 | MALL | GSM5252137_BPH556PrGA2_Fcol | Human | Prostate | BPH | 5.34e-06 | -2.71e-01 | -0.23 |
| 7851 | MALL | 047563_1562-all-cells | Human | Prostate | BPH | 1.07e-02 | -1.93e-01 | 0.0791 |
| 7851 | MALL | 052099_1652-all-cells | Human | Prostate | BPH | 1.28e-02 | -2.26e-01 | 0.1038 |
| 7851 | MALL | Dong_P1 | Human | Prostate | Tumor | 3.41e-28 | 3.83e-01 | 0.035 |
| 7851 | MALL | Dong_P5 | Human | Prostate | Tumor | 4.96e-03 | -2.31e-01 | 0.053 |
| 7851 | MALL | P9 | Human | Prostate | Tumor | 4.63e-02 | -2.80e-01 | -0.0285 |
| 7851 | MALL | GSM5353222_PA_PB2B_Pool_1_3_S52_L002 | Human | Prostate | Tumor | 5.19e-03 | -2.80e-01 | 0.1608 |
| 7851 | MALL | GSM5353240_PA_PR5254_T1_S15_L001 | Human | Prostate | Tumor | 6.51e-04 | -2.80e-01 | 0.1575 |
| 7851 | MALL | GSM5353243_PA_PR5261_T1_S23_L002 | Human | Prostate | Tumor | 1.36e-04 | -2.80e-01 | 0.1545 |
| 7851 | MALL | GSM5353244_PA_PR5261_T2_S24_L002 | Human | Prostate | Tumor | 7.28e-03 | -2.80e-01 | 0.1569 |
| 7851 | MALL | P1_cSCC | Human | Skin | cSCC | 5.72e-20 | 7.72e-01 | 0.0292 |
| 7851 | MALL | P2_cSCC | Human | Skin | cSCC | 8.37e-10 | 4.43e-01 | -0.024 |
| 7851 | MALL | P4_cSCC | Human | Skin | cSCC | 3.80e-23 | 5.97e-01 | -0.00290000000000005 |
| 7851 | MALL | P10_cSCC | Human | Skin | cSCC | 6.34e-29 | 1.16e+00 | 0.1017 |
| 7851 | MALL | Pat01-B | Human | Stomach | GC | 3.48e-69 | 1.21e+00 | 0.5754 |
| 7851 | MALL | Pat02-B | Human | Stomach | GC | 7.57e-28 | 5.94e-01 | 0.0368 |
| 7851 | MALL | Pat03-B | Human | Stomach | GC | 1.72e-49 | 9.94e-01 | 0.3693 |
| 7851 | MALL | Pat04-B | Human | Stomach | GC | 8.58e-10 | 3.30e-01 | -0.1483 |
| Page: 1 2 3 4 5 6 7 8 9 10 |
| Tissue | Expression Dynamics | Abbreviation |
| Breast | 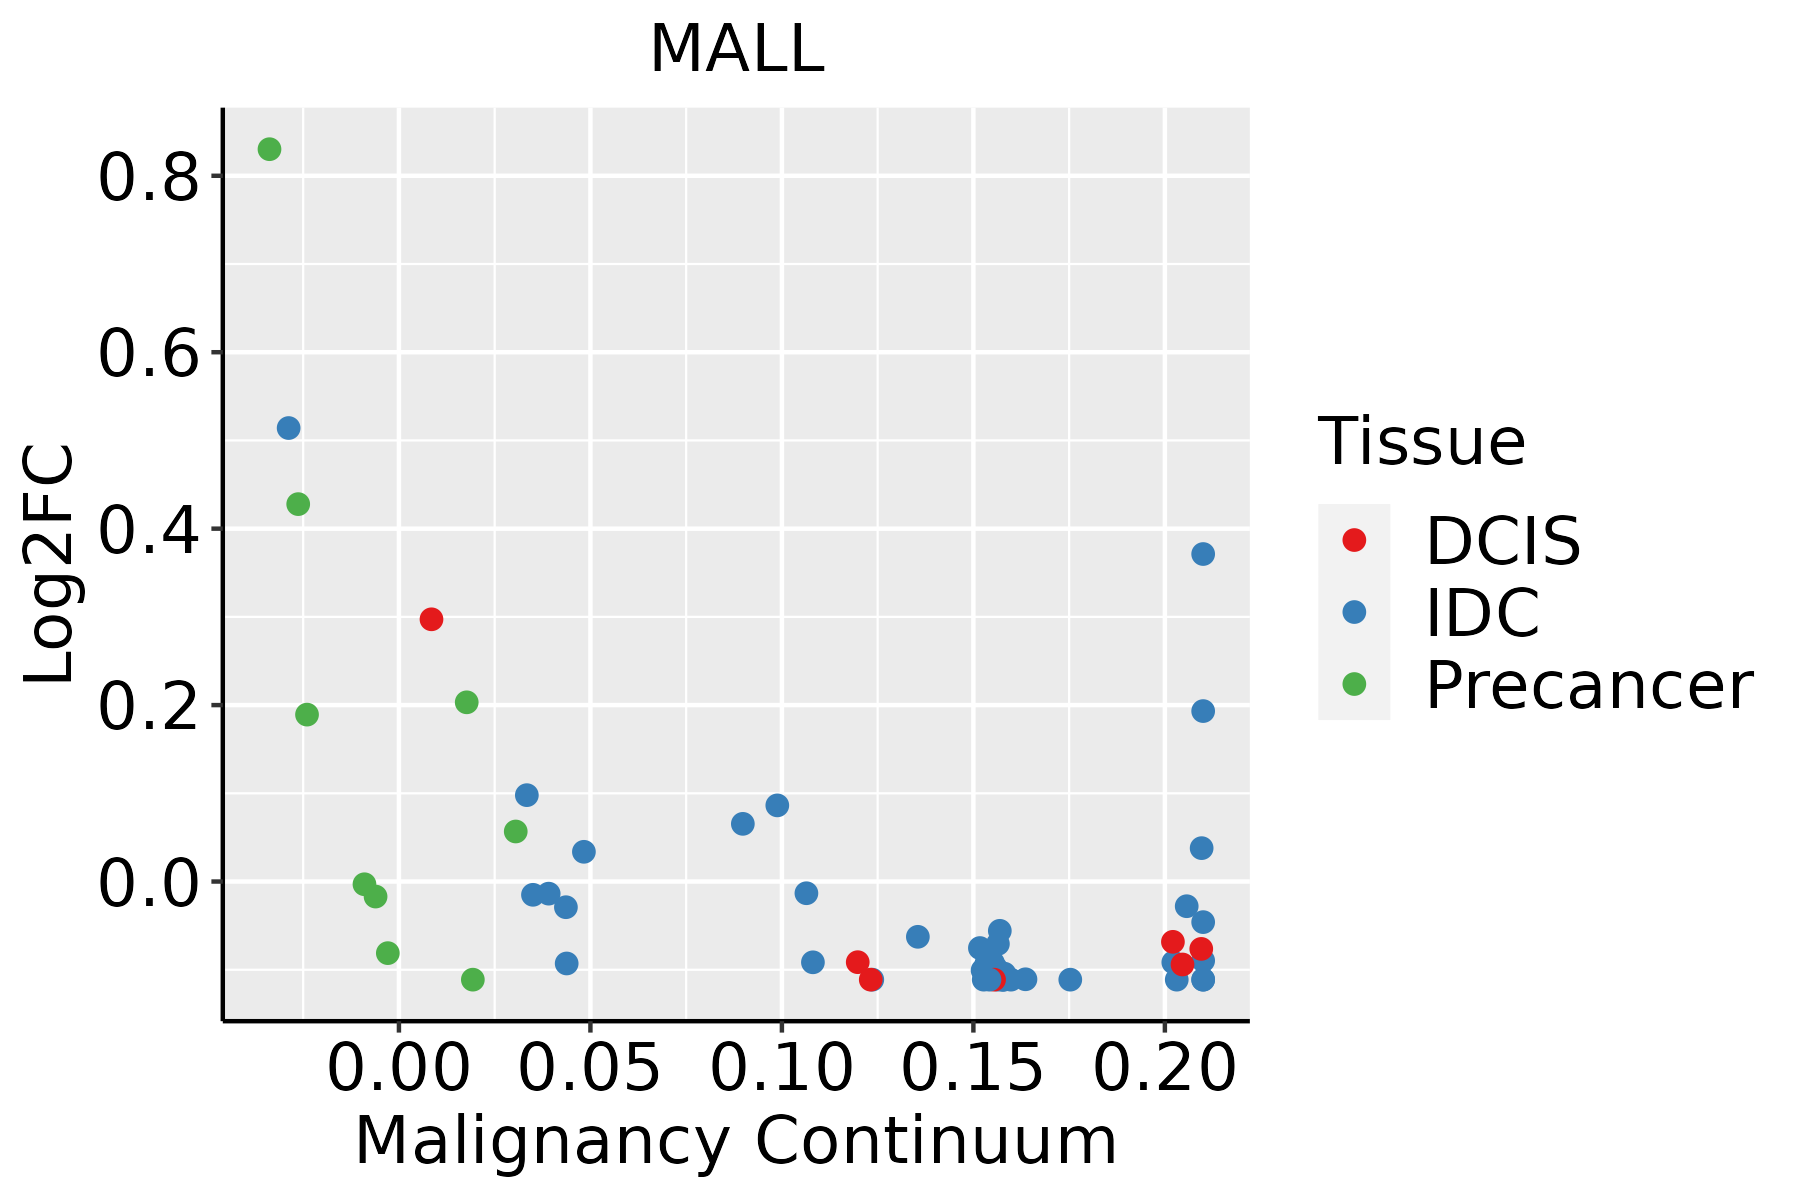 | IDC: Invasive ductal carcinoma |
| DCIS: Ductal carcinoma in situ | ||
| Precancer(BRCA1-mut): Precancerous lesion from BRCA1 mutation carriers | ||
| Cervix | 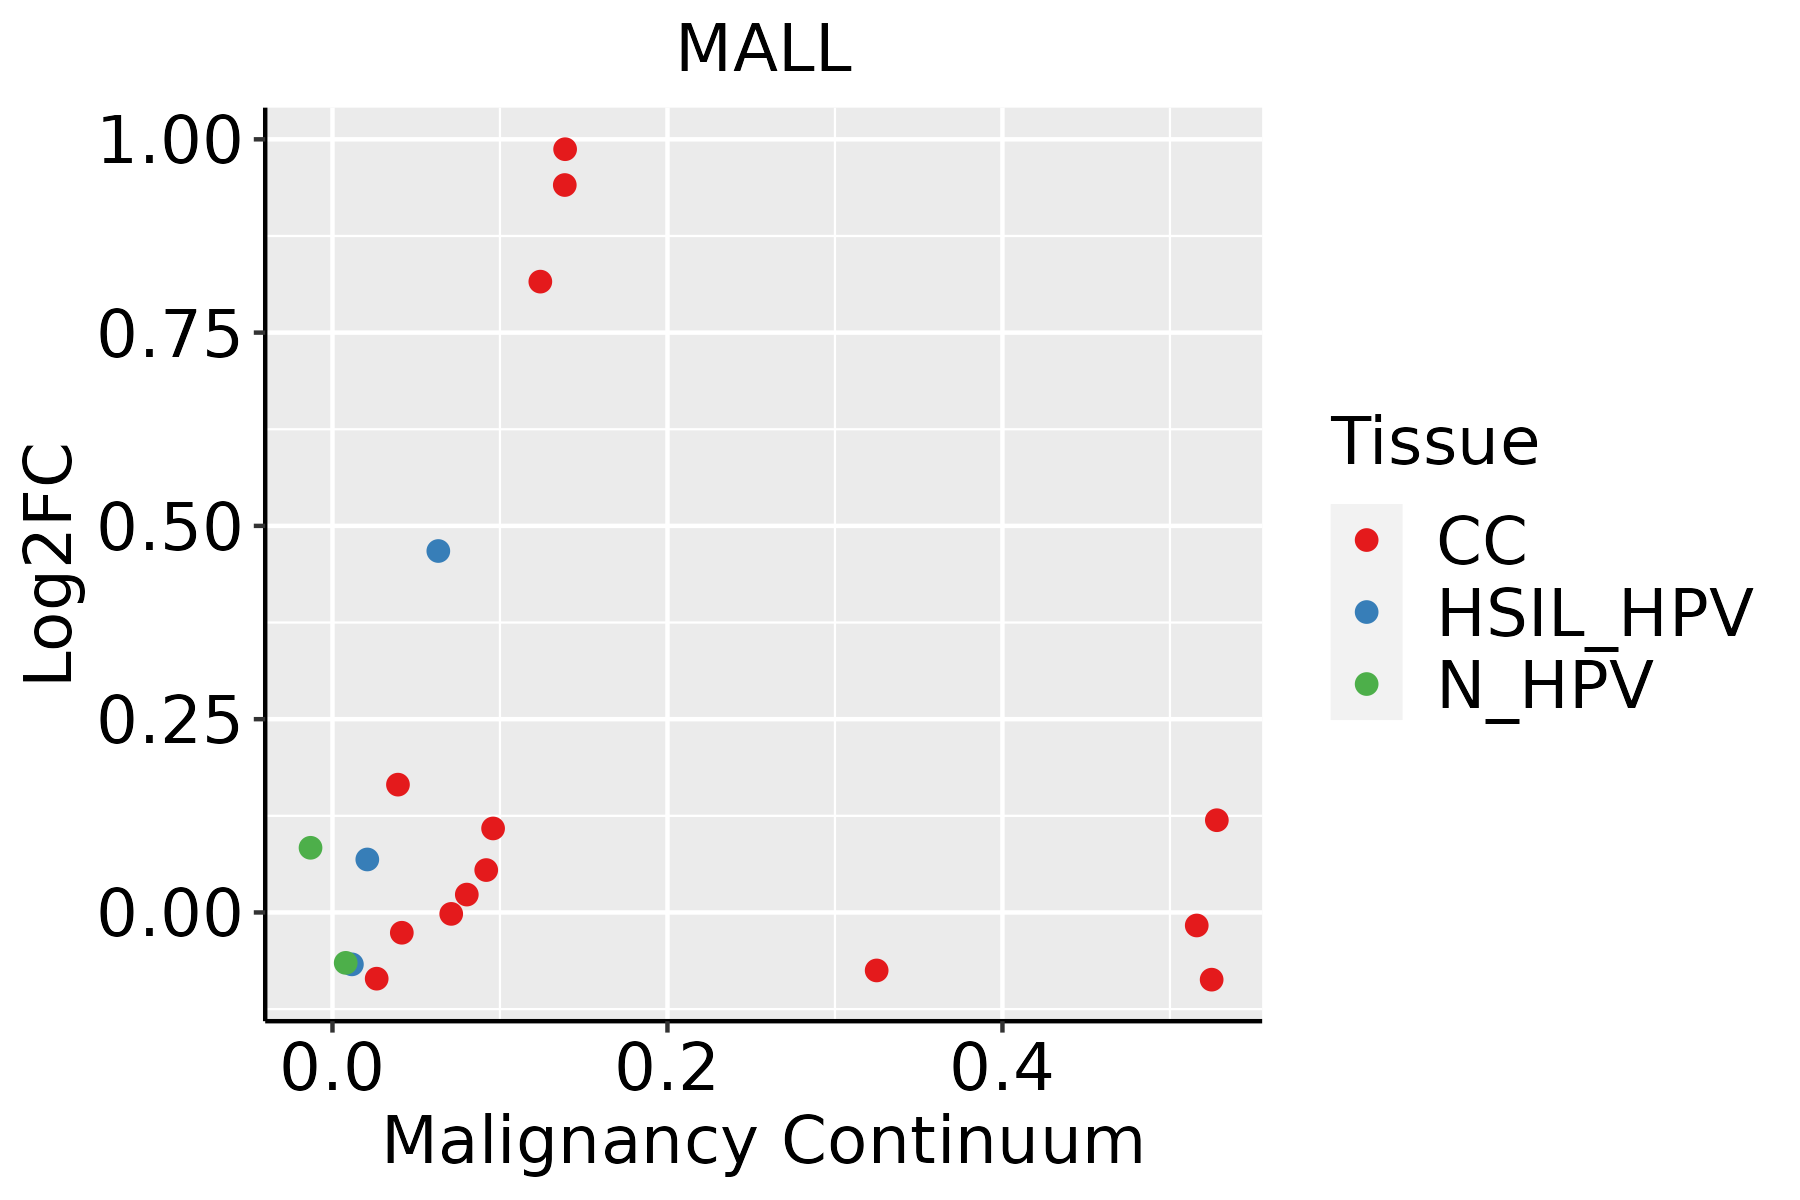 | CC: Cervix cancer |
| HSIL_HPV: HPV-infected high-grade squamous intraepithelial lesions | ||
| N_HPV: HPV-infected normal cervix | ||
| Colorectum (GSE201348) | 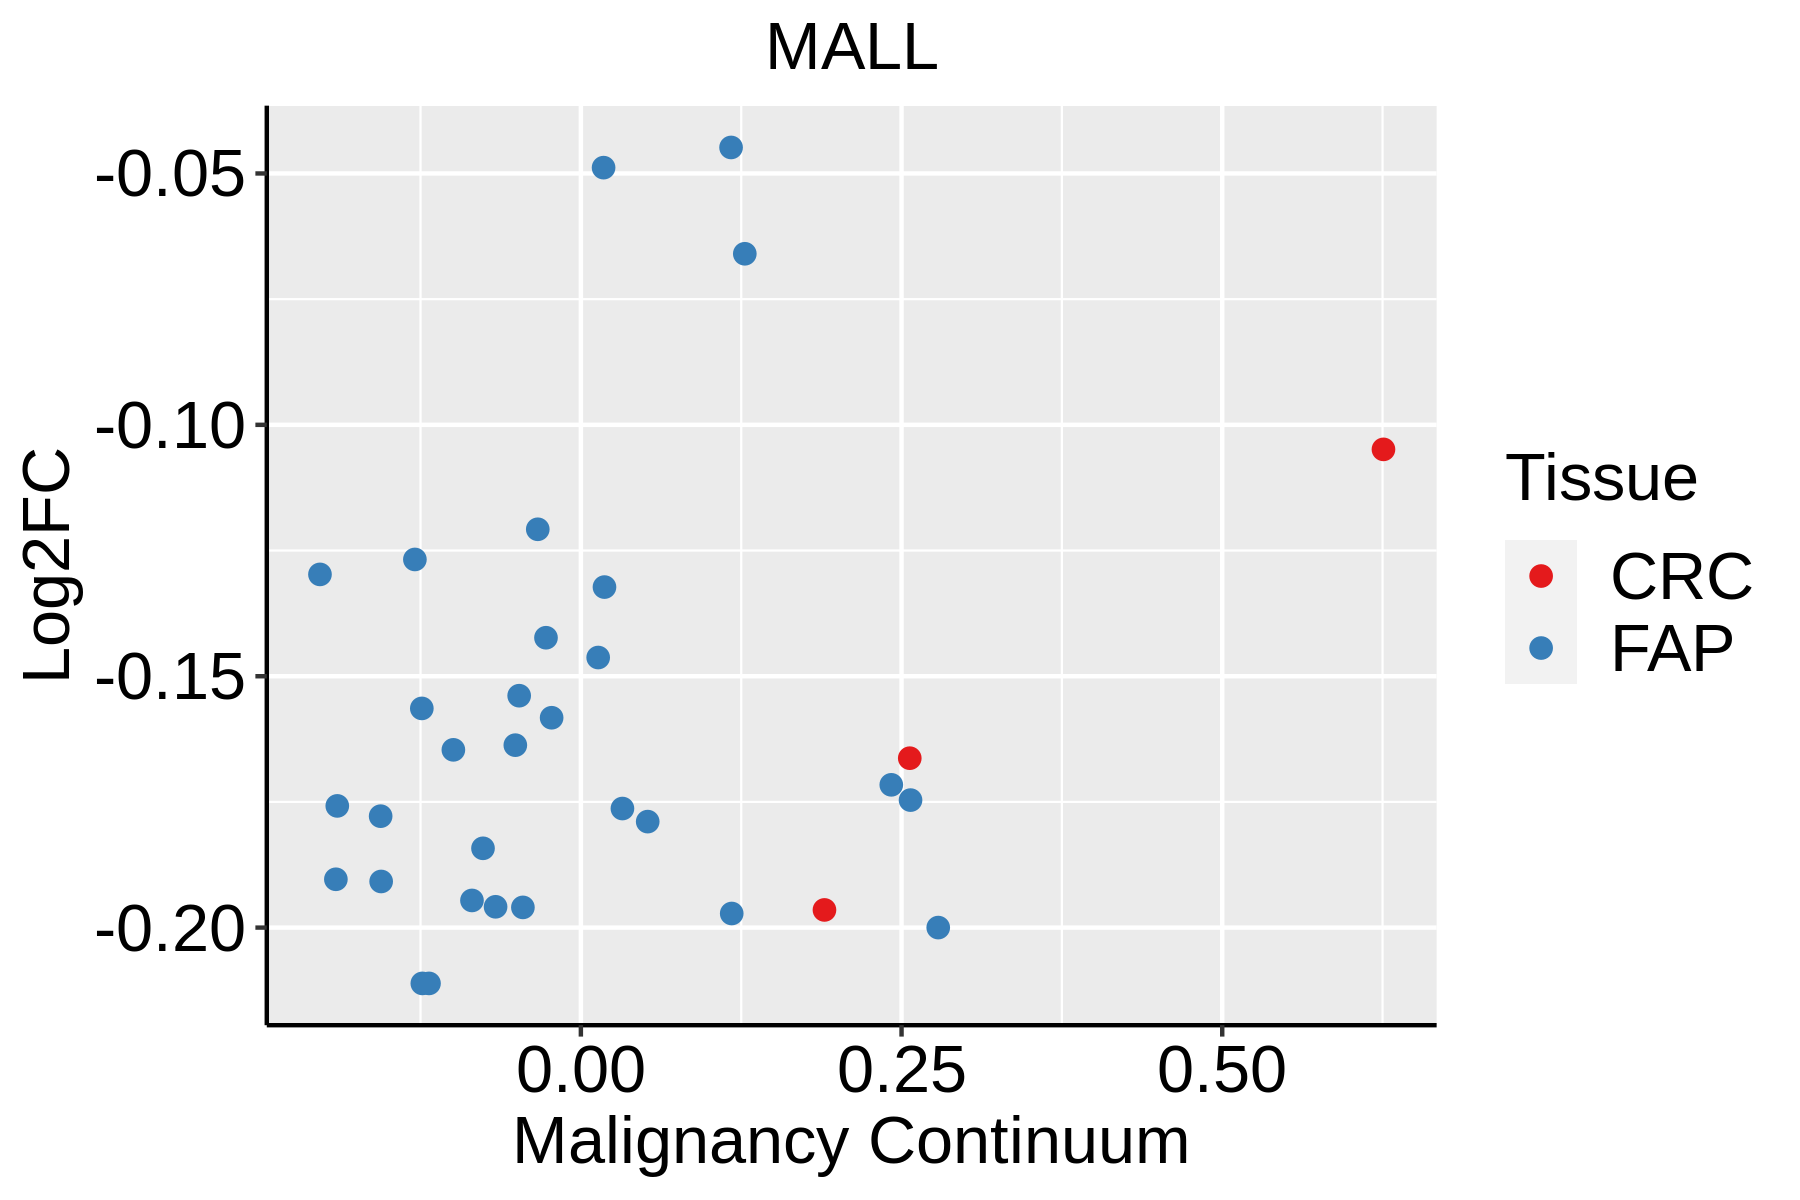 | FAP: Familial adenomatous polyposis |
| CRC: Colorectal cancer | ||
| Colorectum (HTA11) | 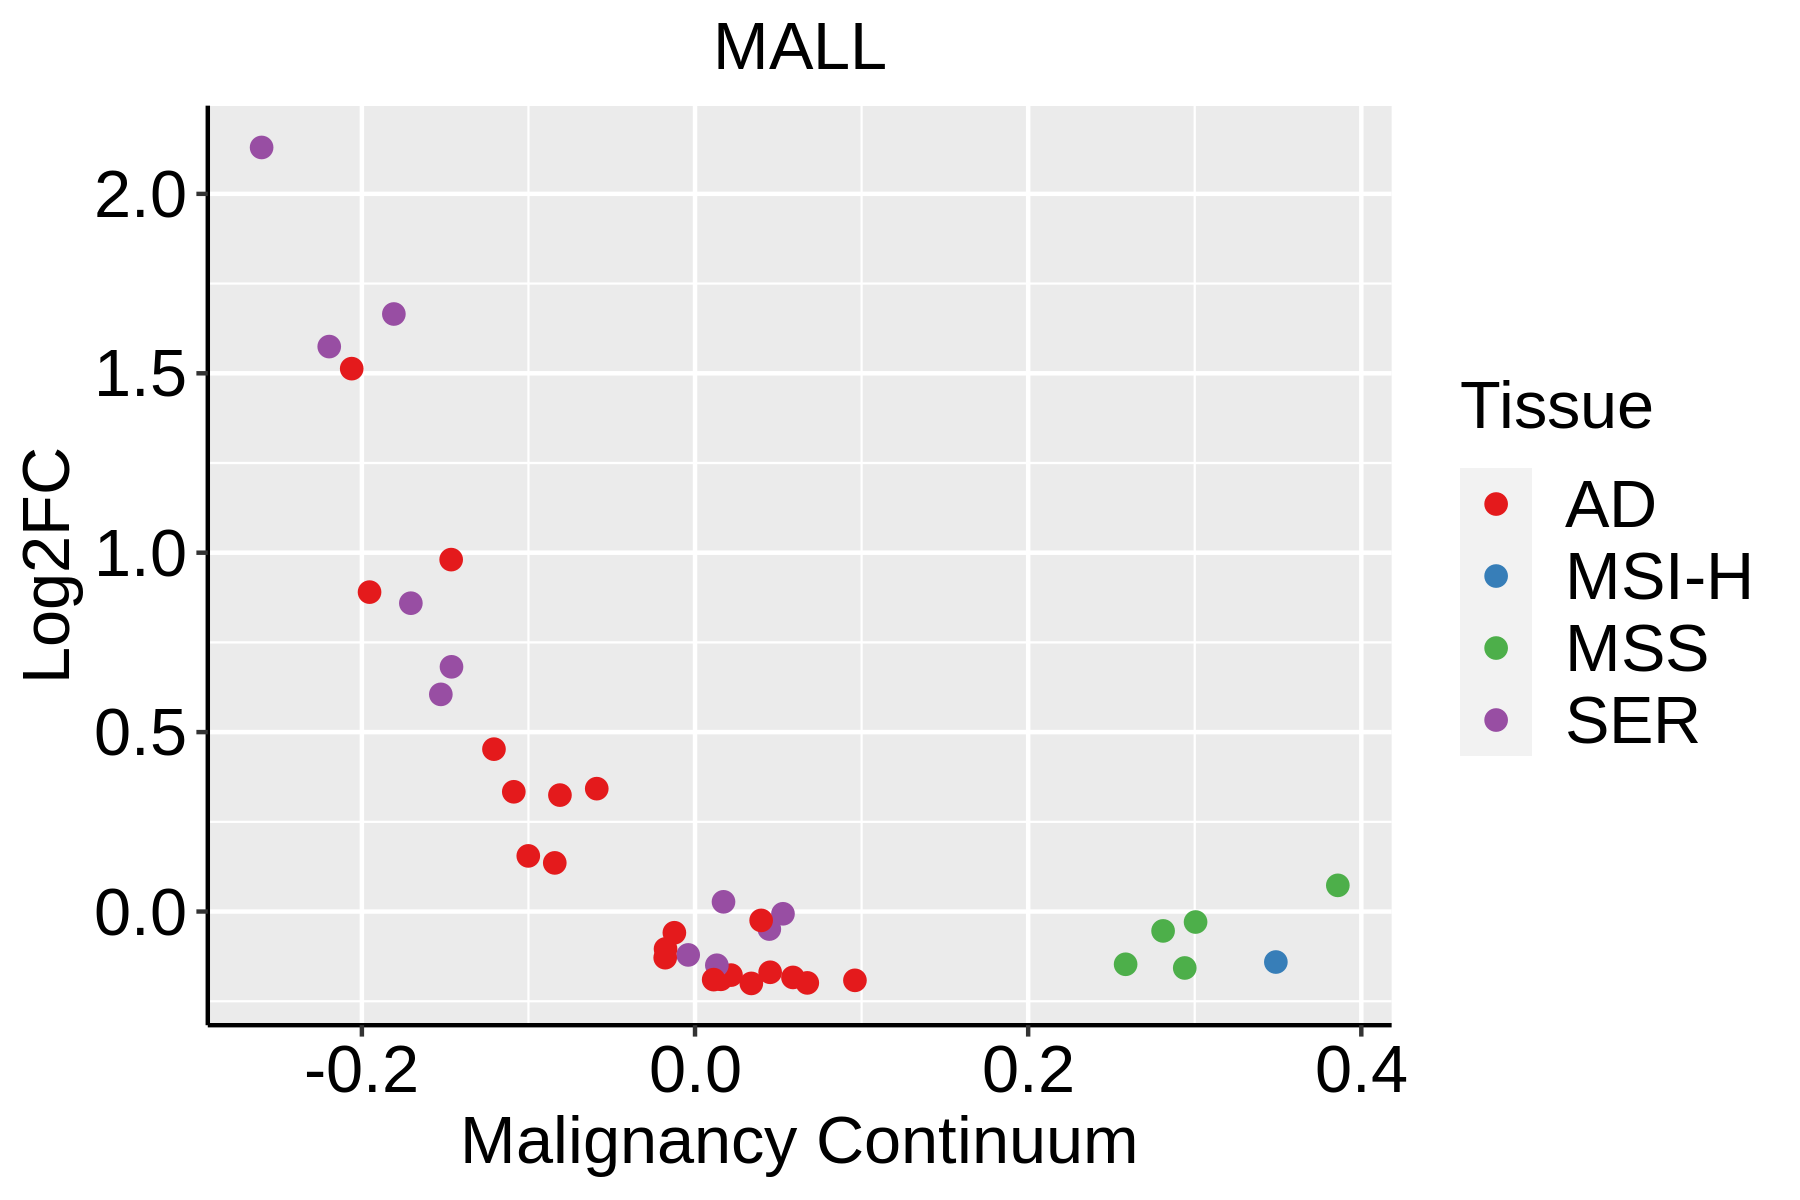 | AD: Adenomas |
| SER: Sessile serrated lesions | ||
| MSI-H: Microsatellite-high colorectal cancer | ||
| MSS: Microsatellite stable colorectal cancer | ||
| Esophagus | 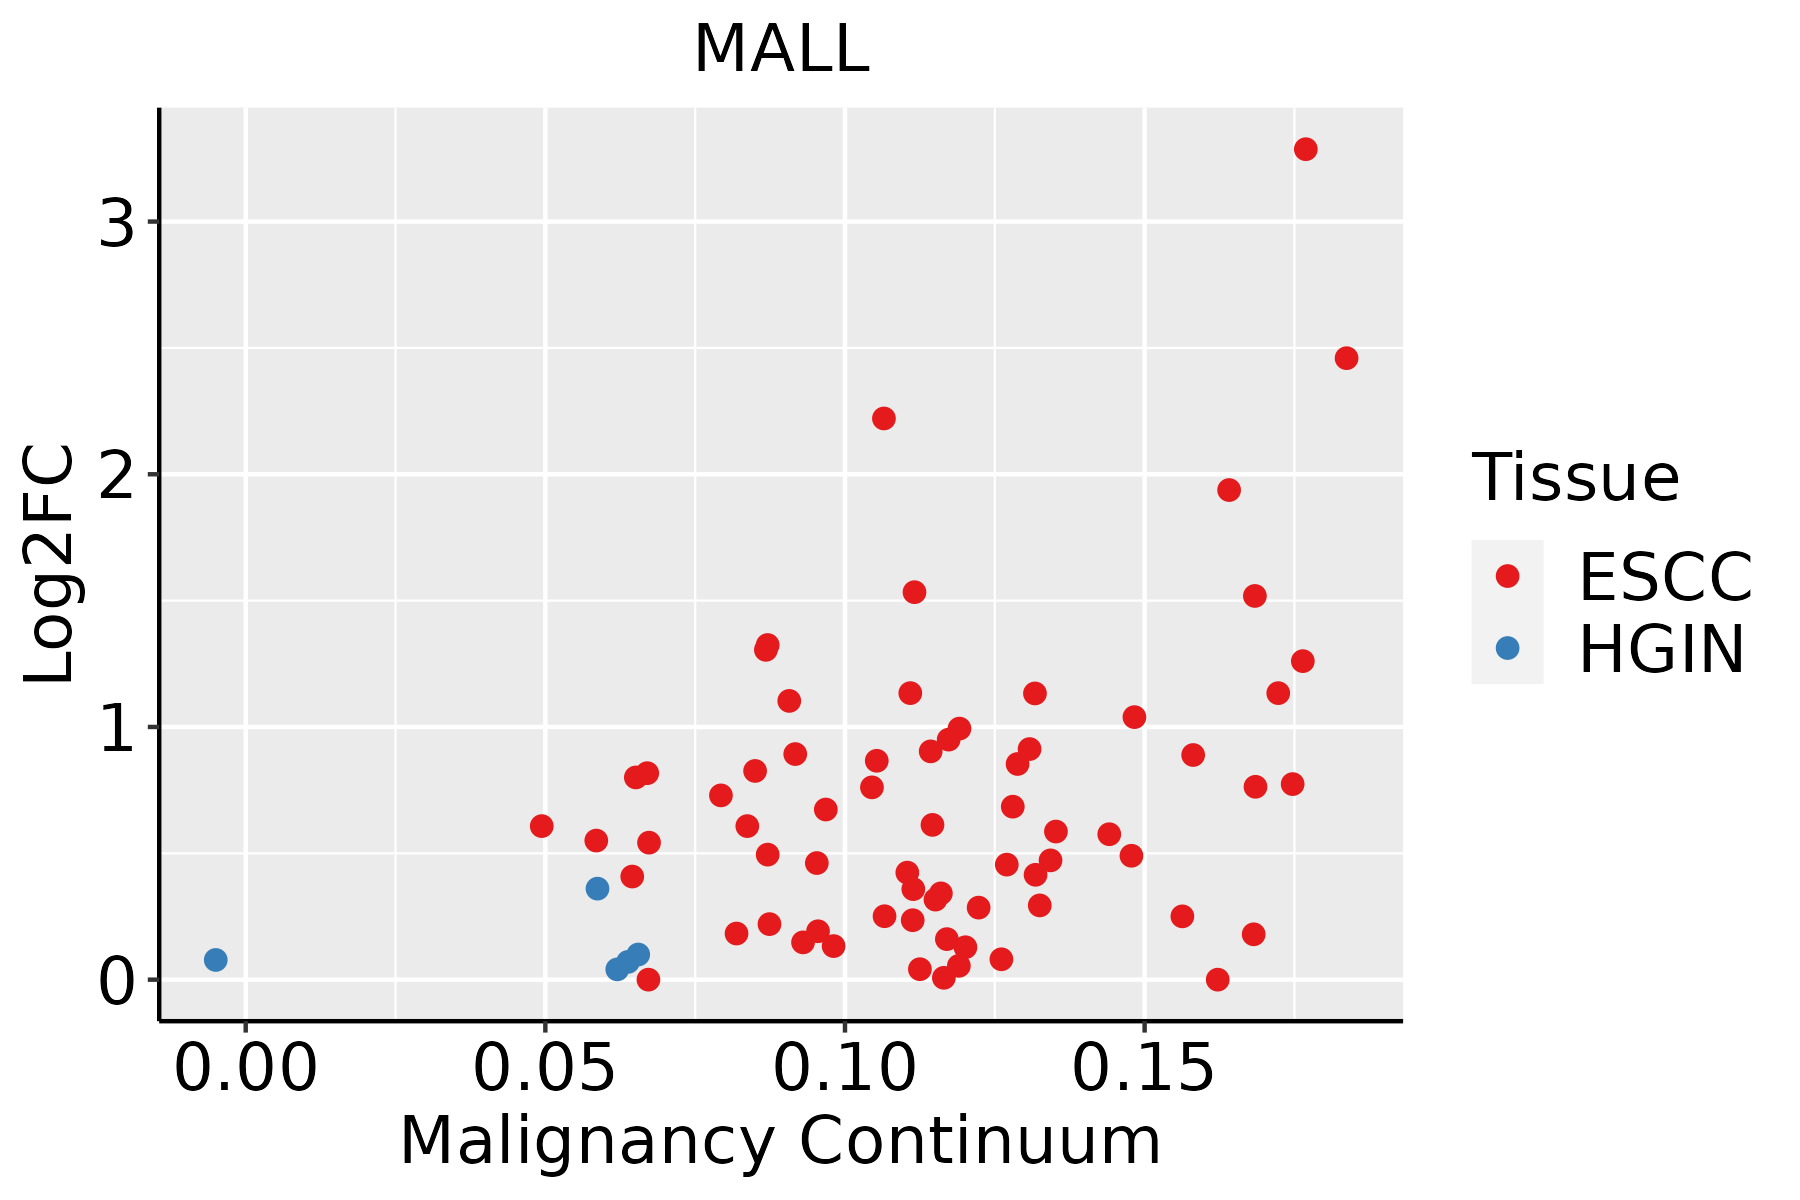 | ESCC: Esophageal squamous cell carcinoma |
| HGIN: High-grade intraepithelial neoplasias | ||
| LGIN: Low-grade intraepithelial neoplasias | ||
| GC | 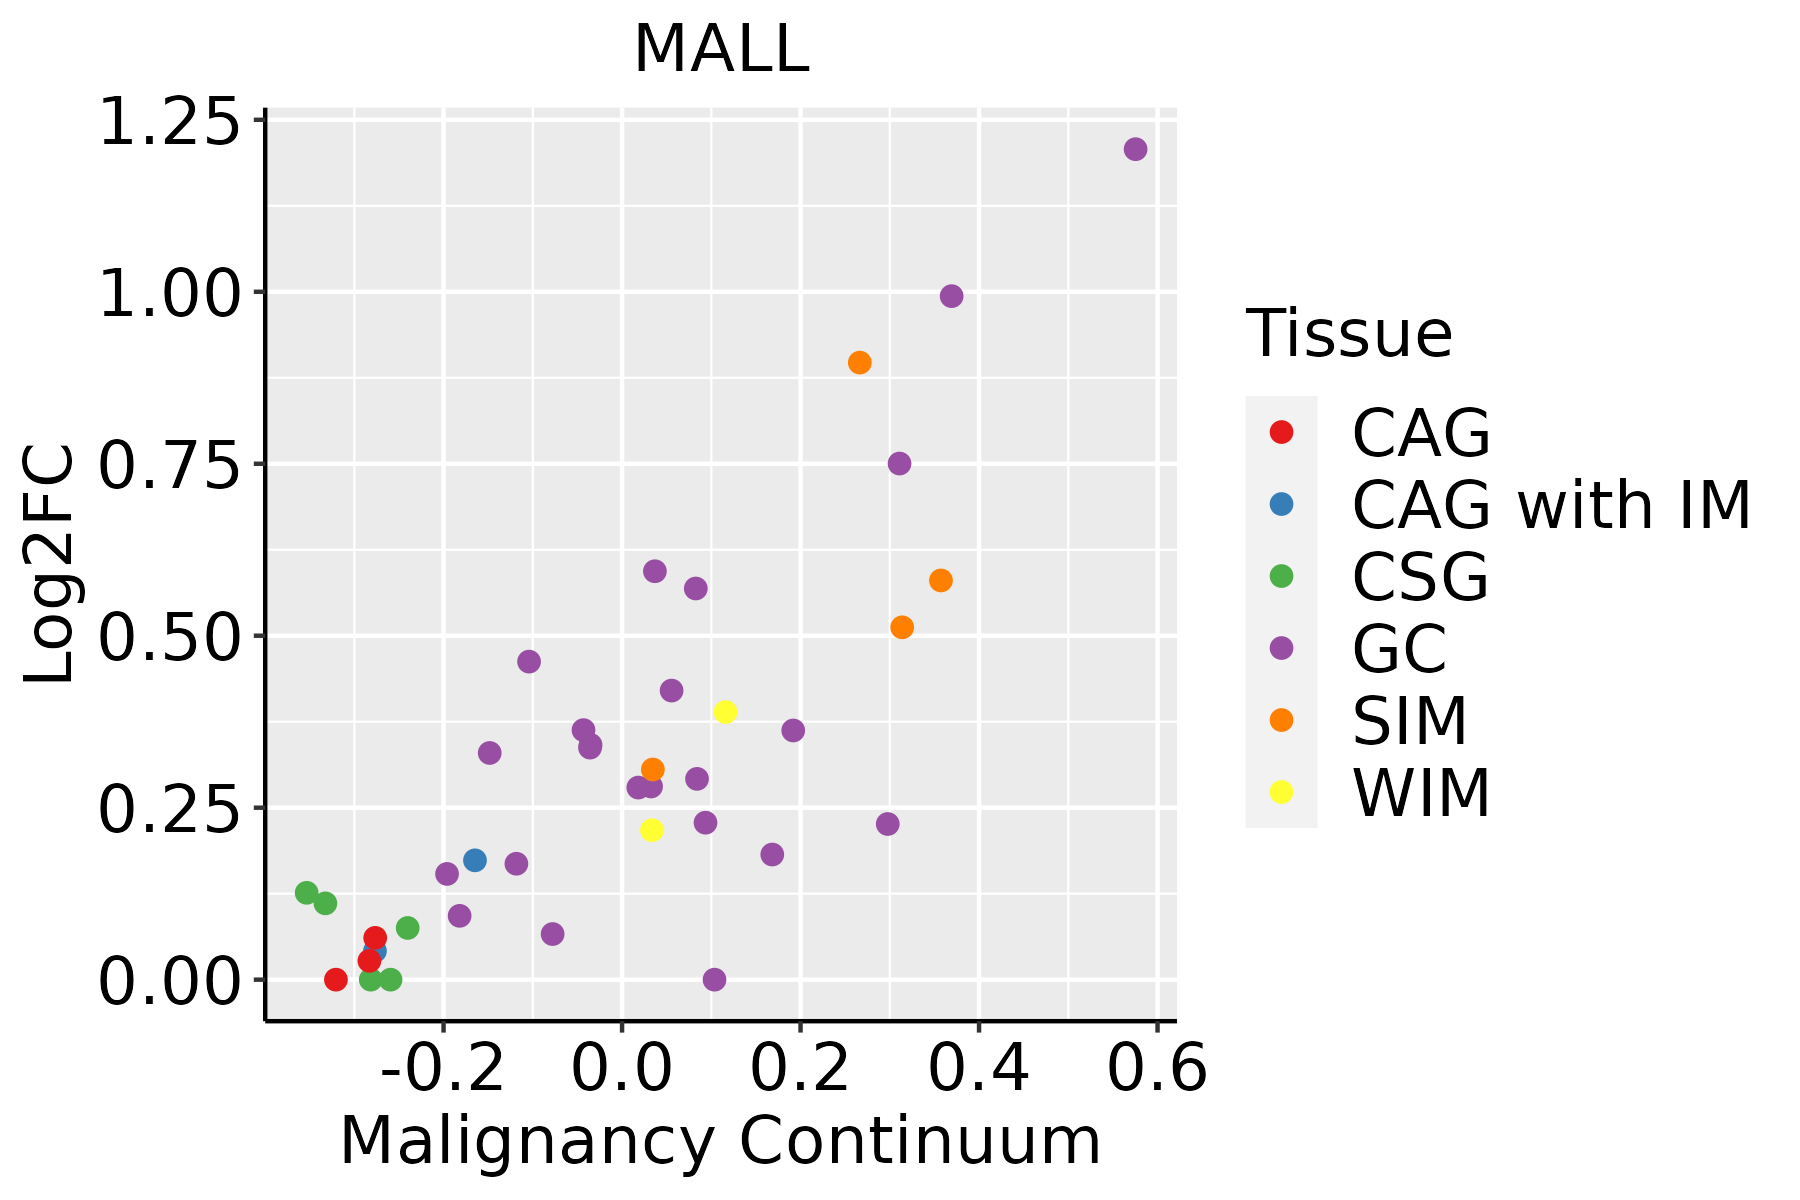 | CAG: Chronic atrophic gastritis |
| CAG with IM: Chronic atrophic gastritis with intestinal metaplasia | ||
| CSG: Chronic superficial gastritis | ||
| GC: Gastric cancer | ||
| SIM: Severe intestinal metaplasia | ||
| WIM: Wild intestinal metaplasia | ||
| Liver | 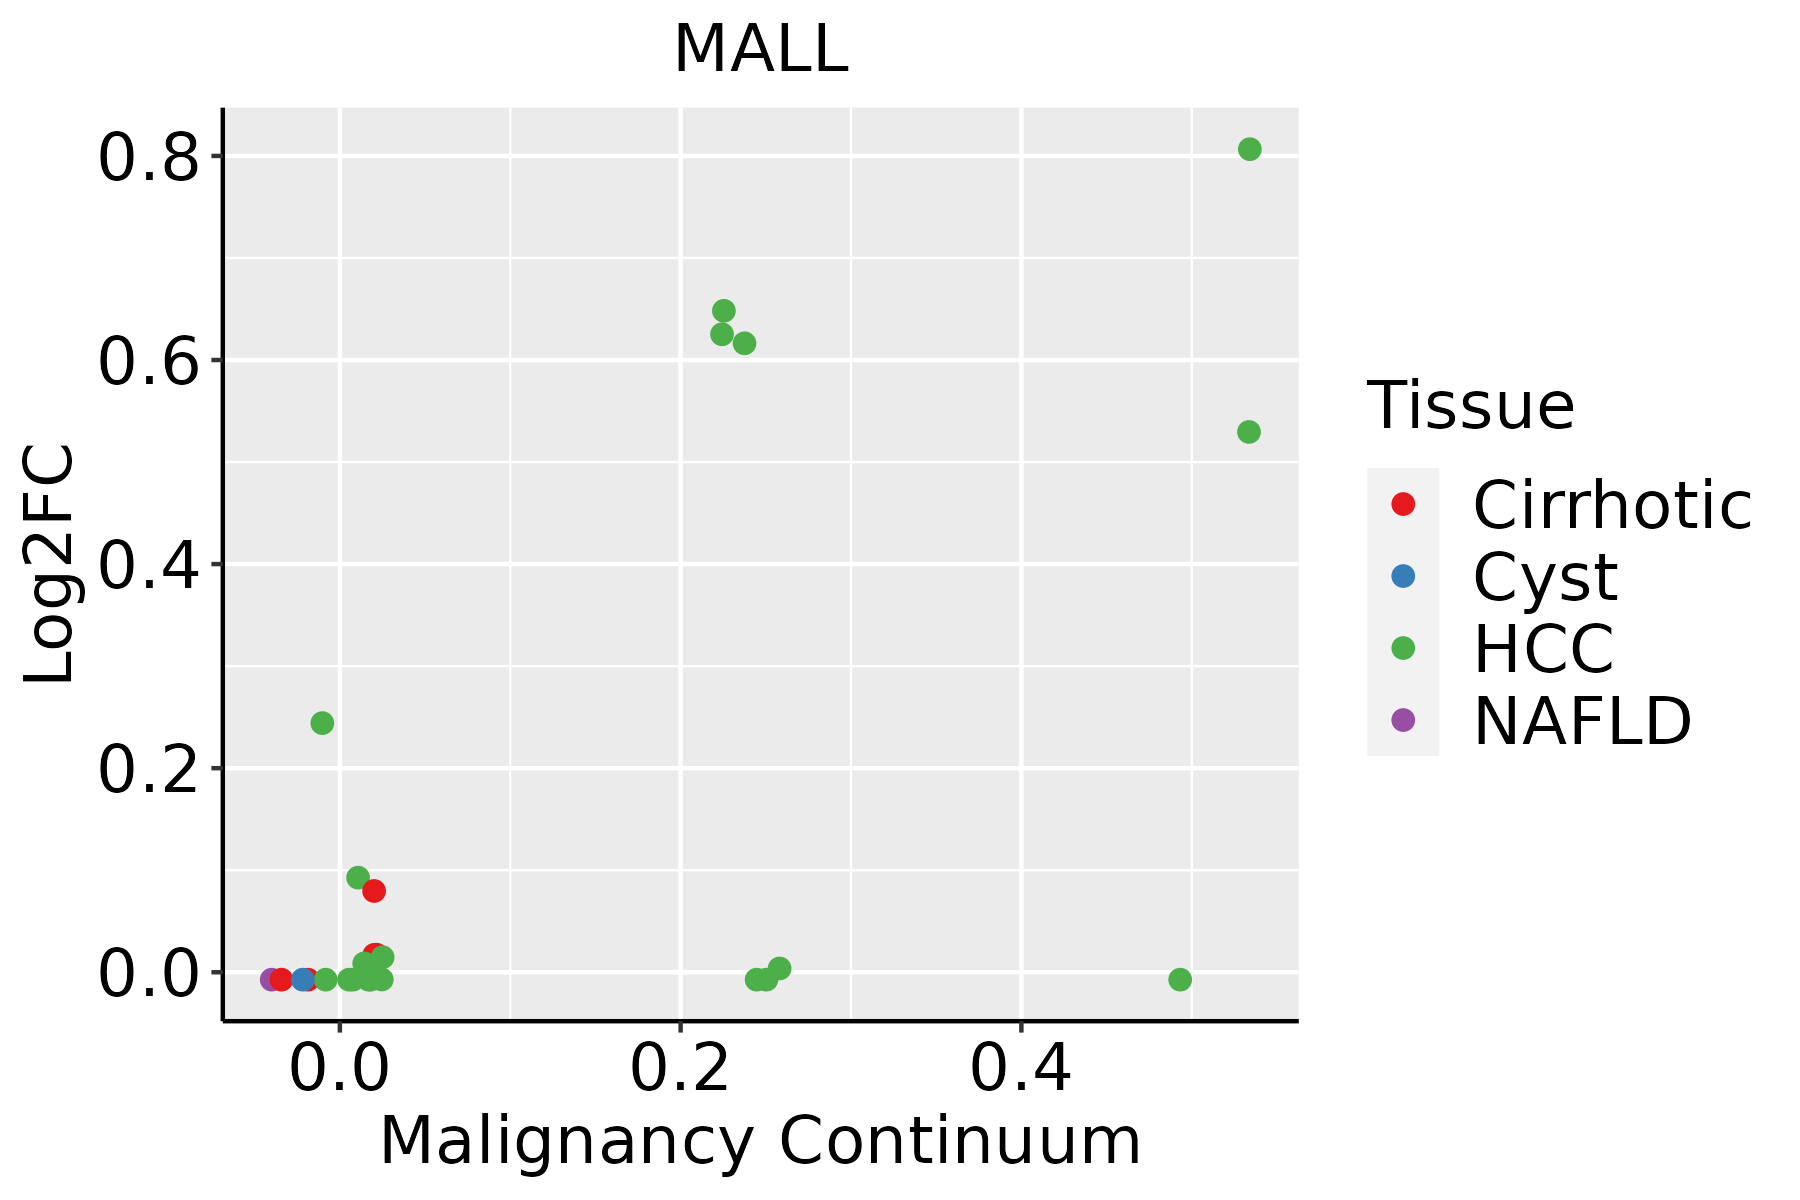 | HCC: Hepatocellular carcinoma |
| NAFLD: Non-alcoholic fatty liver disease | ||
| Lung | 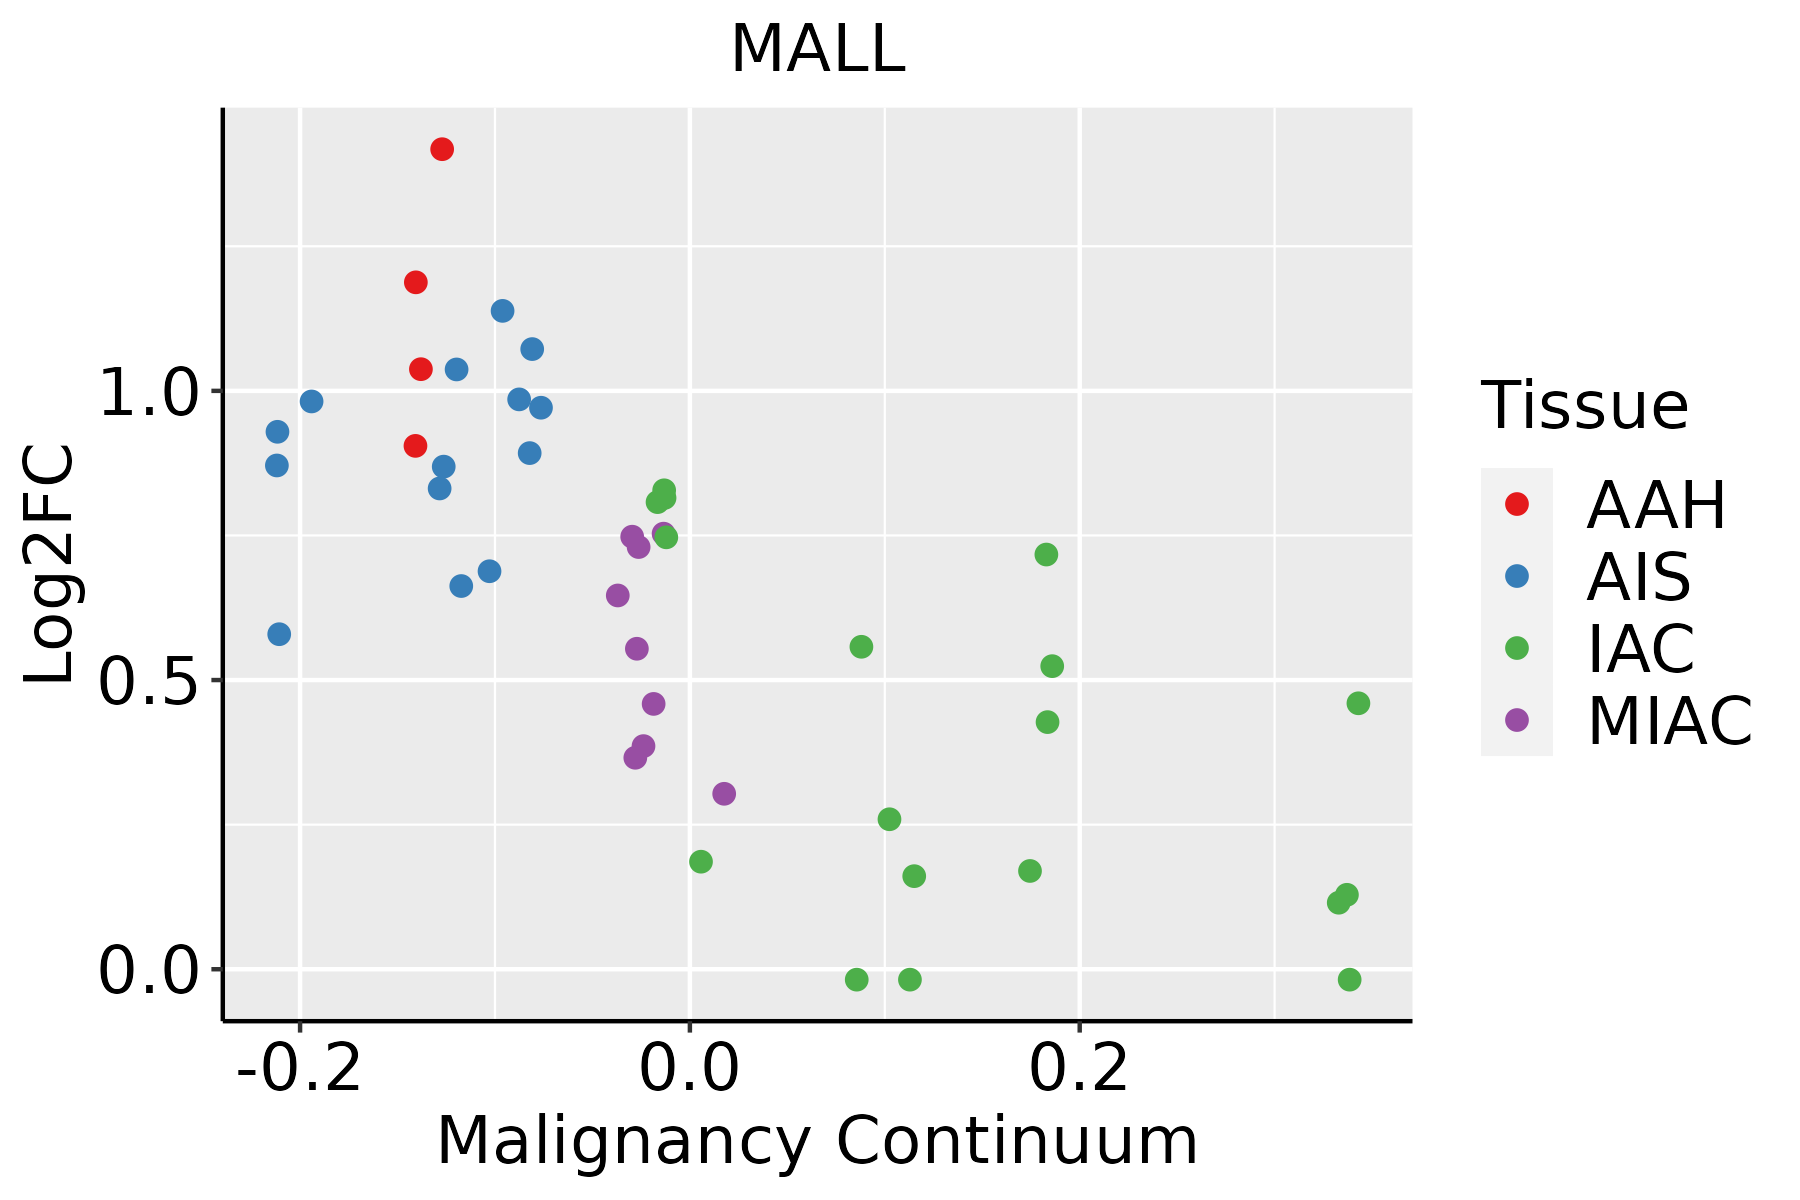 | AAH: Atypical adenomatous hyperplasia |
| AIS: Adenocarcinoma in situ | ||
| IAC: Invasive lung adenocarcinoma | ||
| MIA: Minimally invasive adenocarcinoma | ||
| Oral Cavity | 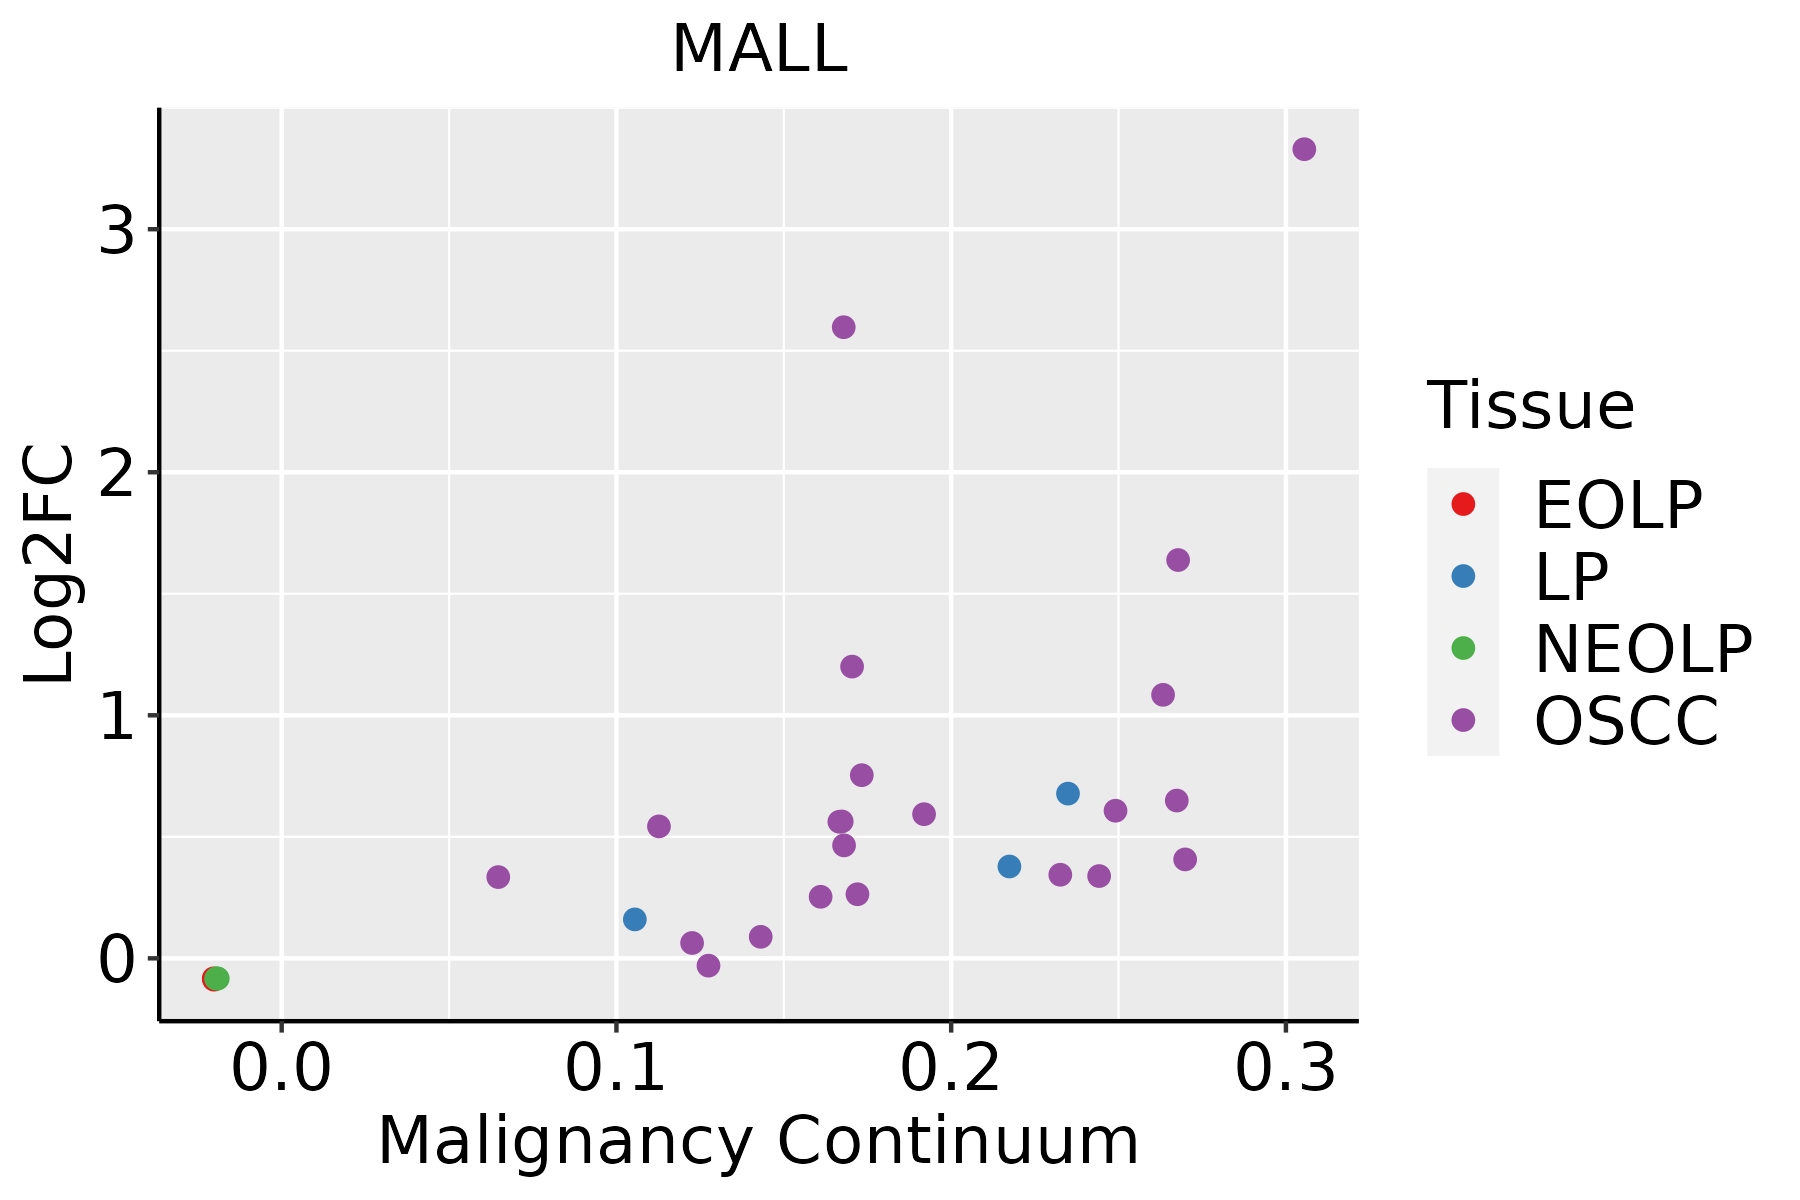 | EOLP: Erosive Oral lichen planus |
| LP: leukoplakia | ||
| NEOLP: Non-erosive oral lichen planus | ||
| OSCC: Oral squamous cell carcinoma | ||
| Prostate | 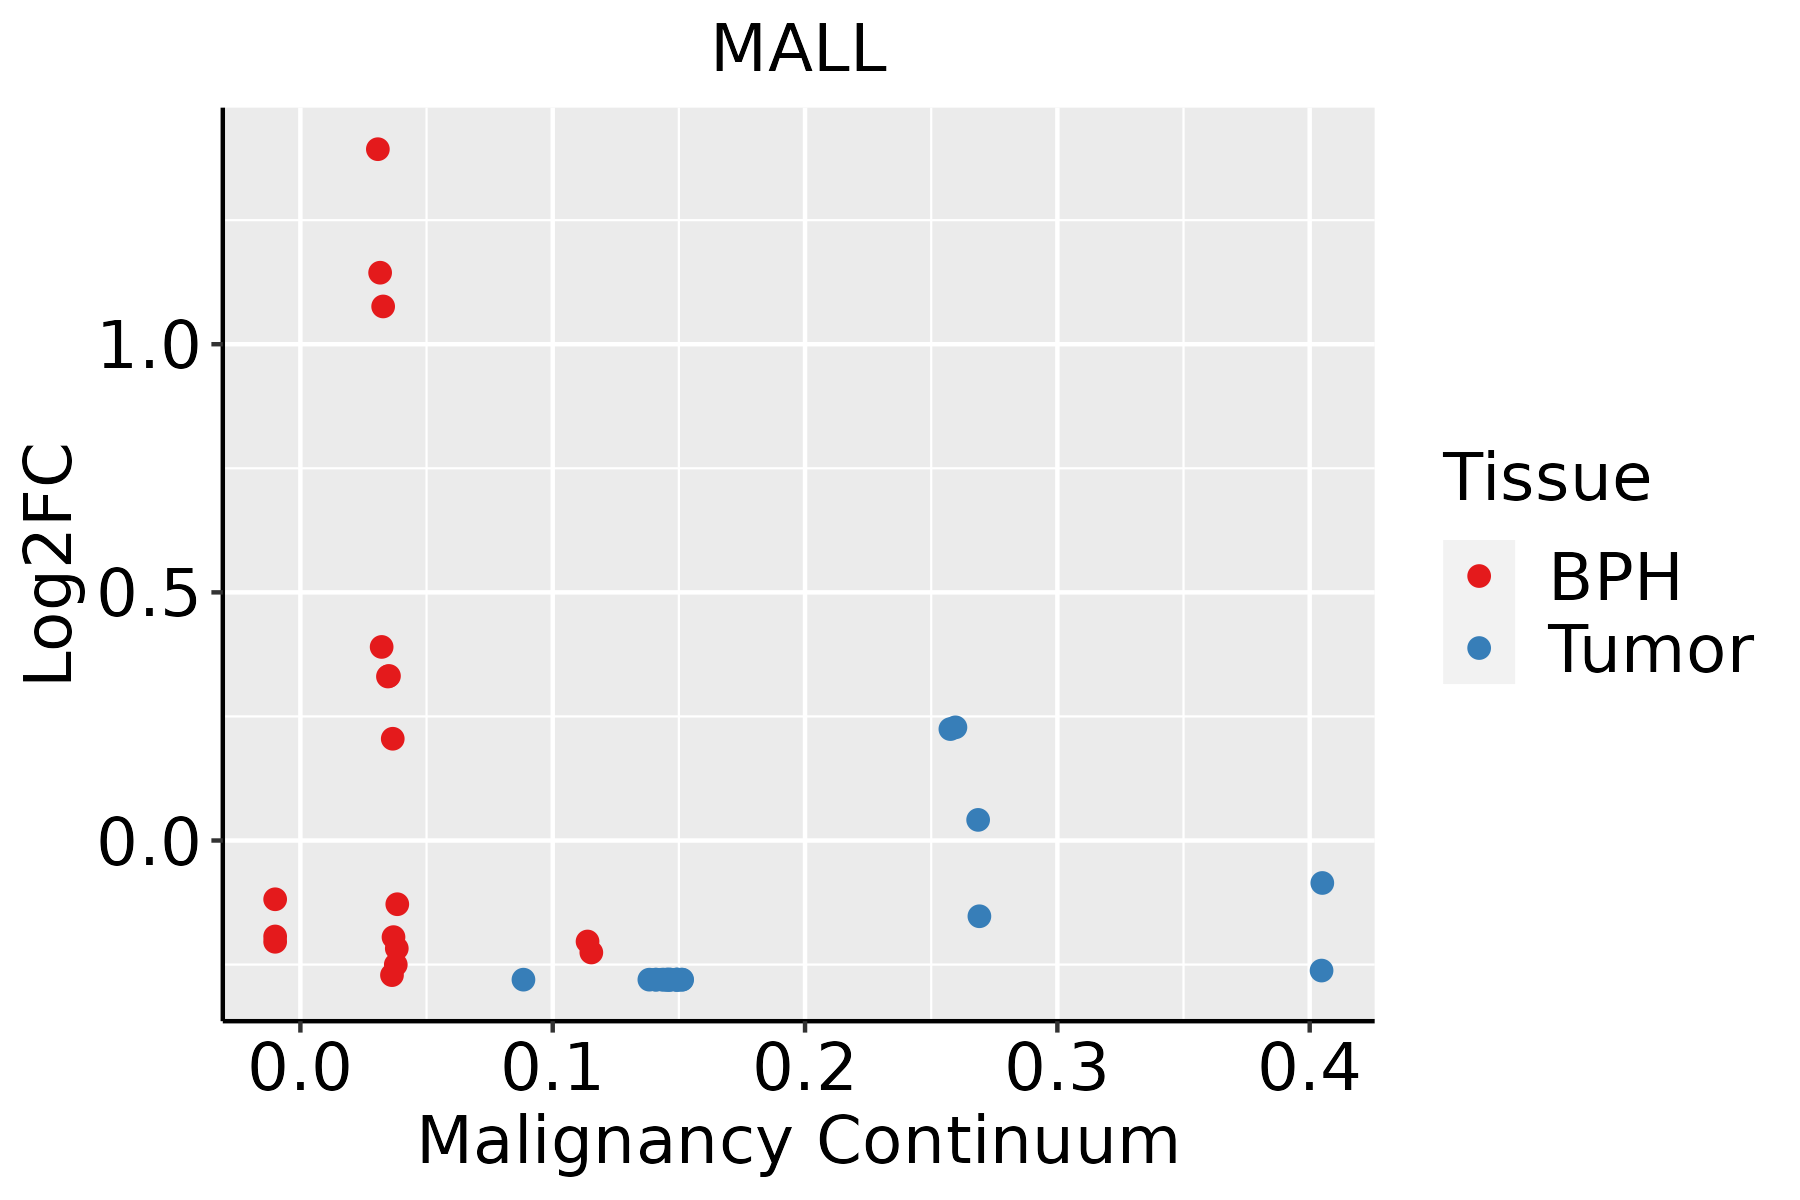 | BPH: Benign Prostatic Hyperplasia |
| Skin | 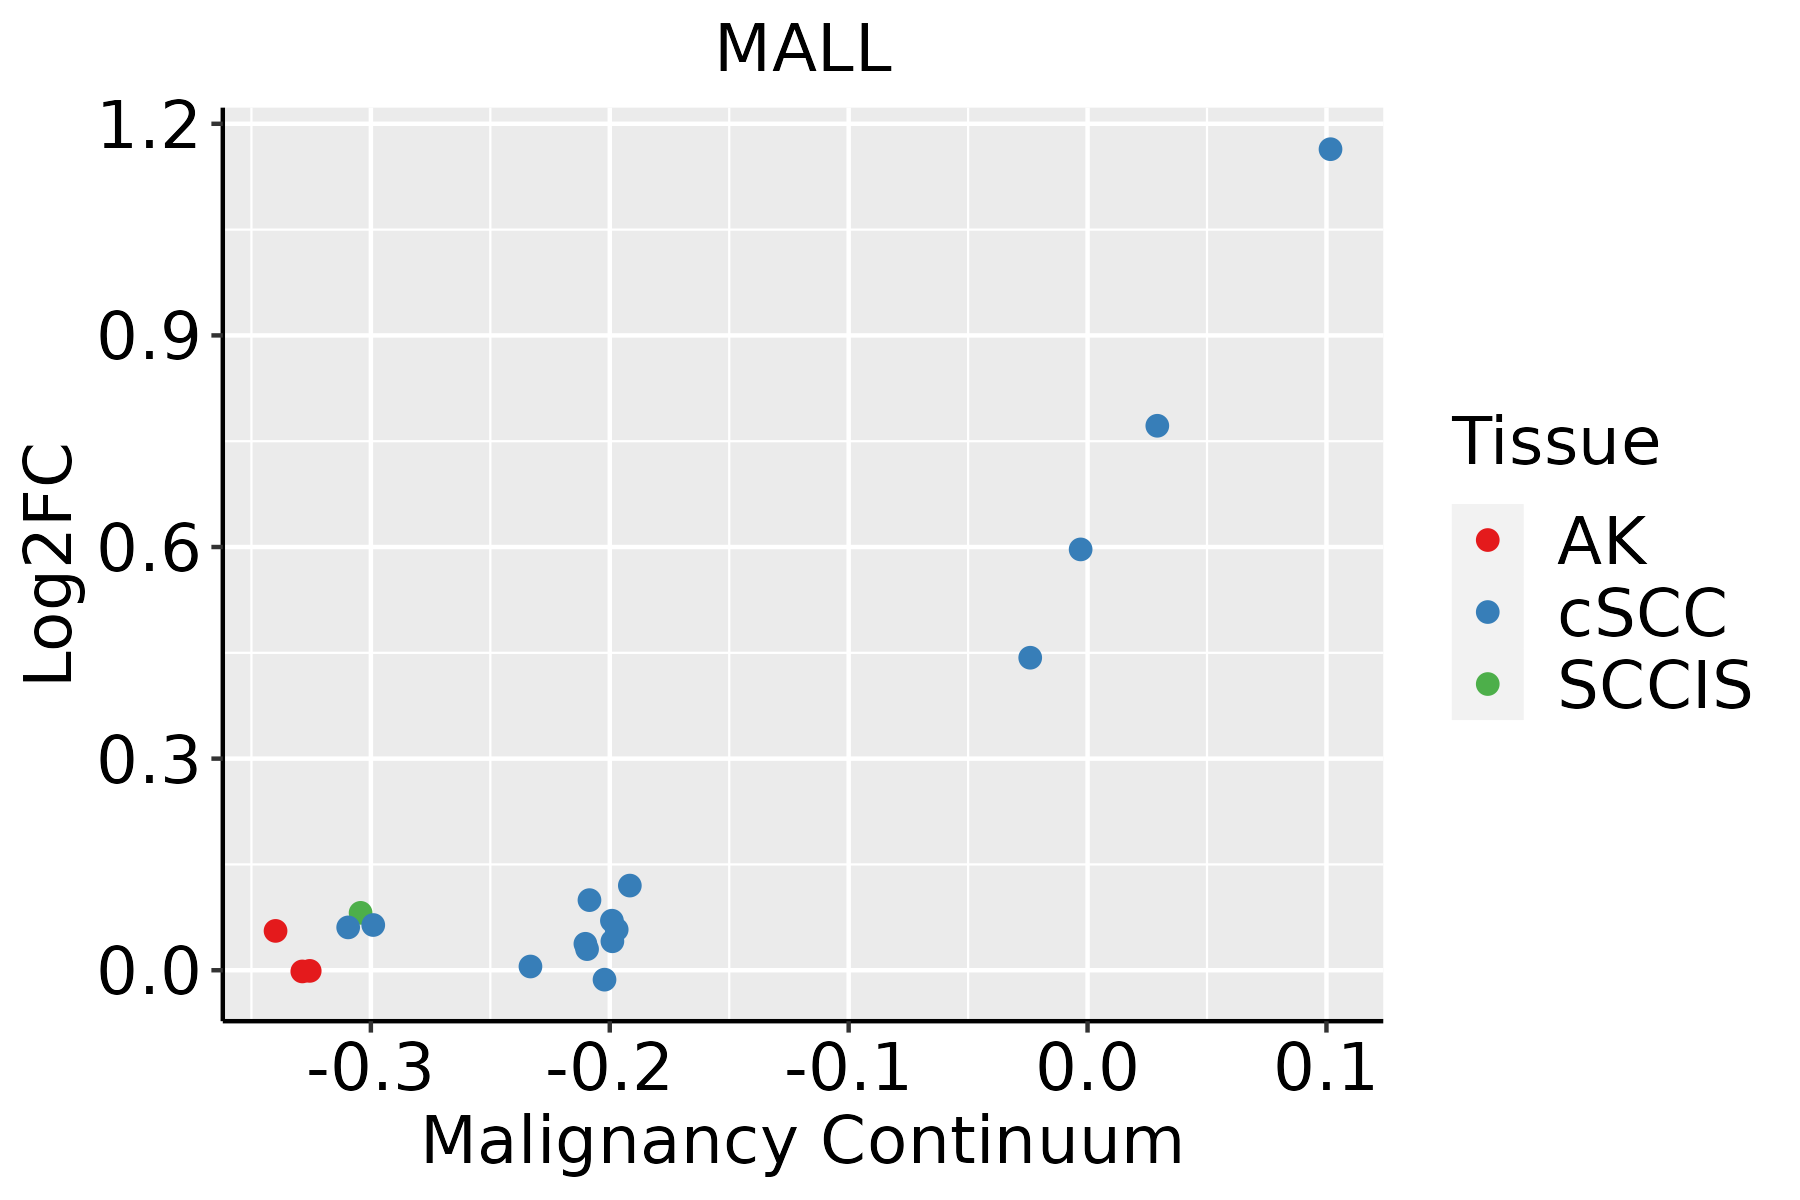 | AK: Actinic keratosis |
| cSCC: Cutaneous squamous cell carcinoma | ||
| SCCIS:squamous cell carcinoma in situ | ||
| Thyroid | 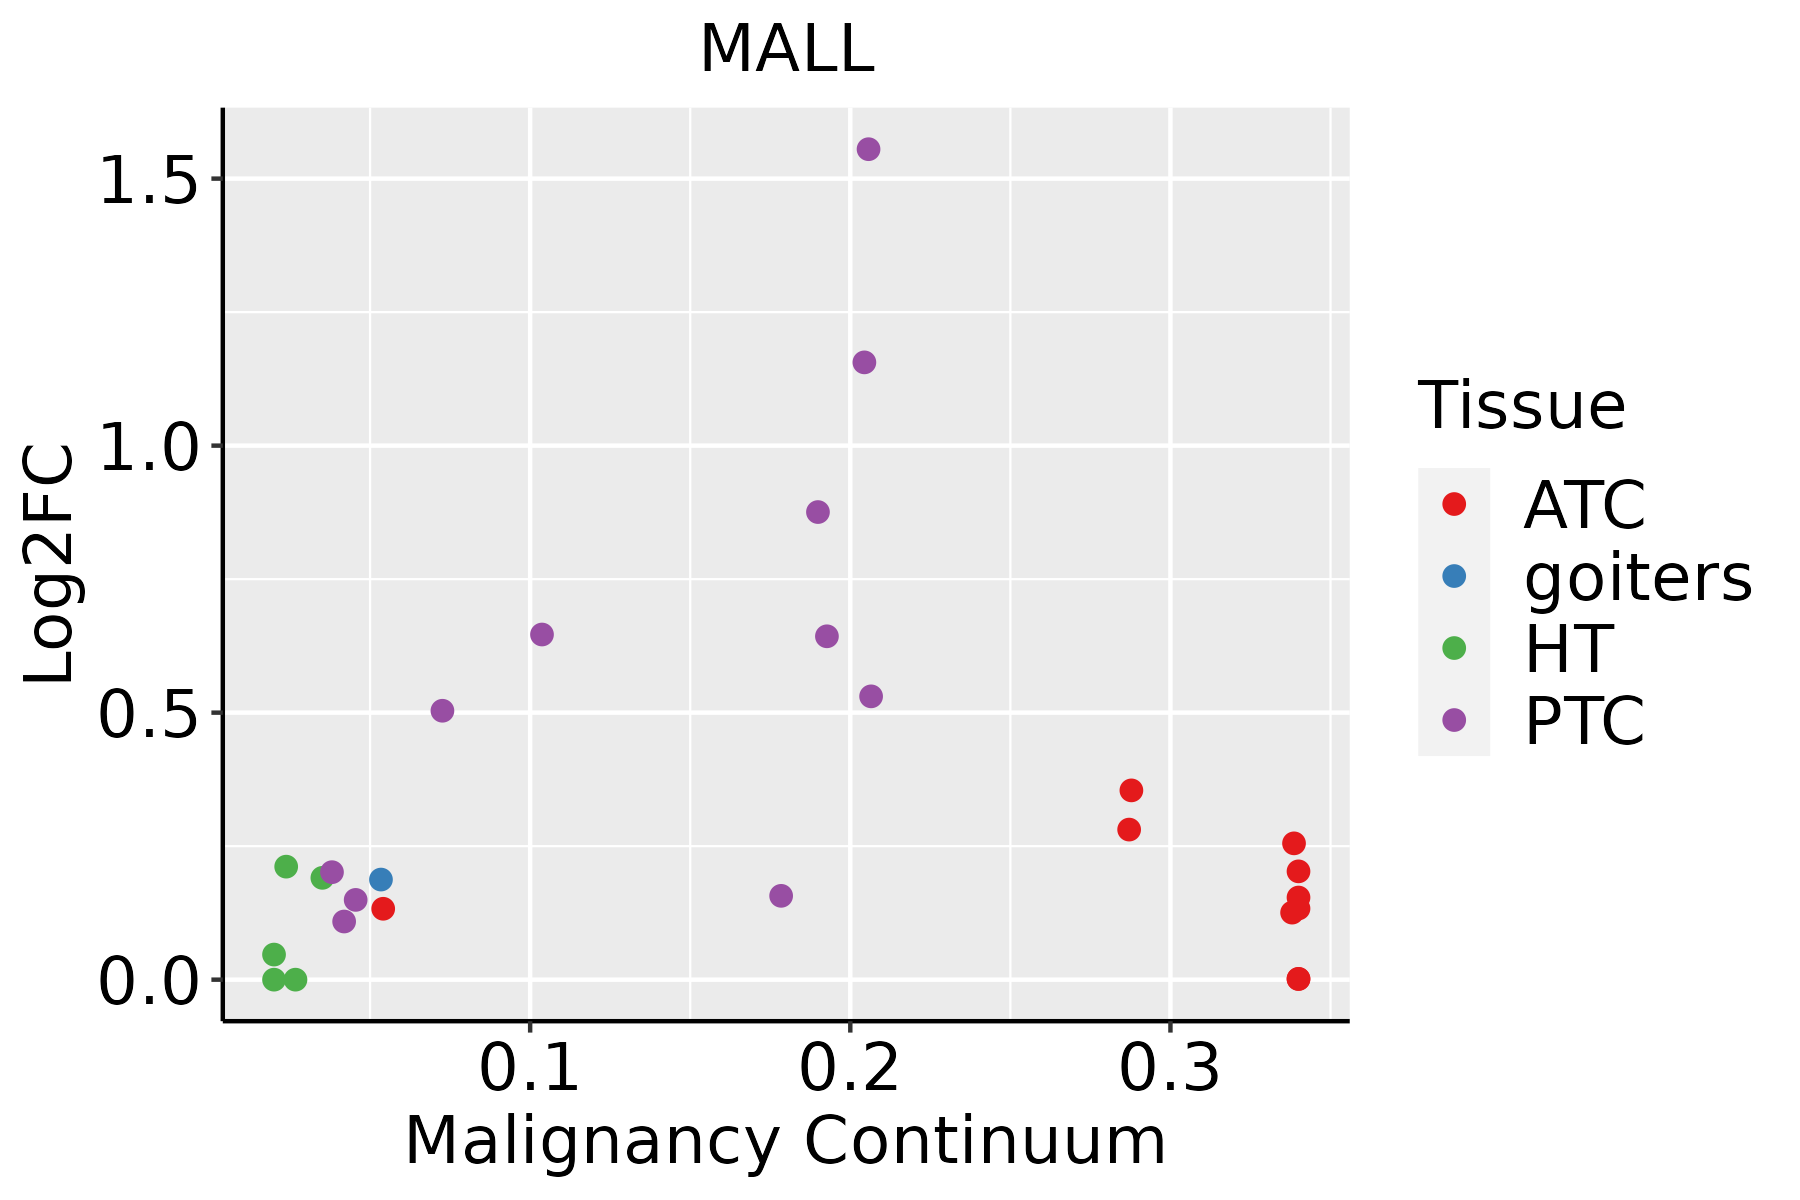 | ATC: Anaplastic thyroid cancer |
| HT: Hashimoto's thyroiditis | ||
| PTC: Papillary thyroid cancer |
| ∗log2FC in expression of this searched gene in stem-like cells from each diseased tissue sample relative to stem-like cells in normal samples in each tissue plotted against the malignancy continuum. Samples are colored based on if they are from different disease stage. |
Top |
Malignant transformation related pathway analysis |
| Find out the enriched GO biological processes and KEGG pathways involved in transition from healthy to precancer to cancer |
| Tissue | Disease Stage | Enriched GO biological Processes |
| Colorectum | AD |  |
| Colorectum | SER |  |
| Colorectum | MSS |  |
| Colorectum | MSI-H |  |
| Colorectum | FAP |  |
| ∗Top 15 enriched GO BP terms are showed in the bar plot of each disease state in each tissue. Each row represents a significant GO biological process which is colored according to the -log10(p.adjust). |
| Page: 1 2 3 4 5 6 7 8 9 |
| GO ID | Tissue | Disease Stage | Description | Gene Ratio | Bg Ratio | pvalue | p.adjust | Count |
| GO:00425524 | Esophagus | ESCC | myelination | 85/8552 | 134/18723 | 2.51e-05 | 2.13e-04 | 85 |
| GO:00072724 | Esophagus | ESCC | ensheathment of neurons | 86/8552 | 136/18723 | 2.68e-05 | 2.24e-04 | 86 |
| GO:00083664 | Esophagus | ESCC | axon ensheathment | 86/8552 | 136/18723 | 2.68e-05 | 2.24e-04 | 86 |
| GO:00550882 | Liver | HCC | lipid homeostasis | 103/7958 | 167/18723 | 4.27e-07 | 7.18e-06 | 103 |
| GO:005509221 | Liver | HCC | sterol homeostasis | 59/7958 | 97/18723 | 2.06e-04 | 1.58e-03 | 59 |
| GO:004263221 | Liver | HCC | cholesterol homeostasis | 58/7958 | 96/18723 | 2.99e-04 | 2.13e-03 | 58 |
| GO:00072721 | Liver | HCC | ensheathment of neurons | 72/7958 | 136/18723 | 8.87e-03 | 3.44e-02 | 72 |
| GO:00083661 | Liver | HCC | axon ensheathment | 72/7958 | 136/18723 | 8.87e-03 | 3.44e-02 | 72 |
| GO:00425521 | Liver | HCC | myelination | 71/7958 | 134/18723 | 9.08e-03 | 3.49e-02 | 71 |
| GO:00072723 | Oral cavity | OSCC | ensheathment of neurons | 72/7305 | 136/18723 | 6.59e-04 | 3.70e-03 | 72 |
| GO:00083663 | Oral cavity | OSCC | axon ensheathment | 72/7305 | 136/18723 | 6.59e-04 | 3.70e-03 | 72 |
| GO:00425523 | Oral cavity | OSCC | myelination | 71/7305 | 134/18723 | 6.93e-04 | 3.86e-03 | 71 |
| GO:00425522 | Prostate | Tumor | myelination | 34/3246 | 134/18723 | 1.19e-02 | 4.85e-02 | 34 |
| GO:004255221 | Skin | cSCC | myelination | 51/4864 | 134/18723 | 1.37e-03 | 8.70e-03 | 51 |
| GO:000727221 | Skin | cSCC | ensheathment of neurons | 51/4864 | 136/18723 | 1.99e-03 | 1.19e-02 | 51 |
| GO:000836621 | Skin | cSCC | axon ensheathment | 51/4864 | 136/18723 | 1.99e-03 | 1.19e-02 | 51 |
| GO:0042632 | Stomach | GC | cholesterol homeostasis | 17/1159 | 96/18723 | 7.61e-05 | 1.64e-03 | 17 |
| GO:0055092 | Stomach | GC | sterol homeostasis | 17/1159 | 97/18723 | 8.70e-05 | 1.81e-03 | 17 |
| GO:0055088 | Stomach | GC | lipid homeostasis | 24/1159 | 167/18723 | 9.86e-05 | 2.00e-03 | 24 |
| GO:00426321 | Stomach | WIM | cholesterol homeostasis | 8/426 | 96/18723 | 1.56e-03 | 2.06e-02 | 8 |
| Page: 1 2 |
| Pathway ID | Tissue | Disease Stage | Description | Gene Ratio | Bg Ratio | pvalue | p.adjust | qvalue | Count |
| Page: 1 |
Top |
Cell-cell communication analysis |
| Identification of potential cell-cell interactions between two cell types and their ligand-receptor pairs for different disease states |
| Ligand | Receptor | LRpair | Pathway | Tissue | Disease Stage |
| Page: 1 |
Top |
Single-cell gene regulatory network inference analysis |
| Find out the significant the regulons (TFs) and the target genes of each regulon across cell types for different disease states |
| TF | Cell Type | Tissue | Disease Stage | Target Gene | RSS | Regulon Activity |
| ∗The dot plots of a searched regulon are shown for all cell subpopulations in each disease state of each tissue based on the regulon specific score inferred using pySCENIC and by calculating the average expression. |
| Page: 1 |
Top |
Somatic mutation of malignant transformation related genes |
| Annotation of somatic variants for genes involved in malignant transformation |
| Hugo Symbol | Variant Class | Variant Classification | dbSNP RS | HGVSc | HGVSp | HGVSp Short | SWISSPROT | BIOTYPE | SIFT | PolyPhen | Tumor Sample Barcode | Tissue | Histology | Sex | Age | Stage | Therapy Types | Drugs | Outcome |
| MALL | insertion | Frame_Shift_Ins | novel | c.21_22insATCTGCAGAGCTGTGCGTATGCA | p.Ala8IlefsTer36 | p.A8Ifs*36 | Q13021 | protein_coding | TCGA-A2-A0EY-01 | Breast | breast invasive carcinoma | Female | <65 | I/II | Chemotherapy | adriamycin | SD | ||
| MALL | insertion | Frame_Shift_Ins | novel | c.19_20insTC | p.Pro7LeufsTer30 | p.P7Lfs*30 | Q13021 | protein_coding | TCGA-A2-A0EY-01 | Breast | breast invasive carcinoma | Female | <65 | I/II | Chemotherapy | adriamycin | SD | ||
| MALL | SNV | Missense_Mutation | rs764376036 | c.197C>T | p.Ser66Leu | p.S66L | Q13021 | protein_coding | tolerated(0.14) | benign(0.028) | TCGA-AM-5821-01 | Colorectum | colon adenocarcinoma | Female | >=65 | I/II | Unknown | Unknown | SD |
| MALL | SNV | Missense_Mutation | rs763390418 | c.154T>C | p.Tyr52His | p.Y52H | Q13021 | protein_coding | tolerated(0.54) | benign(0.155) | TCGA-EI-6917-01 | Colorectum | rectum adenocarcinoma | Male | <65 | III/IV | Chemotherapy | 5fluorouracil+oxaciplatina+l-folinian | SD |
| MALL | SNV | Missense_Mutation | c.202N>A | p.Leu68Ile | p.L68I | Q13021 | protein_coding | tolerated(0.22) | possibly_damaging(0.48) | TCGA-AX-A05Z-01 | Endometrium | uterine corpus endometrioid carcinoma | Female | <65 | III/IV | Chemotherapy | adriamycin | SD | |
| MALL | SNV | Missense_Mutation | c.117N>A | p.Phe39Leu | p.F39L | Q13021 | protein_coding | tolerated(0.16) | benign(0.025) | TCGA-BS-A0UF-01 | Endometrium | uterine corpus endometrioid carcinoma | Female | >=65 | I/II | Unknown | Unknown | SD | |
| MALL | SNV | Missense_Mutation | c.245A>G | p.Tyr82Cys | p.Y82C | Q13021 | protein_coding | deleterious(0) | probably_damaging(0.923) | TCGA-BS-A0UV-01 | Endometrium | uterine corpus endometrioid carcinoma | Female | <65 | III/IV | Unknown | Unknown | SD | |
| MALL | SNV | Missense_Mutation | novel | c.268G>A | p.Val90Ile | p.V90I | Q13021 | protein_coding | tolerated(0.27) | benign(0.019) | TCGA-EO-A22R-01 | Endometrium | uterine corpus endometrioid carcinoma | Female | <65 | I/II | Unknown | Unknown | SD |
| MALL | SNV | Missense_Mutation | c.117C>A | p.Phe39Leu | p.F39L | Q13021 | protein_coding | tolerated(0.16) | benign(0.025) | TCGA-EO-A3B0-01 | Endometrium | uterine corpus endometrioid carcinoma | Female | <65 | III/IV | Unknown | Unknown | SD | |
| MALL | SNV | Missense_Mutation | c.146N>G | p.His49Arg | p.H49R | Q13021 | protein_coding | tolerated(0.77) | benign(0) | TCGA-21-1076-01 | Lung | lung squamous cell carcinoma | Female | <65 | I/II | Unknown | Unknown | PD |
| Page: 1 |
Top |
Related drugs of malignant transformation related genes |
| Identification of chemicals and drugs interact with genes involved in malignant transfromation |
| (DGIdb 4.0) |
| Entrez ID | Symbol | Category | Interaction Types | Drug Claim Name | Drug Name | PMIDs |
| Page: 1 |

Copyright 2023-Present -The University of Texas Health Science Center at Houston |