
|
|||||
|
 | |
| |
| |
| |
| |
| |
|
Gene: HADHB |
Gene summary for HADHB |
| Gene information | Species | Human | Gene symbol | HADHB | Gene ID | 3032 |
| Gene name | hydroxyacyl-CoA dehydrogenase trifunctional multienzyme complex subunit beta | |
| Gene Alias | ECHB | |
| Cytomap | 2p23.3 | |
| Gene Type | protein-coding | GO ID | GO:0006082 | UniProtAcc | P55084 |
Top |
Malignant transformation analysis |
| Identification of the aberrant gene expression in precancerous and cancerous lesions by comparing the gene expression of stem-like cells in diseased tissues with normal stem cells |
| Entrez ID | Symbol | Replicates | Species | Organ | Tissue | Adj P-value | Log2FC | Malignancy |
| 3032 | HADHB | PTC05 | Human | Thyroid | PTC | 4.00e-21 | 9.45e-01 | 0.2065 |
| 3032 | HADHB | PTC06 | Human | Thyroid | PTC | 3.44e-27 | 6.83e-01 | 0.2057 |
| 3032 | HADHB | PTC07 | Human | Thyroid | PTC | 6.50e-32 | 5.16e-01 | 0.2044 |
| 3032 | HADHB | ATC09 | Human | Thyroid | ATC | 4.59e-11 | -8.94e-03 | 0.2871 |
| 3032 | HADHB | ATC11 | Human | Thyroid | ATC | 4.49e-04 | 4.24e-01 | 0.3386 |
| 3032 | HADHB | ATC12 | Human | Thyroid | ATC | 6.29e-10 | 1.44e-01 | 0.34 |
| 3032 | HADHB | ATC13 | Human | Thyroid | ATC | 2.06e-22 | 3.28e-01 | 0.34 |
| 3032 | HADHB | ATC1 | Human | Thyroid | ATC | 3.43e-10 | 2.00e-02 | 0.2878 |
| 3032 | HADHB | ATC2 | Human | Thyroid | ATC | 1.80e-08 | 7.78e-01 | 0.34 |
| 3032 | HADHB | ATC3 | Human | Thyroid | ATC | 9.00e-08 | 2.30e-01 | 0.338 |
| 3032 | HADHB | ATC4 | Human | Thyroid | ATC | 7.52e-13 | 3.05e-01 | 0.34 |
| 3032 | HADHB | ATC5 | Human | Thyroid | ATC | 1.11e-19 | 3.85e-01 | 0.34 |
| Page: 1 2 3 4 5 6 7 8 |
| Tissue | Expression Dynamics | Abbreviation |
| Colorectum (GSE201348) |  | FAP: Familial adenomatous polyposis |
| CRC: Colorectal cancer | ||
| Colorectum (HTA11) |  | AD: Adenomas |
| SER: Sessile serrated lesions | ||
| MSI-H: Microsatellite-high colorectal cancer | ||
| MSS: Microsatellite stable colorectal cancer | ||
| Esophagus |  | ESCC: Esophageal squamous cell carcinoma |
| HGIN: High-grade intraepithelial neoplasias | ||
| LGIN: Low-grade intraepithelial neoplasias | ||
| Liver | 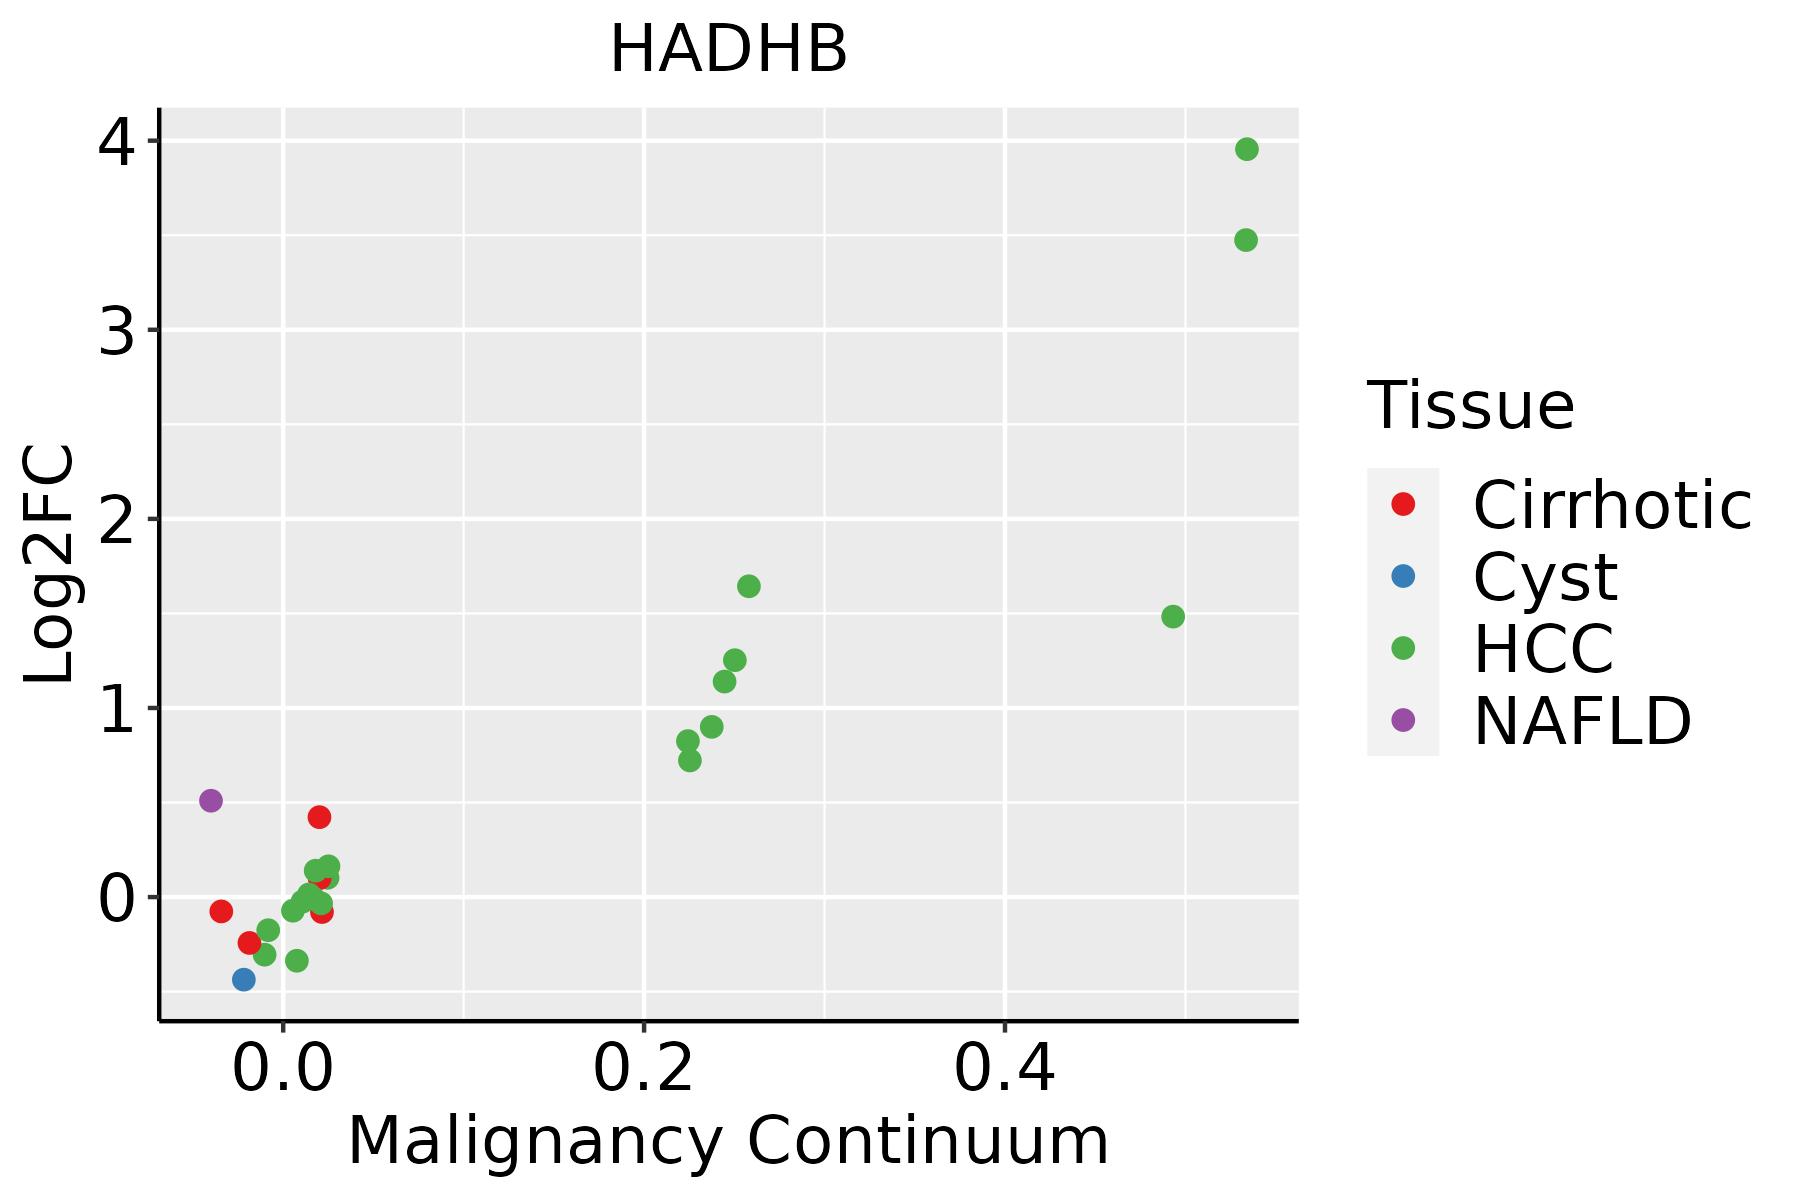 | HCC: Hepatocellular carcinoma |
| NAFLD: Non-alcoholic fatty liver disease | ||
| Oral Cavity | 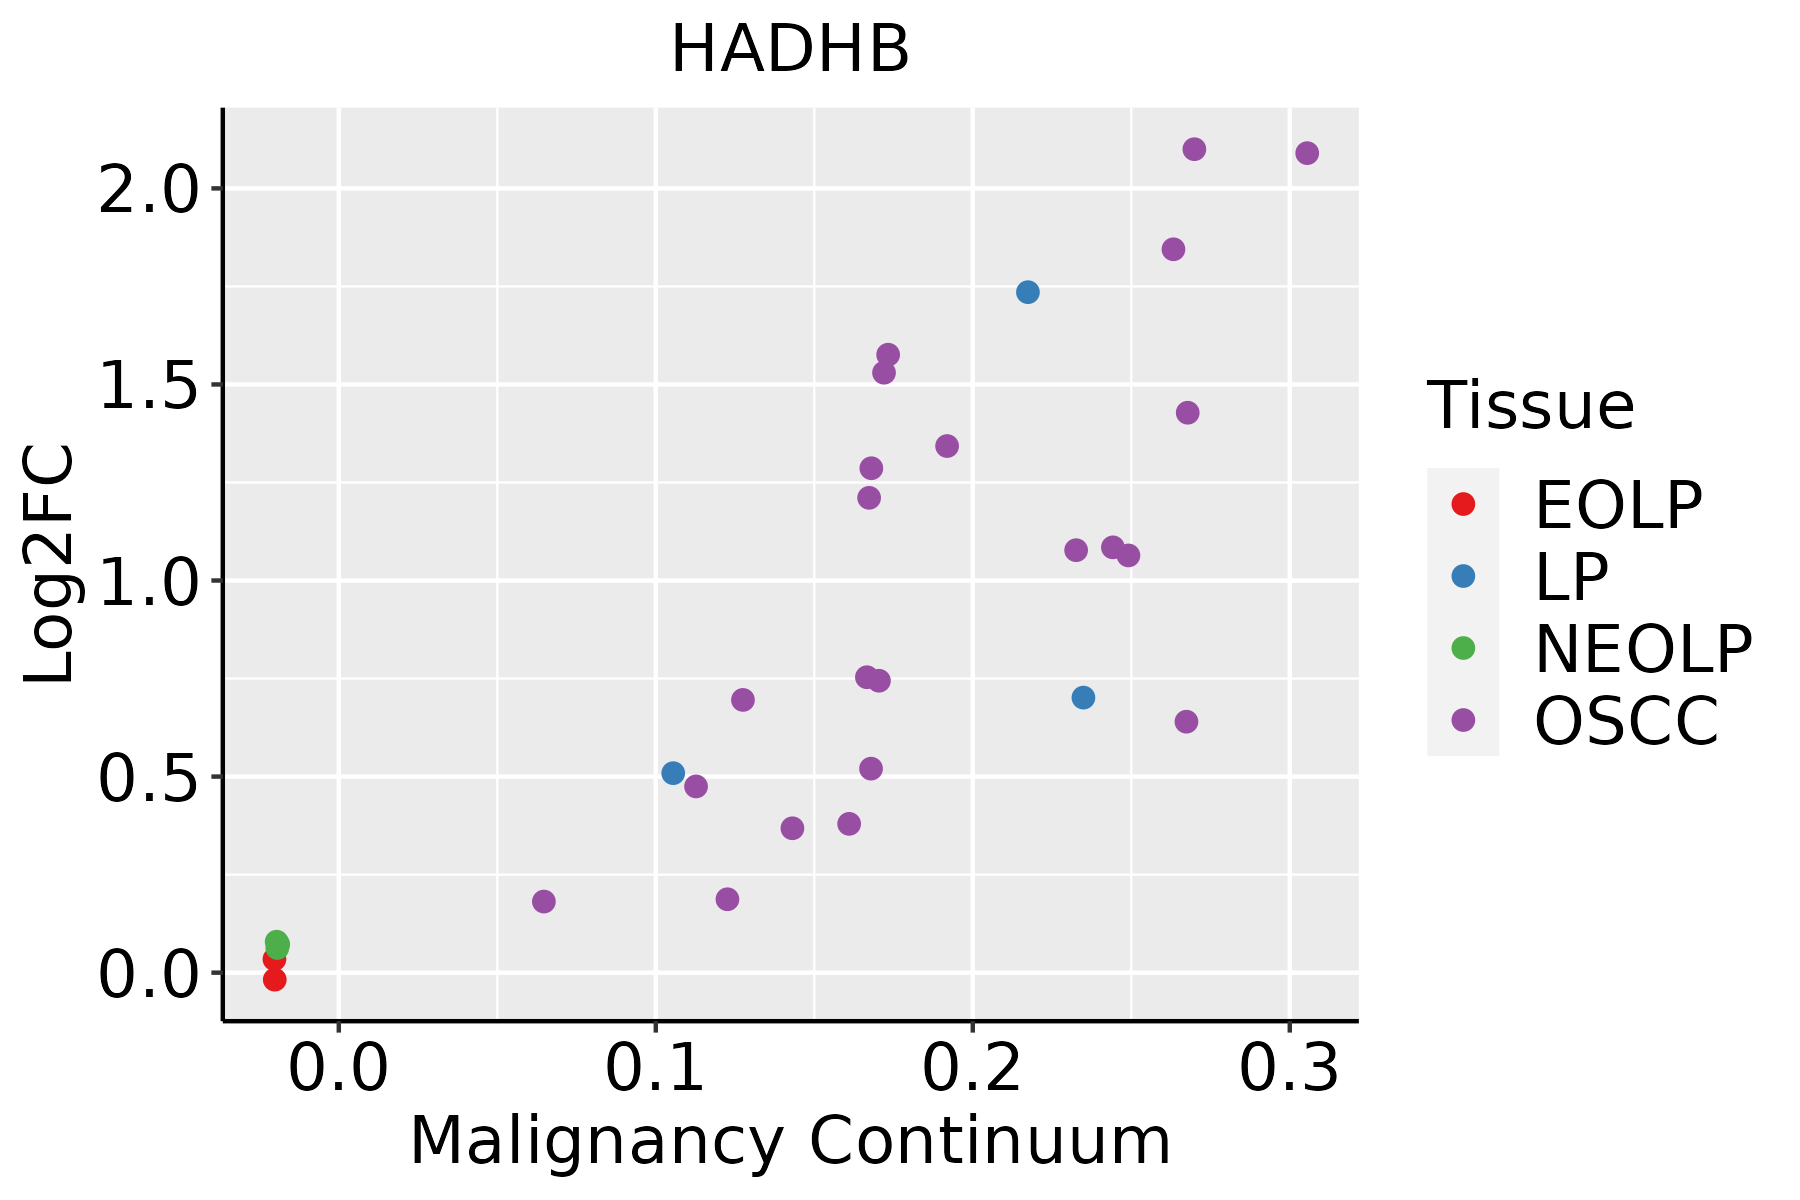 | EOLP: Erosive Oral lichen planus |
| LP: leukoplakia | ||
| NEOLP: Non-erosive oral lichen planus | ||
| OSCC: Oral squamous cell carcinoma | ||
| Prostate | 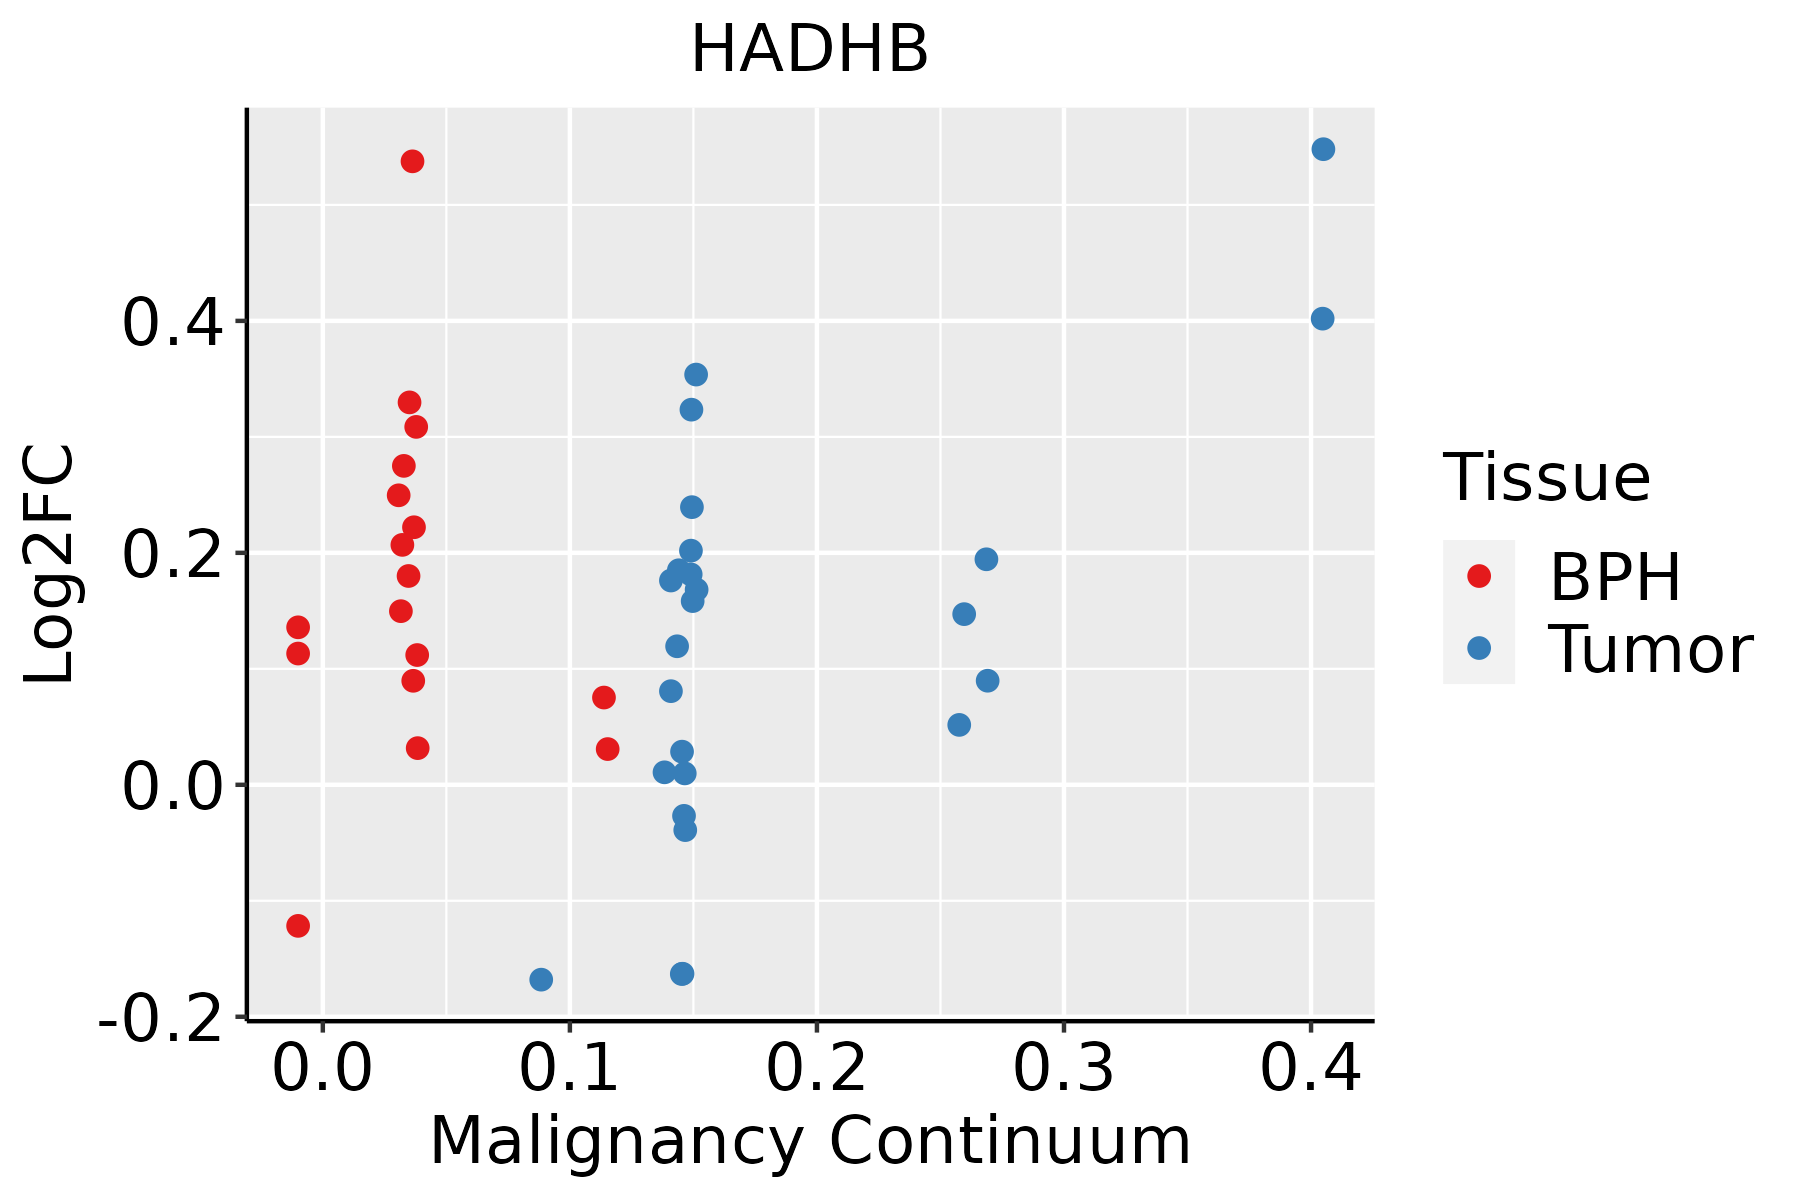 | BPH: Benign Prostatic Hyperplasia |
| Skin | 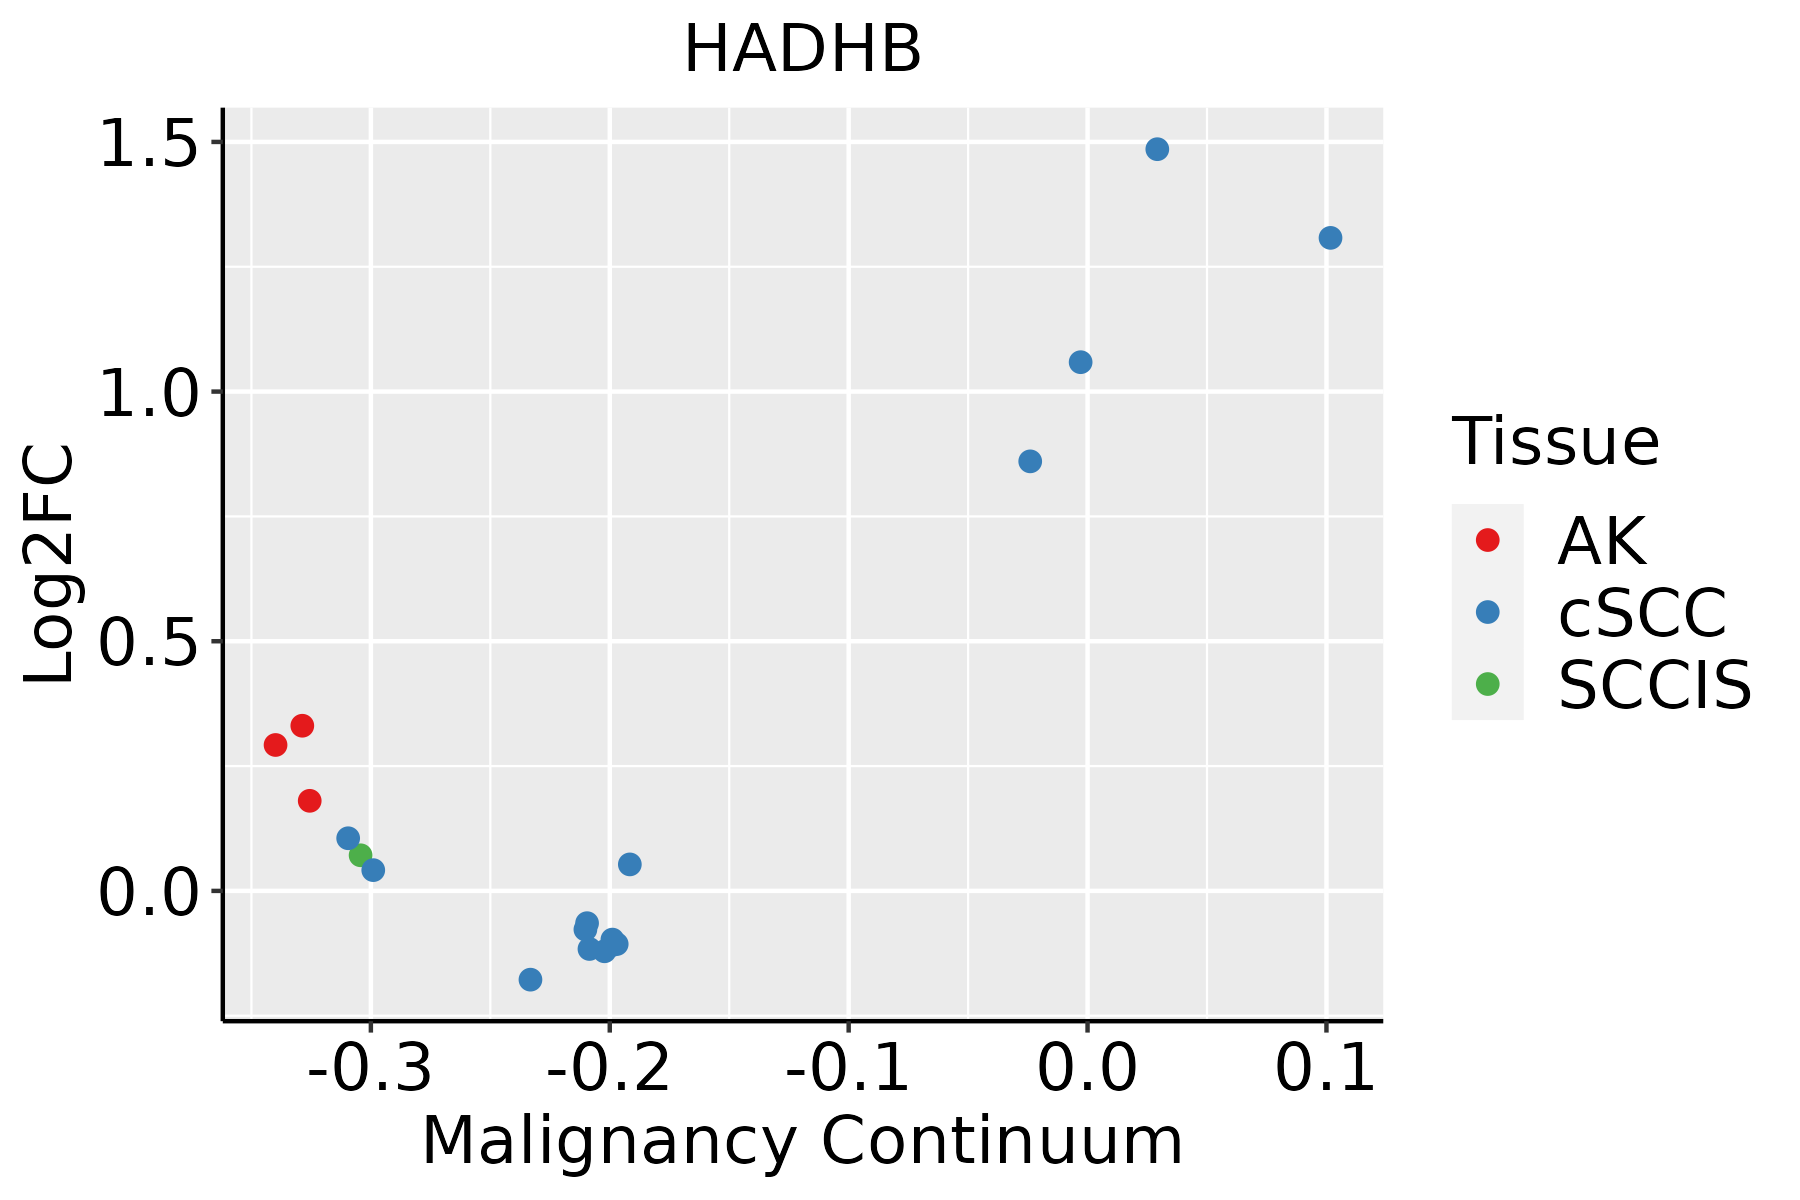 | AK: Actinic keratosis |
| cSCC: Cutaneous squamous cell carcinoma | ||
| SCCIS:squamous cell carcinoma in situ | ||
| Thyroid | 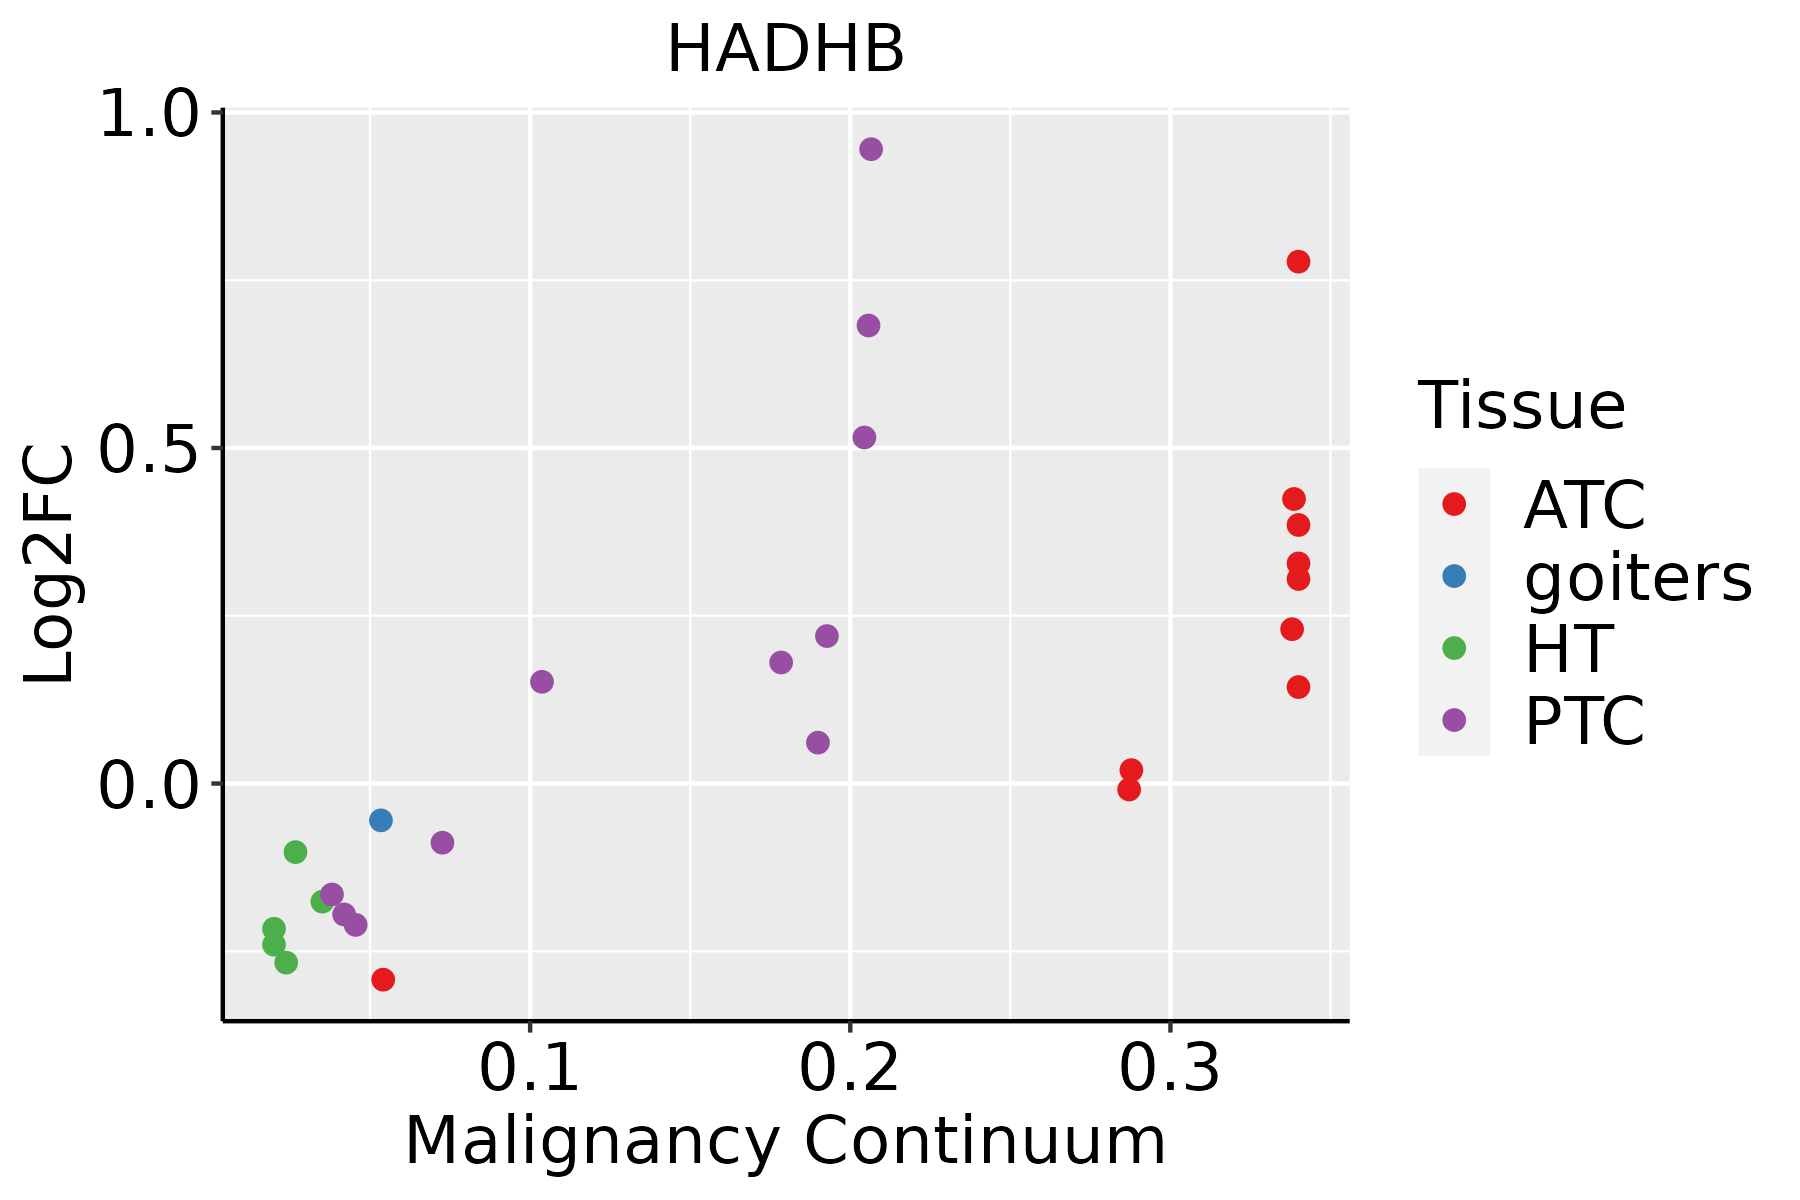 | ATC: Anaplastic thyroid cancer |
| HT: Hashimoto's thyroiditis | ||
| PTC: Papillary thyroid cancer |
| ∗log2FC in expression of this searched gene in stem-like cells from each diseased tissue sample relative to stem-like cells in normal samples in each tissue plotted against the malignancy continuum. Samples are colored based on if they are from different disease stage. |
Top |
Malignant transformation related pathway analysis |
| Find out the enriched GO biological processes and KEGG pathways involved in transition from healthy to precancer to cancer |
| Tissue | Disease Stage | Enriched GO biological Processes |
| Colorectum | AD |  |
| Colorectum | SER |  |
| Colorectum | MSS |  |
| Colorectum | MSI-H |  |
| Colorectum | FAP |  |
| ∗Top 15 enriched GO BP terms are showed in the bar plot of each disease state in each tissue. Each row represents a significant GO biological process which is colored according to the -log10(p.adjust). |
| Page: 1 2 3 4 5 6 7 8 9 |
| GO ID | Tissue | Disease Stage | Description | Gene Ratio | Bg Ratio | pvalue | p.adjust | Count |
| GO:0044282 | Colorectum | AD | small molecule catabolic process | 118/3918 | 376/18723 | 1.05e-06 | 3.55e-05 | 118 |
| GO:0006635 | Colorectum | AD | fatty acid beta-oxidation | 33/3918 | 74/18723 | 3.98e-06 | 1.09e-04 | 33 |
| GO:0009062 | Colorectum | AD | fatty acid catabolic process | 41/3918 | 100/18723 | 4.02e-06 | 1.09e-04 | 41 |
| GO:0019395 | Colorectum | AD | fatty acid oxidation | 40/3918 | 103/18723 | 2.43e-05 | 4.69e-04 | 40 |
| GO:0016042 | Colorectum | AD | lipid catabolic process | 97/3918 | 320/18723 | 4.31e-05 | 7.56e-04 | 97 |
| GO:0006631 | Colorectum | AD | fatty acid metabolic process | 114/3918 | 390/18723 | 5.58e-05 | 9.44e-04 | 114 |
| GO:0072329 | Colorectum | AD | monocarboxylic acid catabolic process | 44/3918 | 122/18723 | 8.05e-05 | 1.28e-03 | 44 |
| GO:0034440 | Colorectum | AD | lipid oxidation | 40/3918 | 108/18723 | 8.52e-05 | 1.32e-03 | 40 |
| GO:0030258 | Colorectum | AD | lipid modification | 67/3918 | 212/18723 | 1.66e-04 | 2.27e-03 | 67 |
| GO:0016054 | Colorectum | AD | organic acid catabolic process | 73/3918 | 240/18723 | 3.20e-04 | 3.81e-03 | 73 |
| GO:0044242 | Colorectum | AD | cellular lipid catabolic process | 66/3918 | 214/18723 | 3.96e-04 | 4.50e-03 | 66 |
| GO:0046395 | Colorectum | AD | carboxylic acid catabolic process | 70/3918 | 236/18723 | 9.06e-04 | 8.71e-03 | 70 |
| GO:00160421 | Colorectum | SER | lipid catabolic process | 77/2897 | 320/18723 | 3.52e-05 | 9.18e-04 | 77 |
| GO:00442821 | Colorectum | SER | small molecule catabolic process | 87/2897 | 376/18723 | 5.31e-05 | 1.27e-03 | 87 |
| GO:00090621 | Colorectum | SER | fatty acid catabolic process | 31/2897 | 100/18723 | 7.09e-05 | 1.61e-03 | 31 |
| GO:00066351 | Colorectum | SER | fatty acid beta-oxidation | 24/2897 | 74/18723 | 2.09e-04 | 3.77e-03 | 24 |
| GO:00723291 | Colorectum | SER | monocarboxylic acid catabolic process | 34/2897 | 122/18723 | 3.27e-04 | 5.22e-03 | 34 |
| GO:00193951 | Colorectum | SER | fatty acid oxidation | 29/2897 | 103/18723 | 7.24e-04 | 9.44e-03 | 29 |
| GO:00442421 | Colorectum | SER | cellular lipid catabolic process | 51/2897 | 214/18723 | 8.60e-04 | 1.05e-02 | 51 |
| GO:00344401 | Colorectum | SER | lipid oxidation | 29/2897 | 108/18723 | 1.63e-03 | 1.72e-02 | 29 |
| Page: 1 2 3 4 5 6 |
| Pathway ID | Tissue | Disease Stage | Description | Gene Ratio | Bg Ratio | pvalue | p.adjust | qvalue | Count |
| hsa00280 | Colorectum | AD | Valine, leucine and isoleucine degradation | 25/2092 | 48/8465 | 3.97e-05 | 3.41e-04 | 2.18e-04 | 25 |
| hsa00071 | Colorectum | AD | Fatty acid degradation | 20/2092 | 43/8465 | 1.50e-03 | 8.69e-03 | 5.54e-03 | 20 |
| hsa002801 | Colorectum | AD | Valine, leucine and isoleucine degradation | 25/2092 | 48/8465 | 3.97e-05 | 3.41e-04 | 2.18e-04 | 25 |
| hsa000711 | Colorectum | AD | Fatty acid degradation | 20/2092 | 43/8465 | 1.50e-03 | 8.69e-03 | 5.54e-03 | 20 |
| hsa000712 | Colorectum | SER | Fatty acid degradation | 15/1580 | 43/8465 | 8.60e-03 | 4.26e-02 | 3.09e-02 | 15 |
| hsa000713 | Colorectum | SER | Fatty acid degradation | 15/1580 | 43/8465 | 8.60e-03 | 4.26e-02 | 3.09e-02 | 15 |
| hsa002802 | Colorectum | MSS | Valine, leucine and isoleucine degradation | 21/1875 | 48/8465 | 6.73e-04 | 4.51e-03 | 2.76e-03 | 21 |
| hsa000714 | Colorectum | MSS | Fatty acid degradation | 17/1875 | 43/8465 | 7.50e-03 | 2.86e-02 | 1.75e-02 | 17 |
| hsa002803 | Colorectum | MSS | Valine, leucine and isoleucine degradation | 21/1875 | 48/8465 | 6.73e-04 | 4.51e-03 | 2.76e-03 | 21 |
| hsa000715 | Colorectum | MSS | Fatty acid degradation | 17/1875 | 43/8465 | 7.50e-03 | 2.86e-02 | 1.75e-02 | 17 |
| hsa002804 | Colorectum | FAP | Valine, leucine and isoleucine degradation | 18/1404 | 48/8465 | 3.94e-04 | 3.06e-03 | 1.86e-03 | 18 |
| hsa000716 | Colorectum | FAP | Fatty acid degradation | 15/1404 | 43/8465 | 2.73e-03 | 1.23e-02 | 7.50e-03 | 15 |
| hsa002805 | Colorectum | FAP | Valine, leucine and isoleucine degradation | 18/1404 | 48/8465 | 3.94e-04 | 3.06e-03 | 1.86e-03 | 18 |
| hsa000717 | Colorectum | FAP | Fatty acid degradation | 15/1404 | 43/8465 | 2.73e-03 | 1.23e-02 | 7.50e-03 | 15 |
| hsa012129 | Esophagus | ESCC | Fatty acid metabolism | 41/4205 | 57/8465 | 5.13e-04 | 1.75e-03 | 8.98e-04 | 41 |
| hsa002809 | Esophagus | ESCC | Valine, leucine and isoleucine degradation | 34/4205 | 48/8465 | 2.34e-03 | 6.54e-03 | 3.35e-03 | 34 |
| hsa0121214 | Esophagus | ESCC | Fatty acid metabolism | 41/4205 | 57/8465 | 5.13e-04 | 1.75e-03 | 8.98e-04 | 41 |
| hsa0028014 | Esophagus | ESCC | Valine, leucine and isoleucine degradation | 34/4205 | 48/8465 | 2.34e-03 | 6.54e-03 | 3.35e-03 | 34 |
| hsa002806 | Liver | NAFLD | Valine, leucine and isoleucine degradation | 20/1043 | 48/8465 | 3.03e-07 | 1.65e-05 | 1.33e-05 | 20 |
| hsa012126 | Liver | NAFLD | Fatty acid metabolism | 17/1043 | 57/8465 | 3.43e-04 | 5.93e-03 | 4.78e-03 | 17 |
| Page: 1 2 3 |
Top |
Cell-cell communication analysis |
| Identification of potential cell-cell interactions between two cell types and their ligand-receptor pairs for different disease states |
| Ligand | Receptor | LRpair | Pathway | Tissue | Disease Stage |
| Page: 1 |
Top |
Single-cell gene regulatory network inference analysis |
| Find out the significant the regulons (TFs) and the target genes of each regulon across cell types for different disease states |
| TF | Cell Type | Tissue | Disease Stage | Target Gene | RSS | Regulon Activity |
| ∗The dot plots of a searched regulon are shown for all cell subpopulations in each disease state of each tissue based on the regulon specific score inferred using pySCENIC and by calculating the average expression. |
| Page: 1 |
Top |
Somatic mutation of malignant transformation related genes |
| Annotation of somatic variants for genes involved in malignant transformation |
| Hugo Symbol | Variant Class | Variant Classification | dbSNP RS | HGVSc | HGVSp | HGVSp Short | SWISSPROT | BIOTYPE | SIFT | PolyPhen | Tumor Sample Barcode | Tissue | Histology | Sex | Age | Stage | Therapy Types | Drugs | Outcome |
| HADHB | SNV | Missense_Mutation | c.1050A>T | p.Gln350His | p.Q350H | P55084 | protein_coding | deleterious(0) | probably_damaging(0.964) | TCGA-A8-A08T-01 | Breast | breast invasive carcinoma | Female | <65 | III/IV | Unknown | Unknown | PD | |
| HADHB | SNV | Missense_Mutation | rs780072612 | c.520N>T | p.Arg174Cys | p.R174C | P55084 | protein_coding | deleterious(0.01) | probably_damaging(0.997) | TCGA-AN-A046-01 | Breast | breast invasive carcinoma | Female | >=65 | I/II | Unknown | Unknown | SD |
| HADHB | SNV | Missense_Mutation | c.226N>A | p.Pro76Thr | p.P76T | P55084 | protein_coding | tolerated(0.08) | benign(0.199) | TCGA-E9-A22G-01 | Breast | breast invasive carcinoma | Female | <65 | I/II | Chemotherapy | doxorubicin | SD | |
| HADHB | insertion | Frame_Shift_Ins | novel | c.328_329insAAATGAA | p.Val110GlufsTer10 | p.V110Efs*10 | P55084 | protein_coding | TCGA-AC-A3QQ-01 | Breast | breast invasive carcinoma | Female | <65 | I/II | Unknown | Unknown | SD | ||
| HADHB | SNV | Missense_Mutation | novel | c.86C>A | p.Ser29Tyr | p.S29Y | P55084 | protein_coding | tolerated_low_confidence(0.18) | benign(0.08) | TCGA-HM-A4S6-01 | Cervix | cervical & endocervical cancer | Female | <65 | III/IV | Chemotherapy | cisplatin | CR |
| HADHB | SNV | Missense_Mutation | rs749861331 | c.608G>A | p.Arg203Gln | p.R203Q | P55084 | protein_coding | deleterious(0.04) | possibly_damaging(0.703) | TCGA-AA-3510-01 | Colorectum | colon adenocarcinoma | Male | >=65 | I/II | Unknown | Unknown | SD |
| HADHB | SNV | Missense_Mutation | c.1051N>A | p.Leu351Ile | p.L351I | P55084 | protein_coding | deleterious(0) | probably_damaging(0.96) | TCGA-AA-A010-01 | Colorectum | colon adenocarcinoma | Female | <65 | I/II | Chemotherapy | folinic | CR | |
| HADHB | SNV | Missense_Mutation | novel | c.505N>C | p.Ser169Pro | p.S169P | P55084 | protein_coding | deleterious(0) | probably_damaging(0.997) | TCGA-AZ-4315-01 | Colorectum | colon adenocarcinoma | Male | <65 | I/II | Unknown | Unknown | SD |
| HADHB | SNV | Missense_Mutation | novel | c.59N>T | p.Arg20Ile | p.R20I | P55084 | protein_coding | deleterious_low_confidence(0.02) | benign(0.02) | TCGA-CA-6717-01 | Colorectum | colon adenocarcinoma | Male | <65 | I/II | Chemotherapy | oxaliplatin | CR |
| HADHB | SNV | Missense_Mutation | c.602N>C | p.Lys201Thr | p.K201T | P55084 | protein_coding | tolerated(0.33) | benign(0.038) | TCGA-CA-6718-01 | Colorectum | colon adenocarcinoma | Male | <65 | I/II | Unknown | Unknown | PD |
| Page: 1 2 3 4 5 6 |
Top |
Related drugs of malignant transformation related genes |
| Identification of chemicals and drugs interact with genes involved in malignant transfromation |
| (DGIdb 4.0) |
| Entrez ID | Symbol | Category | Interaction Types | Drug Claim Name | Drug Name | PMIDs |
| Page: 1 |

Copyright 2023-Present -The University of Texas Health Science Center at Houston |