
|
|||||
|
 | |
| |
| |
| |
| |
| |
|
Gene: GLG1 |
Gene summary for GLG1 |
| Gene information | Species | Human | Gene symbol | GLG1 | Gene ID | 2734 |
| Gene name | golgi glycoprotein 1 | |
| Gene Alias | CFR-1 | |
| Cytomap | 16q23.1 | |
| Gene Type | protein-coding | GO ID | GO:0001501 | UniProtAcc | Q92896 |
Top |
Malignant transformation analysis |
| Identification of the aberrant gene expression in precancerous and cancerous lesions by comparing the gene expression of stem-like cells in diseased tissues with normal stem cells |
| Entrez ID | Symbol | Replicates | Species | Organ | Tissue | Adj P-value | Log2FC | Malignancy |
| 2734 | GLG1 | C08 | Human | Oral cavity | OSCC | 4.30e-25 | 7.48e-01 | 0.1919 |
| 2734 | GLG1 | C09 | Human | Oral cavity | OSCC | 1.45e-15 | 6.74e-01 | 0.1431 |
| 2734 | GLG1 | LP15 | Human | Oral cavity | LP | 2.04e-04 | 1.24e+00 | 0.2174 |
| 2734 | GLG1 | EOLP-1 | Human | Oral cavity | EOLP | 1.62e-09 | 4.68e-01 | -0.0202 |
| 2734 | GLG1 | NEOLP-2 | Human | Oral cavity | NEOLP | 1.55e-05 | 2.63e-01 | -0.0196 |
| 2734 | GLG1 | NEOLP-3 | Human | Oral cavity | NEOLP | 2.20e-02 | 2.44e-01 | -0.0191 |
| 2734 | GLG1 | SYSMH1 | Human | Oral cavity | OSCC | 1.88e-32 | 7.45e-01 | 0.1127 |
| 2734 | GLG1 | SYSMH2 | Human | Oral cavity | OSCC | 8.64e-14 | 5.61e-01 | 0.2326 |
| 2734 | GLG1 | SYSMH3 | Human | Oral cavity | OSCC | 5.09e-29 | 8.19e-01 | 0.2442 |
| 2734 | GLG1 | SYSMH4 | Human | Oral cavity | OSCC | 1.84e-03 | 2.00e-02 | 0.1226 |
| 2734 | GLG1 | SYSMH5 | Human | Oral cavity | OSCC | 1.20e-17 | 5.46e-01 | 0.0647 |
| 2734 | GLG1 | SYSMH6 | Human | Oral cavity | OSCC | 1.26e-04 | 2.73e-01 | 0.1275 |
| 2734 | GLG1 | HTA12-23-1 | Human | Pancreas | PDAC | 2.76e-07 | 9.31e-01 | 0.3405 |
| 2734 | GLG1 | HTA12-26-1 | Human | Pancreas | PDAC | 2.60e-15 | 7.78e-01 | 0.3728 |
| 2734 | GLG1 | HTA12-29-1 | Human | Pancreas | PDAC | 1.31e-28 | 7.62e-01 | 0.3722 |
| 2734 | GLG1 | GSM5252137_BPH556PrGA2_Fcol | Human | Prostate | BPH | 7.47e-05 | 3.49e-01 | -0.23 |
| 2734 | GLG1 | 047563_1562-all-cells | Human | Prostate | BPH | 2.05e-04 | 2.44e-01 | 0.0791 |
| 2734 | GLG1 | 048752_1579-all-cells | Human | Prostate | BPH | 6.71e-12 | 3.49e-01 | 0.1008 |
| 2734 | GLG1 | 052095_1628-all-cells | Human | Prostate | BPH | 4.31e-20 | 4.53e-01 | 0.1032 |
| 2734 | GLG1 | 052097_1595-all-cells | Human | Prostate | BPH | 2.78e-04 | 3.05e-01 | 0.0972 |
| Page: 1 2 3 4 5 6 7 8 9 10 11 |
| Tissue | Expression Dynamics | Abbreviation |
| Cervix |  | CC: Cervix cancer |
| HSIL_HPV: HPV-infected high-grade squamous intraepithelial lesions | ||
| N_HPV: HPV-infected normal cervix | ||
| Colorectum (GSE201348) |  | FAP: Familial adenomatous polyposis |
| CRC: Colorectal cancer | ||
| Colorectum (HTA11) |  | AD: Adenomas |
| SER: Sessile serrated lesions | ||
| MSI-H: Microsatellite-high colorectal cancer | ||
| MSS: Microsatellite stable colorectal cancer | ||
| Esophagus | 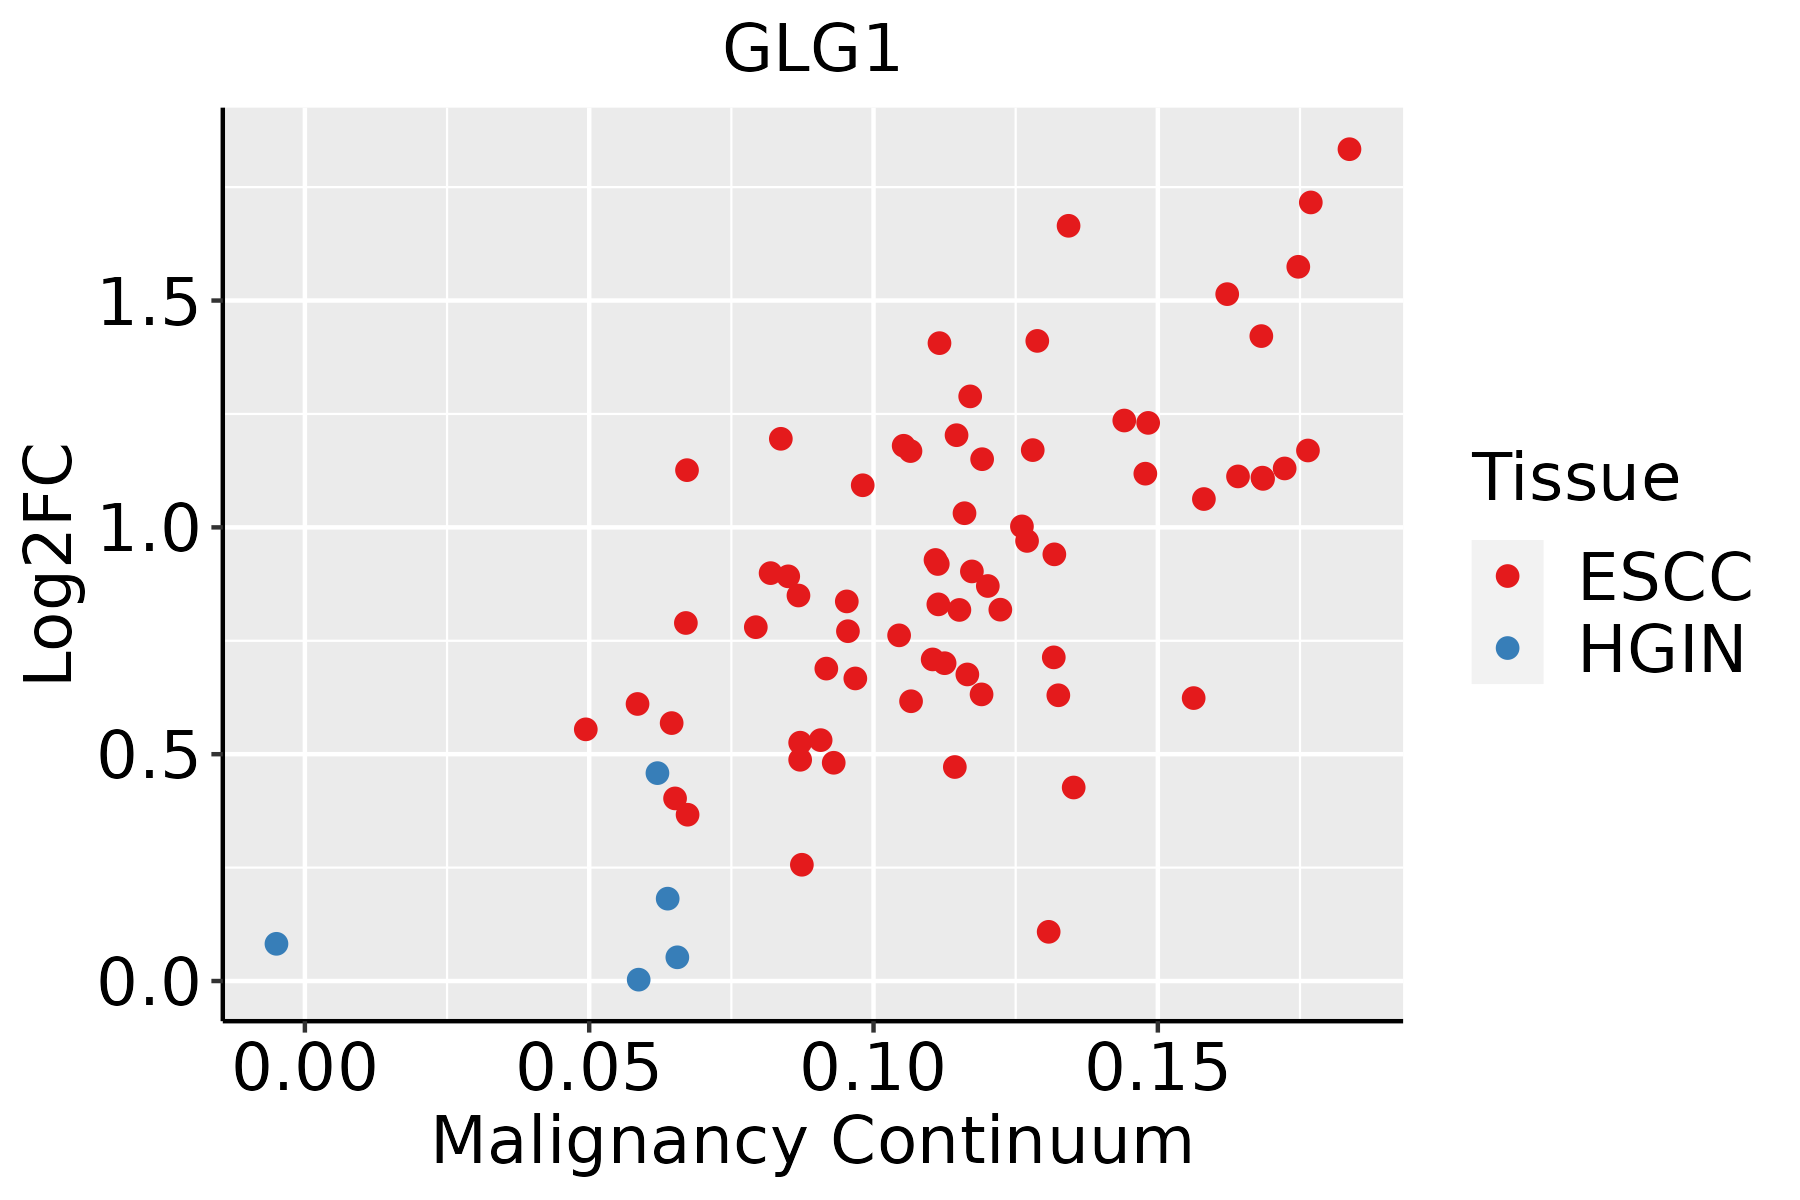 | ESCC: Esophageal squamous cell carcinoma |
| HGIN: High-grade intraepithelial neoplasias | ||
| LGIN: Low-grade intraepithelial neoplasias | ||
| Liver | 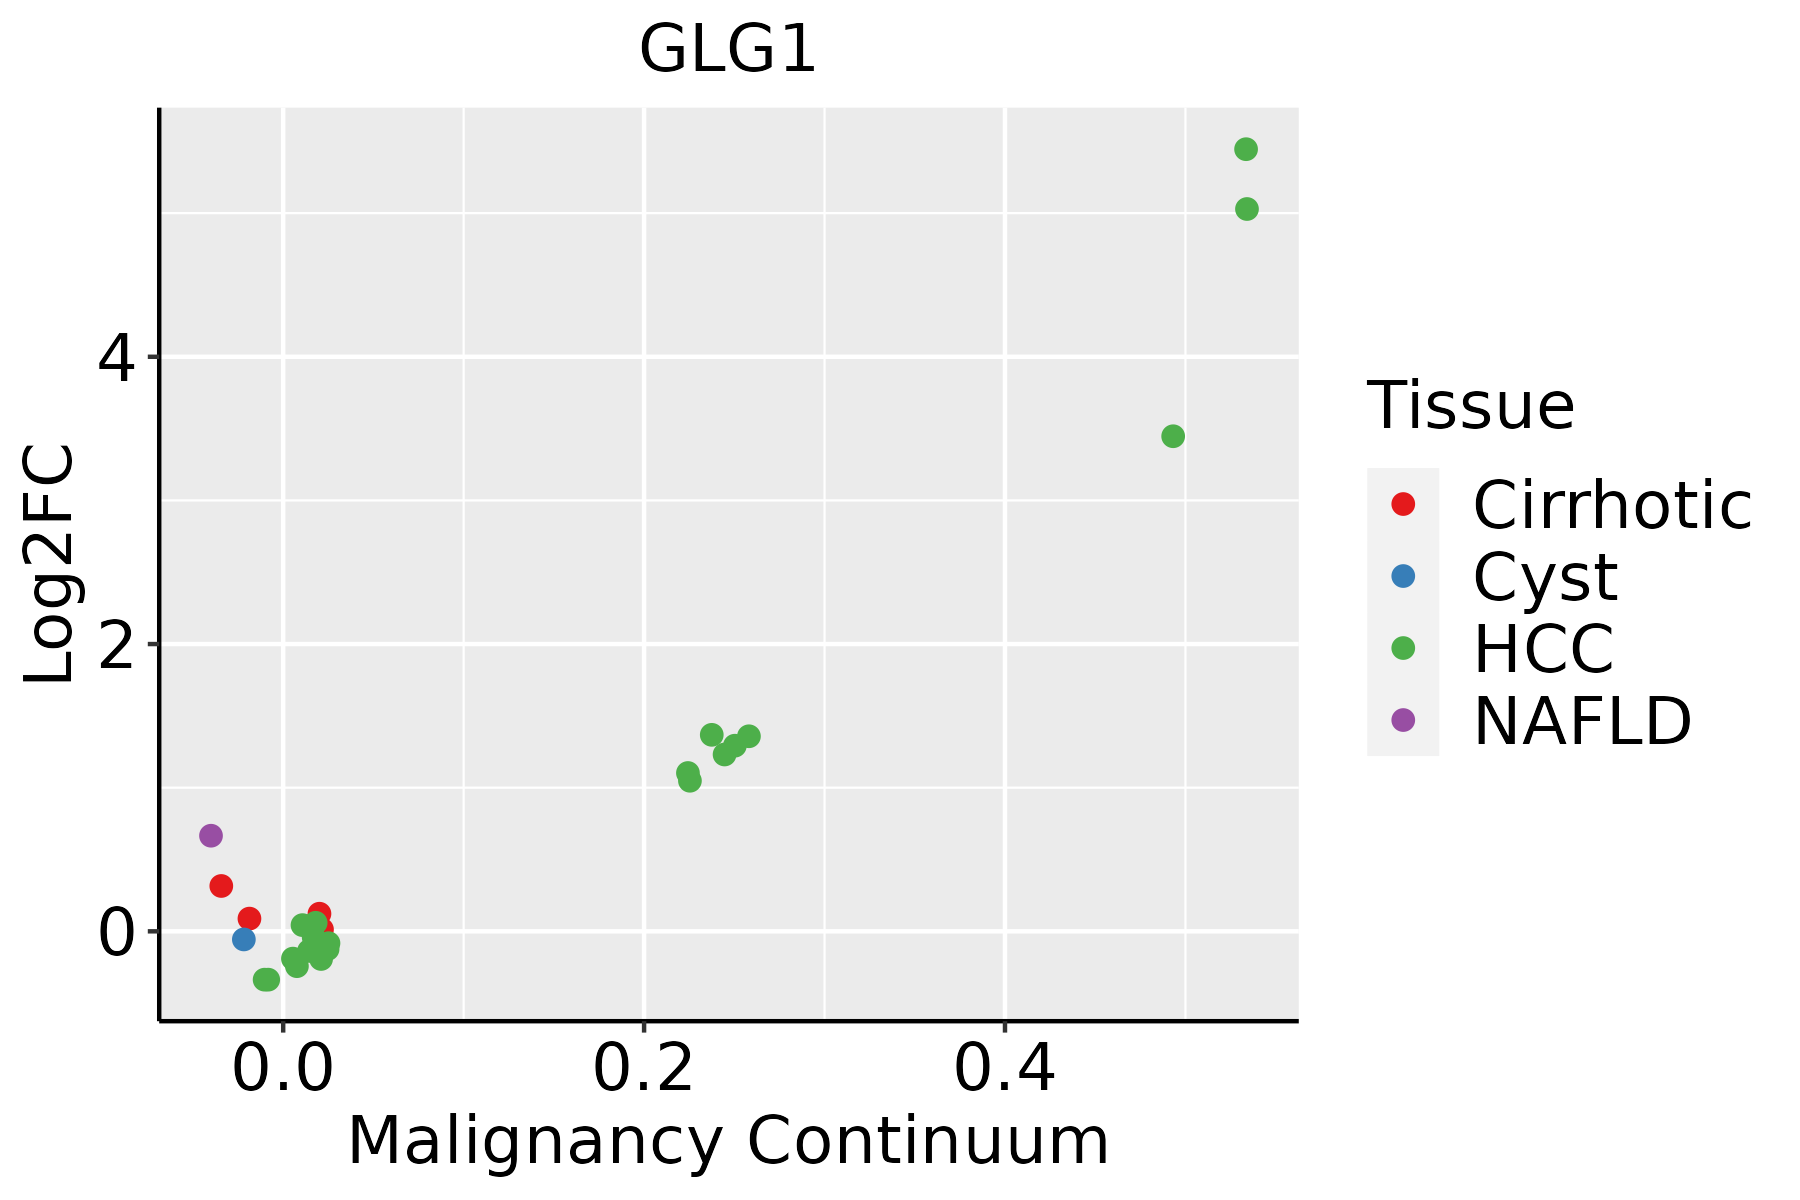 | HCC: Hepatocellular carcinoma |
| NAFLD: Non-alcoholic fatty liver disease | ||
| Lung |  | AAH: Atypical adenomatous hyperplasia |
| AIS: Adenocarcinoma in situ | ||
| IAC: Invasive lung adenocarcinoma | ||
| MIA: Minimally invasive adenocarcinoma | ||
| Oral Cavity | 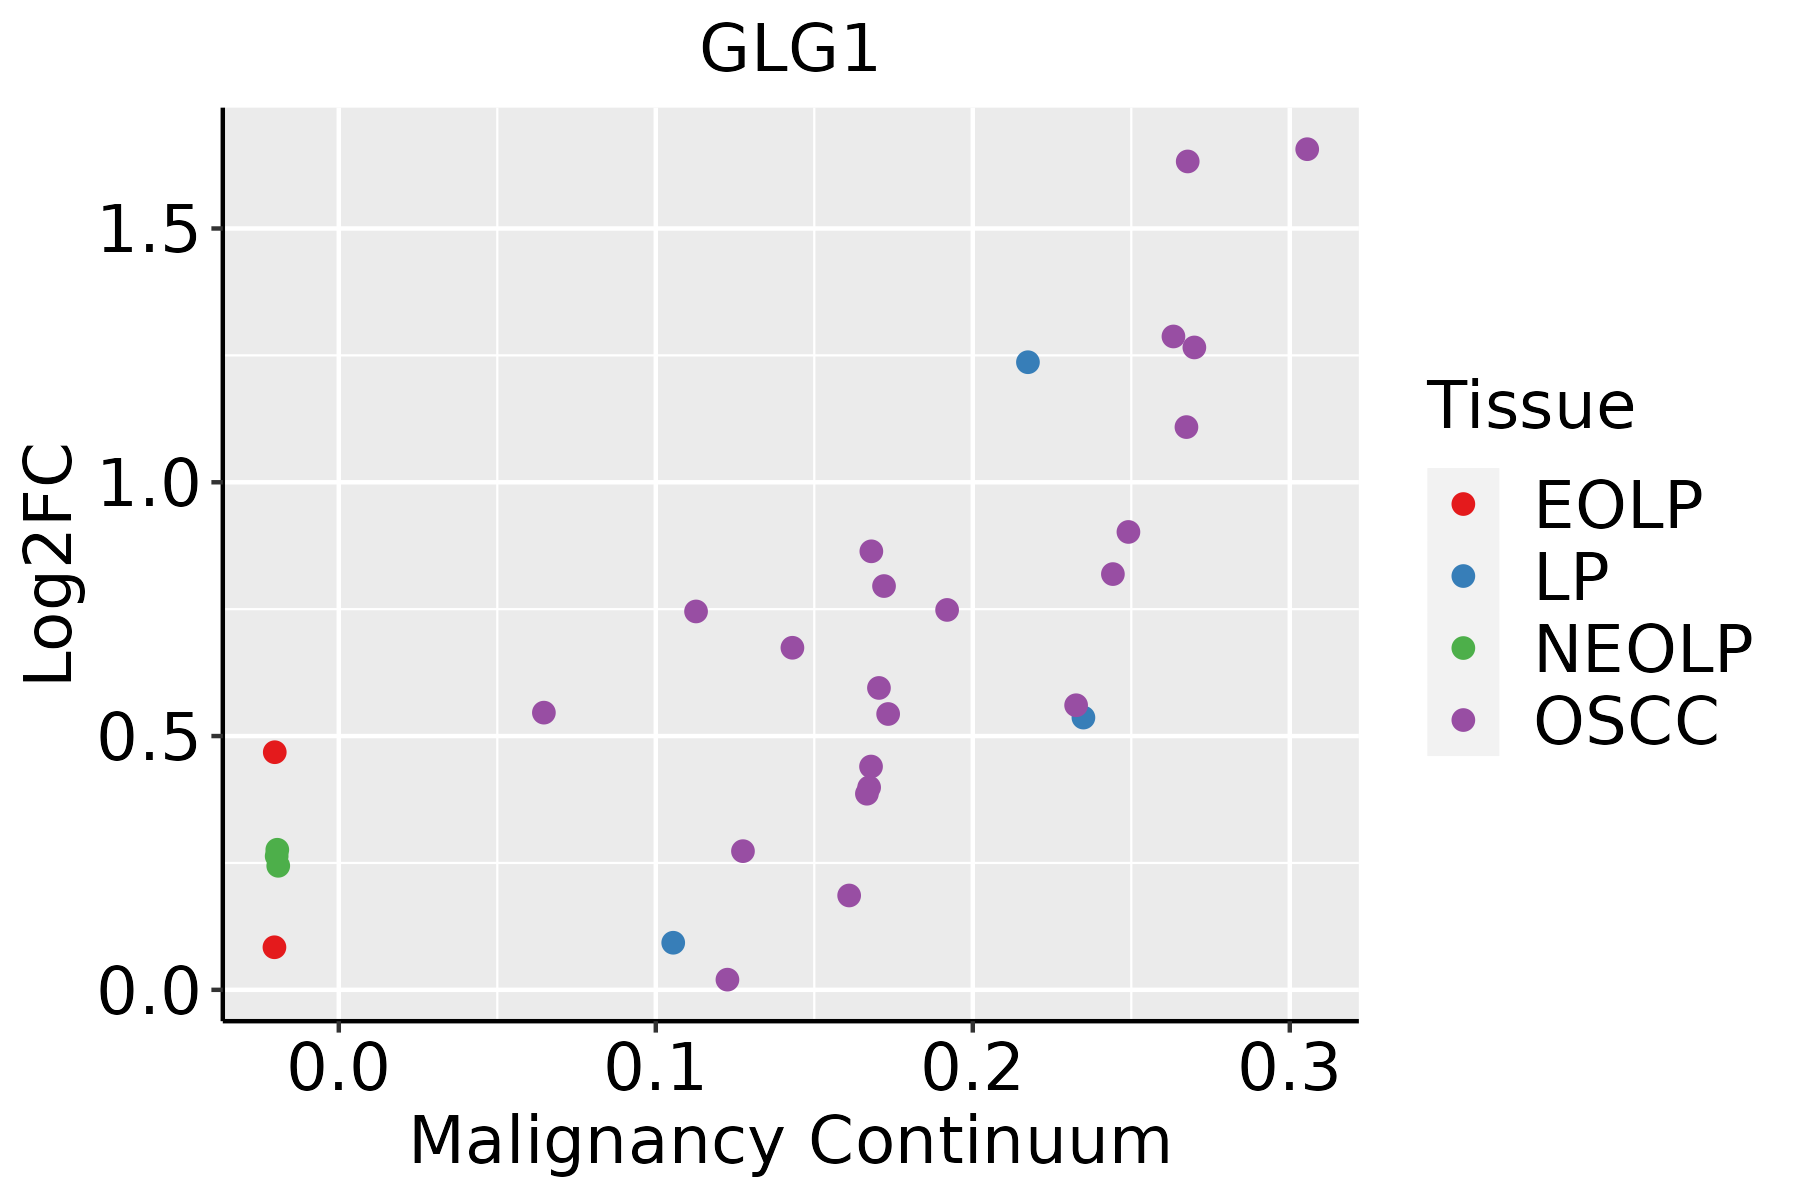 | EOLP: Erosive Oral lichen planus |
| LP: leukoplakia | ||
| NEOLP: Non-erosive oral lichen planus | ||
| OSCC: Oral squamous cell carcinoma | ||
| Prostate | 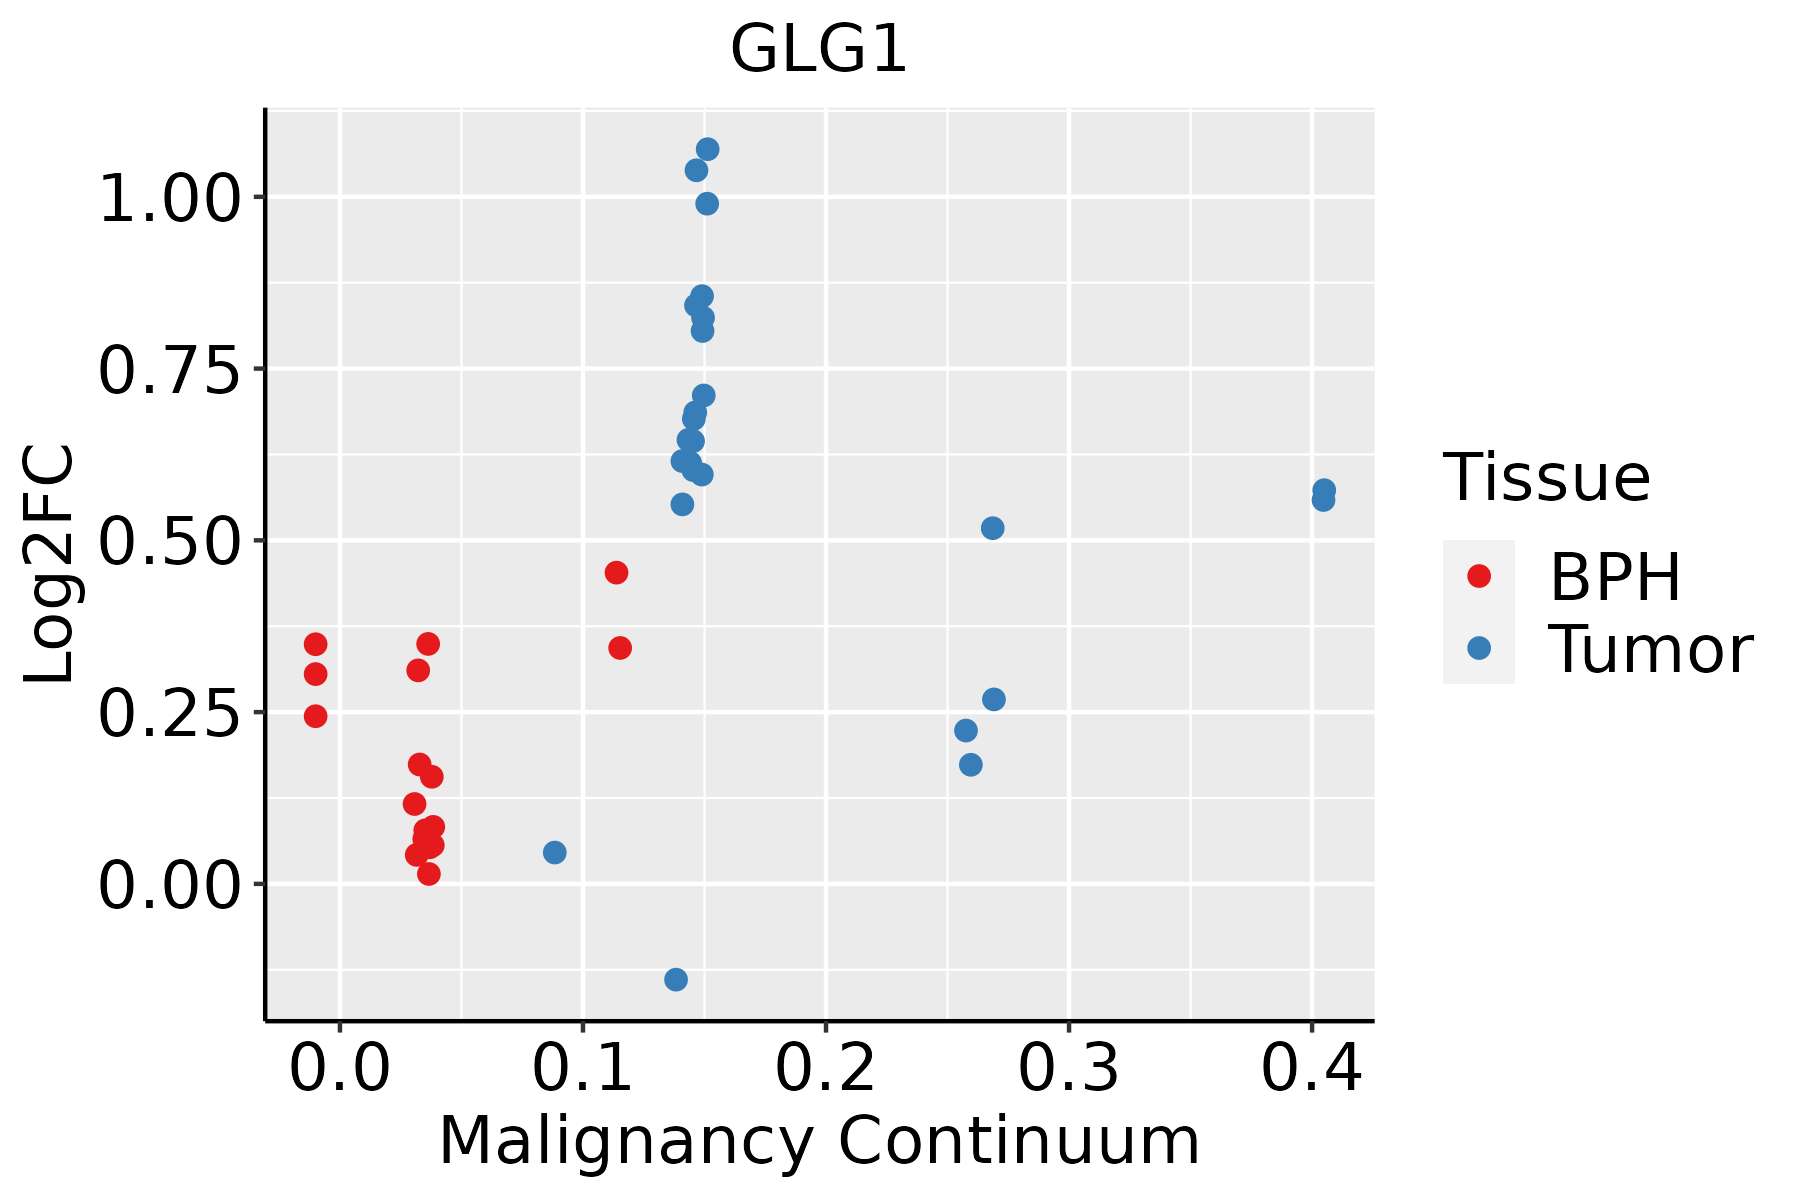 | BPH: Benign Prostatic Hyperplasia |
| Skin | 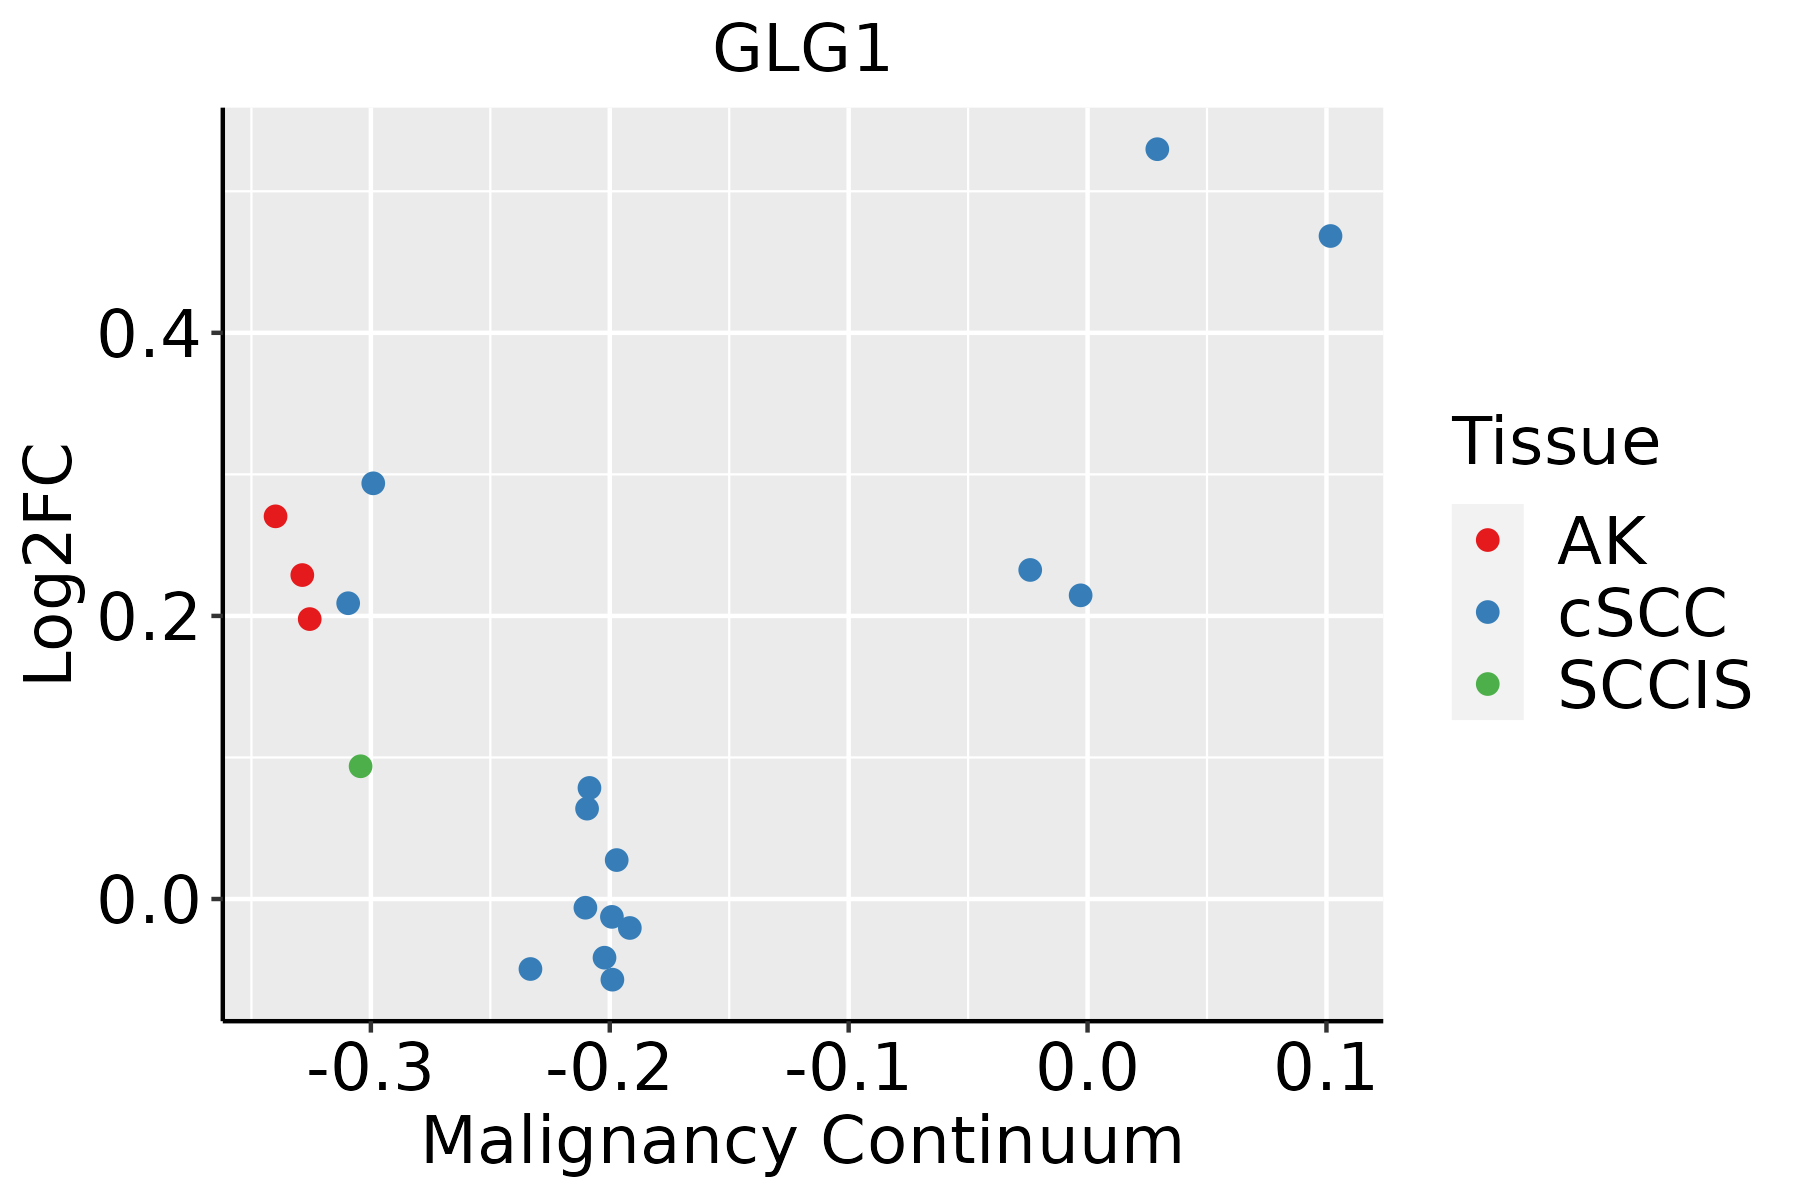 | AK: Actinic keratosis |
| cSCC: Cutaneous squamous cell carcinoma | ||
| SCCIS:squamous cell carcinoma in situ | ||
| Thyroid | 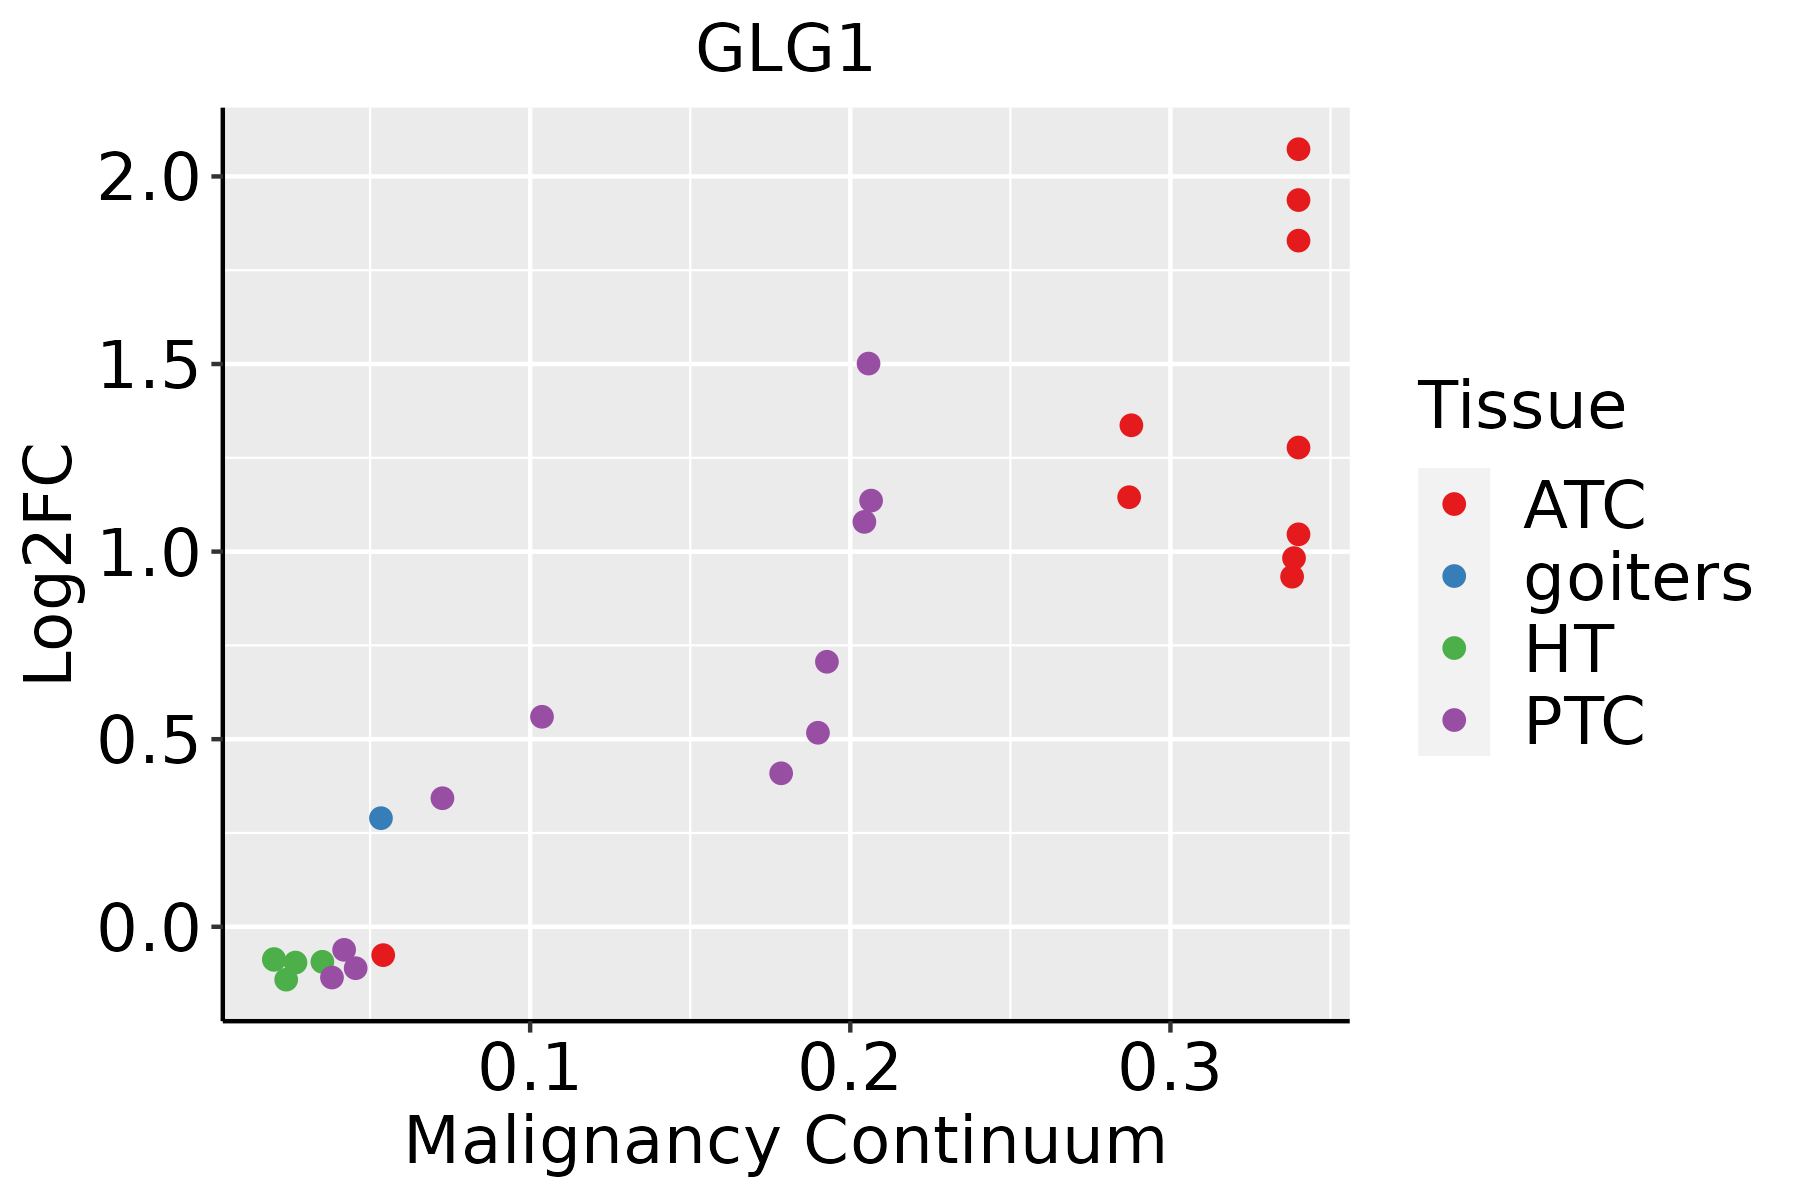 | ATC: Anaplastic thyroid cancer |
| HT: Hashimoto's thyroiditis | ||
| PTC: Papillary thyroid cancer |
| ∗log2FC in expression of this searched gene in stem-like cells from each diseased tissue sample relative to stem-like cells in normal samples in each tissue plotted against the malignancy continuum. Samples are colored based on if they are from different disease stage. |
Top |
Malignant transformation related pathway analysis |
| Find out the enriched GO biological processes and KEGG pathways involved in transition from healthy to precancer to cancer |
| Tissue | Disease Stage | Enriched GO biological Processes |
| Colorectum | AD |  |
| Colorectum | SER |  |
| Colorectum | MSS |  |
| Colorectum | MSI-H |  |
| Colorectum | FAP |  |
| ∗Top 15 enriched GO BP terms are showed in the bar plot of each disease state in each tissue. Each row represents a significant GO biological process which is colored according to the -log10(p.adjust). |
| Page: 1 2 3 4 5 6 7 8 9 |
| GO ID | Tissue | Disease Stage | Description | Gene Ratio | Bg Ratio | pvalue | p.adjust | Count |
| GO:004586110 | Cervix | CC | negative regulation of proteolysis | 80/2311 | 351/18723 | 2.88e-08 | 1.98e-06 | 80 |
| GO:00071786 | Cervix | CC | transmembrane receptor protein serine/threonine kinase signaling pathway | 67/2311 | 355/18723 | 2.39e-04 | 2.67e-03 | 67 |
| GO:00516048 | Cervix | CC | protein maturation | 56/2311 | 294/18723 | 5.90e-04 | 5.59e-03 | 56 |
| GO:00715595 | Cervix | CC | response to transforming growth factor beta | 50/2311 | 256/18723 | 6.31e-04 | 5.91e-03 | 50 |
| GO:00715605 | Cervix | CC | cellular response to transforming growth factor beta stimulus | 49/2311 | 250/18723 | 6.55e-04 | 6.05e-03 | 49 |
| GO:00071795 | Cervix | CC | transforming growth factor beta receptor signaling pathway | 38/2311 | 198/18723 | 3.62e-03 | 2.31e-02 | 38 |
| GO:004586124 | Cervix | N_HPV | negative regulation of proteolysis | 27/534 | 351/18723 | 3.27e-06 | 1.36e-04 | 27 |
| GO:007156023 | Cervix | N_HPV | cellular response to transforming growth factor beta stimulus | 18/534 | 250/18723 | 3.16e-04 | 4.75e-03 | 18 |
| GO:005160414 | Cervix | N_HPV | protein maturation | 20/534 | 294/18723 | 3.17e-04 | 4.75e-03 | 20 |
| GO:007155923 | Cervix | N_HPV | response to transforming growth factor beta | 18/534 | 256/18723 | 4.21e-04 | 5.88e-03 | 18 |
| GO:000717821 | Cervix | N_HPV | transmembrane receptor protein serine/threonine kinase signaling pathway | 22/534 | 355/18723 | 5.85e-04 | 7.73e-03 | 22 |
| GO:00603482 | Cervix | N_HPV | bone development | 15/534 | 205/18723 | 8.27e-04 | 1.02e-02 | 15 |
| GO:000717922 | Cervix | N_HPV | transforming growth factor beta receptor signaling pathway | 14/534 | 198/18723 | 1.69e-03 | 1.72e-02 | 14 |
| GO:00164854 | Cervix | N_HPV | protein processing | 15/534 | 225/18723 | 2.09e-03 | 2.00e-02 | 15 |
| GO:0045861 | Colorectum | AD | negative regulation of proteolysis | 106/3918 | 351/18723 | 2.33e-05 | 4.57e-04 | 106 |
| GO:0051604 | Colorectum | AD | protein maturation | 85/3918 | 294/18723 | 6.73e-04 | 6.91e-03 | 85 |
| GO:0007178 | Colorectum | AD | transmembrane receptor protein serine/threonine kinase signaling pathway | 99/3918 | 355/18723 | 9.92e-04 | 9.28e-03 | 99 |
| GO:0071559 | Colorectum | AD | response to transforming growth factor beta | 74/3918 | 256/18723 | 1.45e-03 | 1.23e-02 | 74 |
| GO:0071560 | Colorectum | AD | cellular response to transforming growth factor beta stimulus | 72/3918 | 250/18723 | 1.85e-03 | 1.52e-02 | 72 |
| GO:0007179 | Colorectum | AD | transforming growth factor beta receptor signaling pathway | 59/3918 | 198/18723 | 1.94e-03 | 1.58e-02 | 59 |
| Page: 1 2 3 4 5 6 7 8 9 10 11 12 13 |
| Pathway ID | Tissue | Disease Stage | Description | Gene Ratio | Bg Ratio | pvalue | p.adjust | qvalue | Count |
| hsa045147 | Cervix | CC | Cell adhesion molecules | 36/1267 | 157/8465 | 4.94e-03 | 1.67e-02 | 9.86e-03 | 36 |
| hsa0451412 | Cervix | CC | Cell adhesion molecules | 36/1267 | 157/8465 | 4.94e-03 | 1.67e-02 | 9.86e-03 | 36 |
| hsa0451441 | Cervix | N_HPV | Cell adhesion molecules | 18/349 | 157/8465 | 7.71e-05 | 8.06e-04 | 6.30e-04 | 18 |
| hsa0451451 | Cervix | N_HPV | Cell adhesion molecules | 18/349 | 157/8465 | 7.71e-05 | 8.06e-04 | 6.30e-04 | 18 |
| hsa045146 | Lung | IAC | Cell adhesion molecules | 30/1053 | 157/8465 | 1.03e-02 | 3.83e-02 | 2.54e-02 | 30 |
| hsa0451411 | Lung | IAC | Cell adhesion molecules | 30/1053 | 157/8465 | 1.03e-02 | 3.83e-02 | 2.54e-02 | 30 |
| Page: 1 |
Top |
Cell-cell communication analysis |
| Identification of potential cell-cell interactions between two cell types and their ligand-receptor pairs for different disease states |
| Ligand | Receptor | LRpair | Pathway | Tissue | Disease Stage |
| SELE | GLG1 | SELE_GLG1 | SELE | Breast | ADJ |
| SELE | GLG1 | SELE_GLG1 | SELE | Breast | Healthy |
| SELE | GLG1 | SELE_GLG1 | SELE | Cervix | ADJ |
| SELE | GLG1 | SELE_GLG1 | SELE | Cervix | CC |
| SELE | GLG1 | SELE_GLG1 | SELE | Endometrium | ADJ |
| SELE | GLG1 | SELE_GLG1 | SELE | Endometrium | AEH |
| SELE | GLG1 | SELE_GLG1 | SELE | Endometrium | EEC |
| SELE | GLG1 | SELE_GLG1 | SELE | Esophagus | ESCC |
| SELE | GLG1 | SELE_GLG1 | SELE | GC | Healthy |
| SELE | GLG1 | SELE_GLG1 | SELE | HNSCC | ADJ |
| SELE | GLG1 | SELE_GLG1 | SELE | HNSCC | Healthy |
| SELE | GLG1 | SELE_GLG1 | SELE | HNSCC | OSCC |
| SELE | GLG1 | SELE_GLG1 | SELE | HNSCC | Precancer |
| SELE | GLG1 | SELE_GLG1 | SELE | Prostate | ADJ |
| SELE | GLG1 | SELE_GLG1 | SELE | Prostate | BPH |
| SELE | GLG1 | SELE_GLG1 | SELE | Prostate | Healthy |
| SELE | GLG1 | SELE_GLG1 | SELE | Prostate | Tumor |
| SELE | GLG1 | SELE_GLG1 | SELE | Skin | ADJ |
| SELE | GLG1 | SELE_GLG1 | SELE | Skin | AK |
| SELE | GLG1 | SELE_GLG1 | SELE | Skin | cSCC |
| Page: 1 |
Top |
Single-cell gene regulatory network inference analysis |
| Find out the significant the regulons (TFs) and the target genes of each regulon across cell types for different disease states |
| TF | Cell Type | Tissue | Disease Stage | Target Gene | RSS | Regulon Activity |
| ∗The dot plots of a searched regulon are shown for all cell subpopulations in each disease state of each tissue based on the regulon specific score inferred using pySCENIC and by calculating the average expression. |
| Page: 1 |
Top |
Somatic mutation of malignant transformation related genes |
| Annotation of somatic variants for genes involved in malignant transformation |
| Hugo Symbol | Variant Class | Variant Classification | dbSNP RS | HGVSc | HGVSp | HGVSp Short | SWISSPROT | BIOTYPE | SIFT | PolyPhen | Tumor Sample Barcode | Tissue | Histology | Sex | Age | Stage | Therapy Types | Drugs | Outcome |
| GLG1 | SNV | Missense_Mutation | c.1717C>G | p.Arg573Gly | p.R573G | Q92896 | protein_coding | deleterious(0.01) | possibly_damaging(0.524) | TCGA-A7-A0CE-01 | Breast | breast invasive carcinoma | Female | <65 | I/II | Chemotherapy | adriamycin | SD | |
| GLG1 | SNV | Missense_Mutation | novel | c.2081N>A | p.Arg694Lys | p.R694K | Q92896 | protein_coding | tolerated(0.25) | possibly_damaging(0.553) | TCGA-A8-A09M-01 | Breast | breast invasive carcinoma | Female | >=65 | III/IV | Chemotherapy | paclitaxel | CR |
| GLG1 | SNV | Missense_Mutation | rs763398161 | c.1621N>A | p.Asp541Asn | p.D541N | Q92896 | protein_coding | tolerated(0.2) | benign(0.122) | TCGA-AC-A23H-01 | Breast | breast invasive carcinoma | Female | >=65 | I/II | Unknown | Unknown | PD |
| GLG1 | SNV | Missense_Mutation | novel | c.3442C>A | p.Leu1148Ile | p.L1148I | Q92896 | protein_coding | tolerated(0.12) | probably_damaging(0.986) | TCGA-AN-A046-01 | Breast | breast invasive carcinoma | Female | >=65 | I/II | Unknown | Unknown | SD |
| GLG1 | SNV | Missense_Mutation | c.2171N>G | p.Asn724Ser | p.N724S | Q92896 | protein_coding | tolerated(0.05) | probably_damaging(0.939) | TCGA-D8-A1JJ-01 | Breast | breast invasive carcinoma | Female | <65 | I/II | Chemotherapy | doxorubicine | SD | |
| GLG1 | deletion | Frame_Shift_Del | c.2499_2500delCT | p.Phe833LeufsTer32 | p.F833Lfs*32 | Q92896 | protein_coding | TCGA-AC-A23C-01 | Breast | breast invasive carcinoma | Female | <65 | I/II | Chemotherapy | chemo | CR | |||
| GLG1 | SNV | Missense_Mutation | novel | c.3331C>T | p.Arg1111Cys | p.R1111C | Q92896 | protein_coding | deleterious(0.01) | probably_damaging(0.95) | TCGA-2W-A8YY-01 | Cervix | cervical & endocervical cancer | Female | <65 | I/II | Chemotherapy | cisplatin | CR |
| GLG1 | SNV | Missense_Mutation | c.623N>A | p.Arg208Gln | p.R208Q | Q92896 | protein_coding | tolerated(0.12) | possibly_damaging(0.749) | TCGA-IR-A3LL-01 | Cervix | cervical & endocervical cancer | Female | <65 | I/II | Chemotherapy | cisplatin | CR | |
| GLG1 | SNV | Missense_Mutation | novel | c.2575T>C | p.Cys859Arg | p.C859R | Q92896 | protein_coding | deleterious(0) | probably_damaging(1) | TCGA-5M-AAT6-01 | Colorectum | colon adenocarcinoma | Female | <65 | III/IV | Unknown | Unknown | PD |
| GLG1 | SNV | Missense_Mutation | c.1043G>A | p.Ser348Asn | p.S348N | Q92896 | protein_coding | deleterious(0) | probably_damaging(0.97) | TCGA-A6-3809-01 | Colorectum | colon adenocarcinoma | Female | >=65 | I/II | Unknown | Unknown | SD |
| Page: 1 2 3 4 5 6 7 8 9 10 11 |
Top |
Related drugs of malignant transformation related genes |
| Identification of chemicals and drugs interact with genes involved in malignant transfromation |
| (DGIdb 4.0) |
| Entrez ID | Symbol | Category | Interaction Types | Drug Claim Name | Drug Name | PMIDs |
| Page: 1 |

Copyright 2023-Present -The University of Texas Health Science Center at Houston |