
|
|||||
|
 | |
| |
| |
| |
| |
| |
|
Gene: GADD45GIP1 |
Gene summary for GADD45GIP1 |
| Gene information | Species | Human | Gene symbol | GADD45GIP1 | Gene ID | 90480 |
| Gene name | GADD45G interacting protein 1 | |
| Gene Alias | CKBBP2 | |
| Cytomap | 19p13.13 | |
| Gene Type | protein-coding | GO ID | GO:0007049 | UniProtAcc | Q8TAE8 |
Top |
Malignant transformation analysis |
| Identification of the aberrant gene expression in precancerous and cancerous lesions by comparing the gene expression of stem-like cells in diseased tissues with normal stem cells |
| Entrez ID | Symbol | Replicates | Species | Organ | Tissue | Adj P-value | Log2FC | Malignancy |
| 90480 | GADD45GIP1 | S027 | Human | Liver | HCC | 5.37e-17 | 1.85e+00 | 0.2446 |
| 90480 | GADD45GIP1 | S028 | Human | Liver | HCC | 2.09e-24 | 1.82e+00 | 0.2503 |
| 90480 | GADD45GIP1 | S029 | Human | Liver | HCC | 5.62e-25 | 1.88e+00 | 0.2581 |
| 90480 | GADD45GIP1 | C04 | Human | Oral cavity | OSCC | 2.31e-42 | 3.10e+00 | 0.2633 |
| 90480 | GADD45GIP1 | C21 | Human | Oral cavity | OSCC | 6.37e-63 | 3.41e+00 | 0.2678 |
| 90480 | GADD45GIP1 | C30 | Human | Oral cavity | OSCC | 8.92e-49 | 3.25e+00 | 0.3055 |
| 90480 | GADD45GIP1 | C38 | Human | Oral cavity | OSCC | 3.73e-21 | 2.43e+00 | 0.172 |
| 90480 | GADD45GIP1 | C43 | Human | Oral cavity | OSCC | 3.70e-78 | 1.59e+00 | 0.1704 |
| 90480 | GADD45GIP1 | C46 | Human | Oral cavity | OSCC | 3.71e-50 | 1.49e+00 | 0.1673 |
| 90480 | GADD45GIP1 | C51 | Human | Oral cavity | OSCC | 5.45e-35 | 2.57e+00 | 0.2674 |
| 90480 | GADD45GIP1 | C57 | Human | Oral cavity | OSCC | 4.00e-15 | 1.15e+00 | 0.1679 |
| 90480 | GADD45GIP1 | C06 | Human | Oral cavity | OSCC | 7.77e-22 | 2.28e+00 | 0.2699 |
| 90480 | GADD45GIP1 | C07 | Human | Oral cavity | OSCC | 5.94e-13 | 2.05e+00 | 0.2491 |
| 90480 | GADD45GIP1 | C08 | Human | Oral cavity | OSCC | 3.02e-69 | 1.67e+00 | 0.1919 |
| 90480 | GADD45GIP1 | C09 | Human | Oral cavity | OSCC | 6.69e-24 | 1.01e+00 | 0.1431 |
| 90480 | GADD45GIP1 | LN22 | Human | Oral cavity | OSCC | 2.87e-19 | 2.22e+00 | 0.1733 |
| 90480 | GADD45GIP1 | LN38 | Human | Oral cavity | OSCC | 3.12e-10 | 1.71e+00 | 0.168 |
| 90480 | GADD45GIP1 | LN46 | Human | Oral cavity | OSCC | 9.23e-26 | 1.50e+00 | 0.1666 |
| 90480 | GADD45GIP1 | LP15 | Human | Oral cavity | LP | 8.37e-17 | 2.27e+00 | 0.2174 |
| 90480 | GADD45GIP1 | LP17 | Human | Oral cavity | LP | 6.66e-07 | 1.87e+00 | 0.2349 |
| Page: 1 2 3 4 5 6 7 8 9 10 11 12 |
| Tissue | Expression Dynamics | Abbreviation |
| Breast | 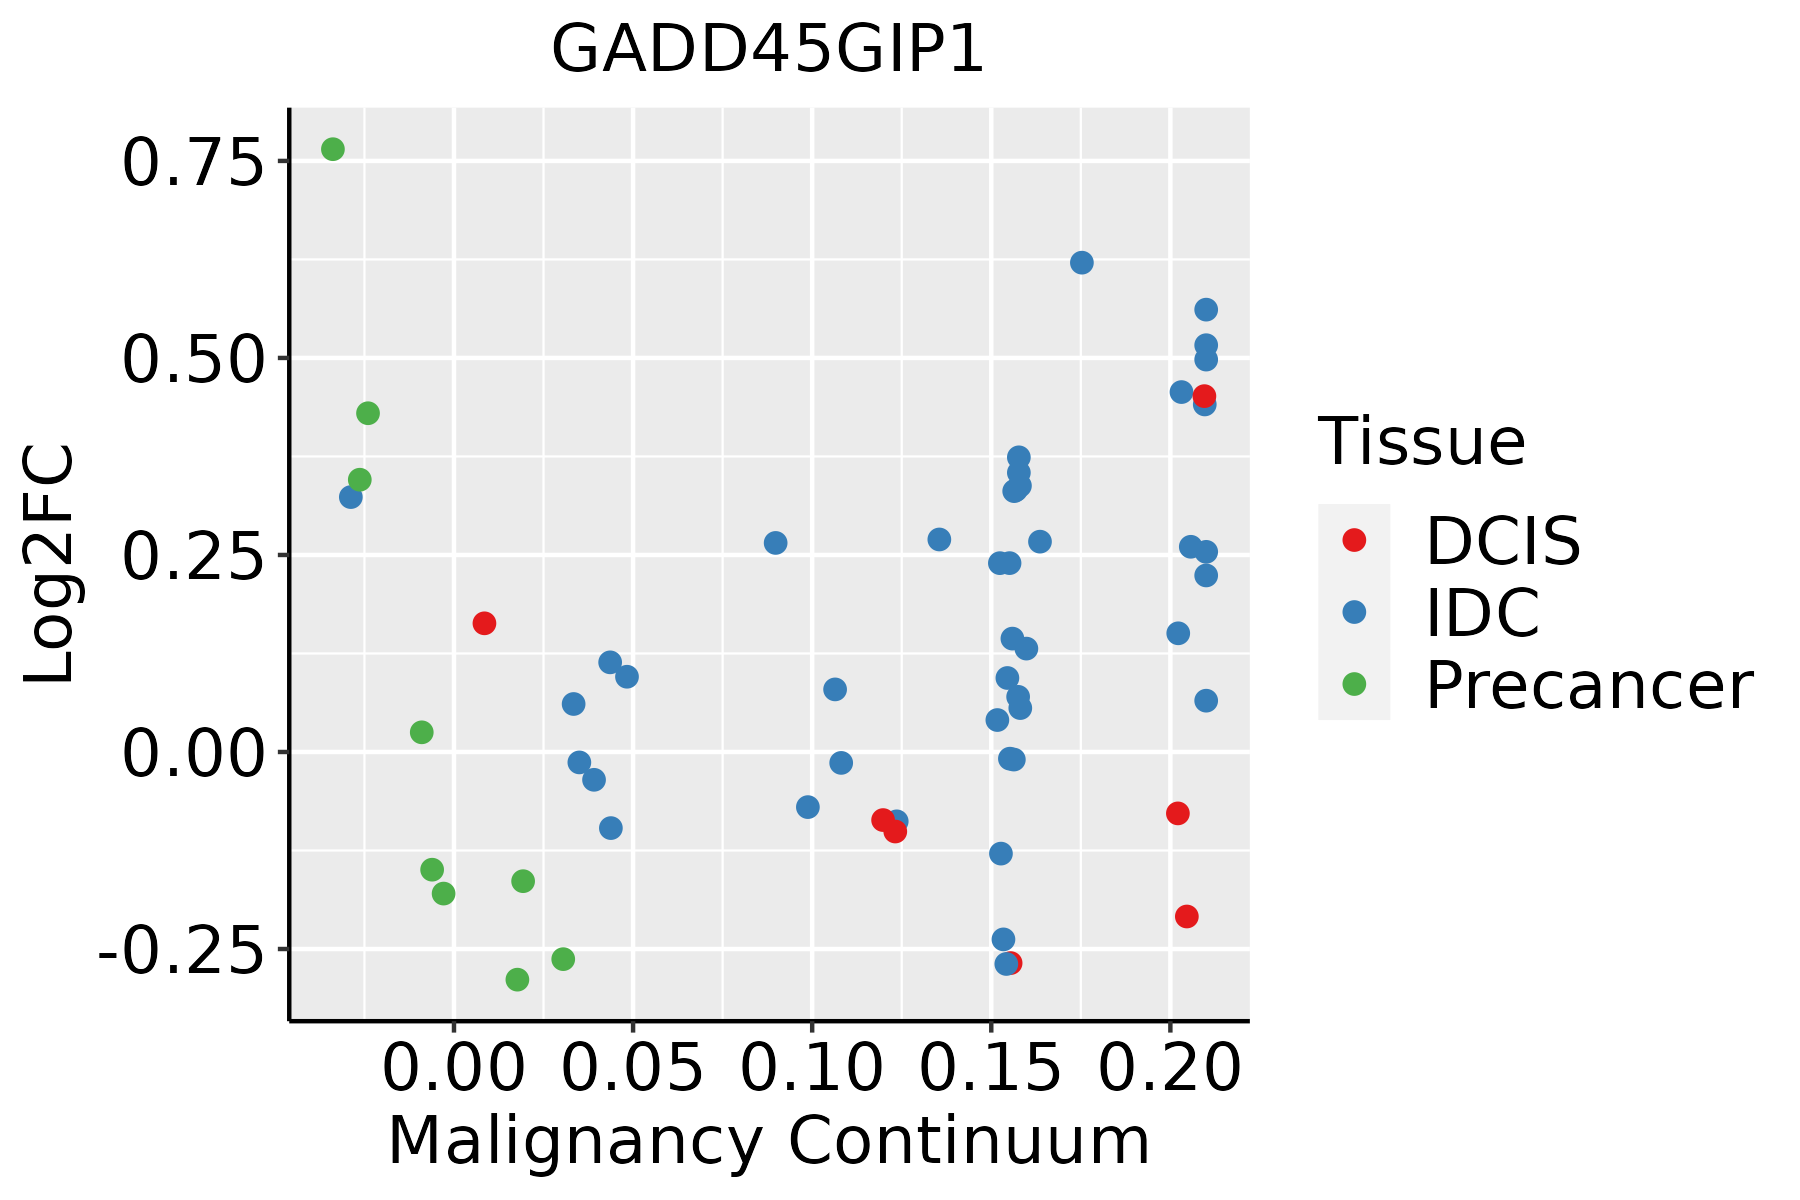 | IDC: Invasive ductal carcinoma |
| DCIS: Ductal carcinoma in situ | ||
| Precancer(BRCA1-mut): Precancerous lesion from BRCA1 mutation carriers | ||
| Cervix | 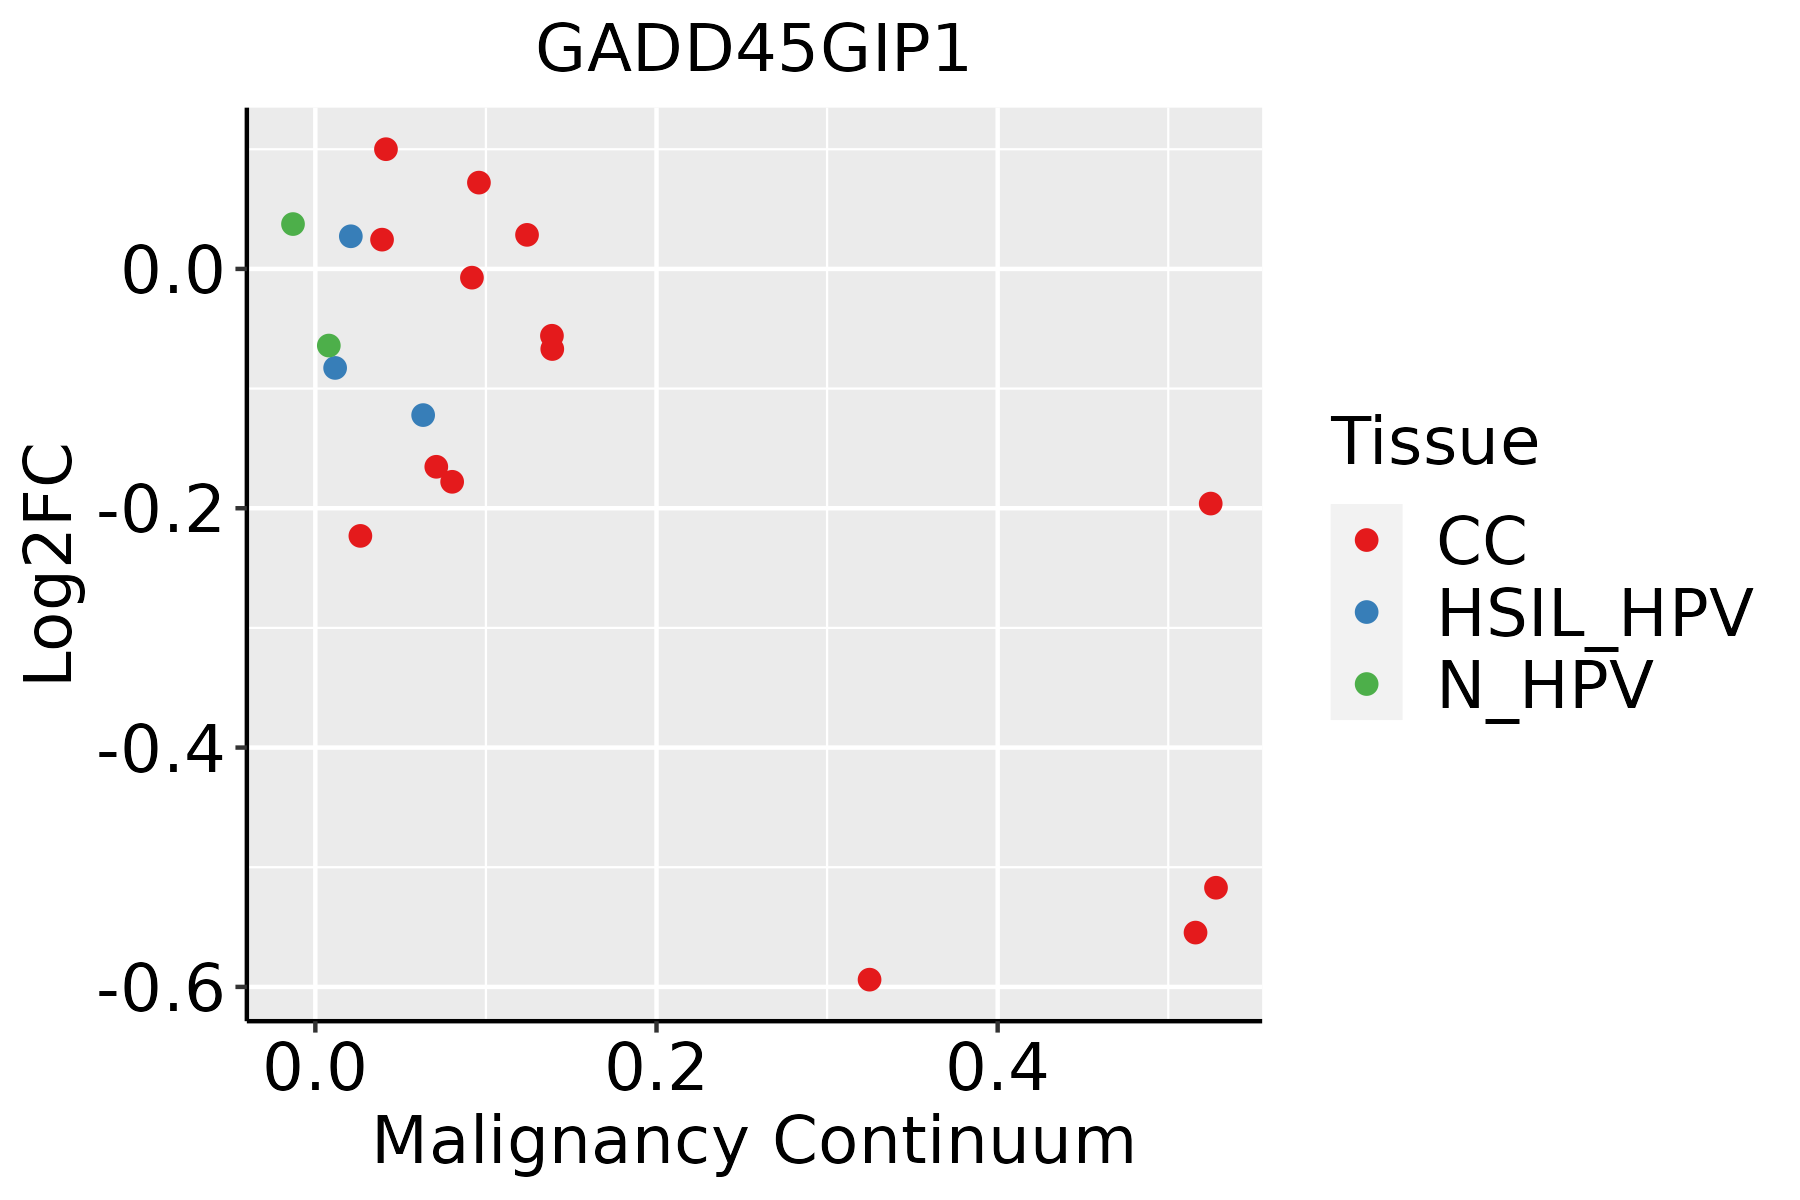 | CC: Cervix cancer |
| HSIL_HPV: HPV-infected high-grade squamous intraepithelial lesions | ||
| N_HPV: HPV-infected normal cervix | ||
| Endometrium | 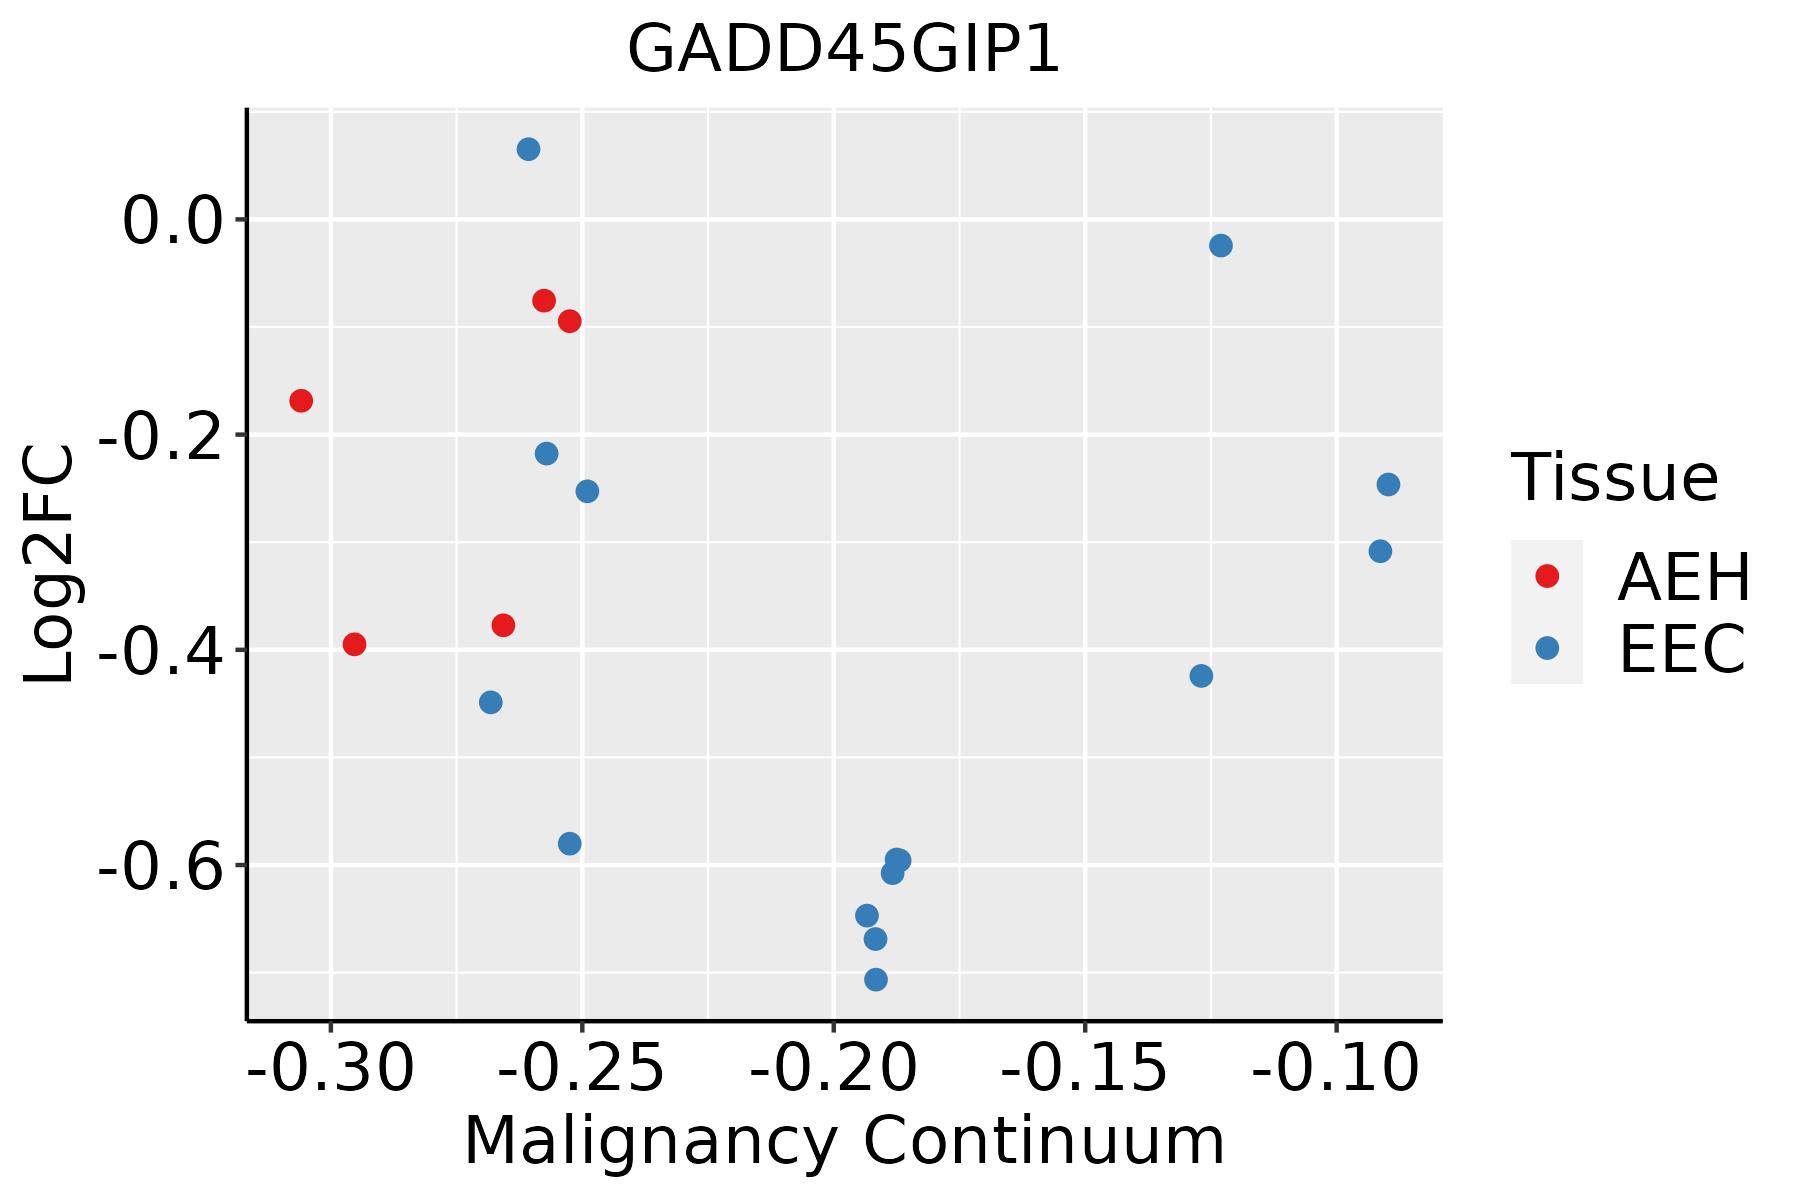 | AEH: Atypical endometrial hyperplasia |
| EEC: Endometrioid Cancer | ||
| Esophagus | 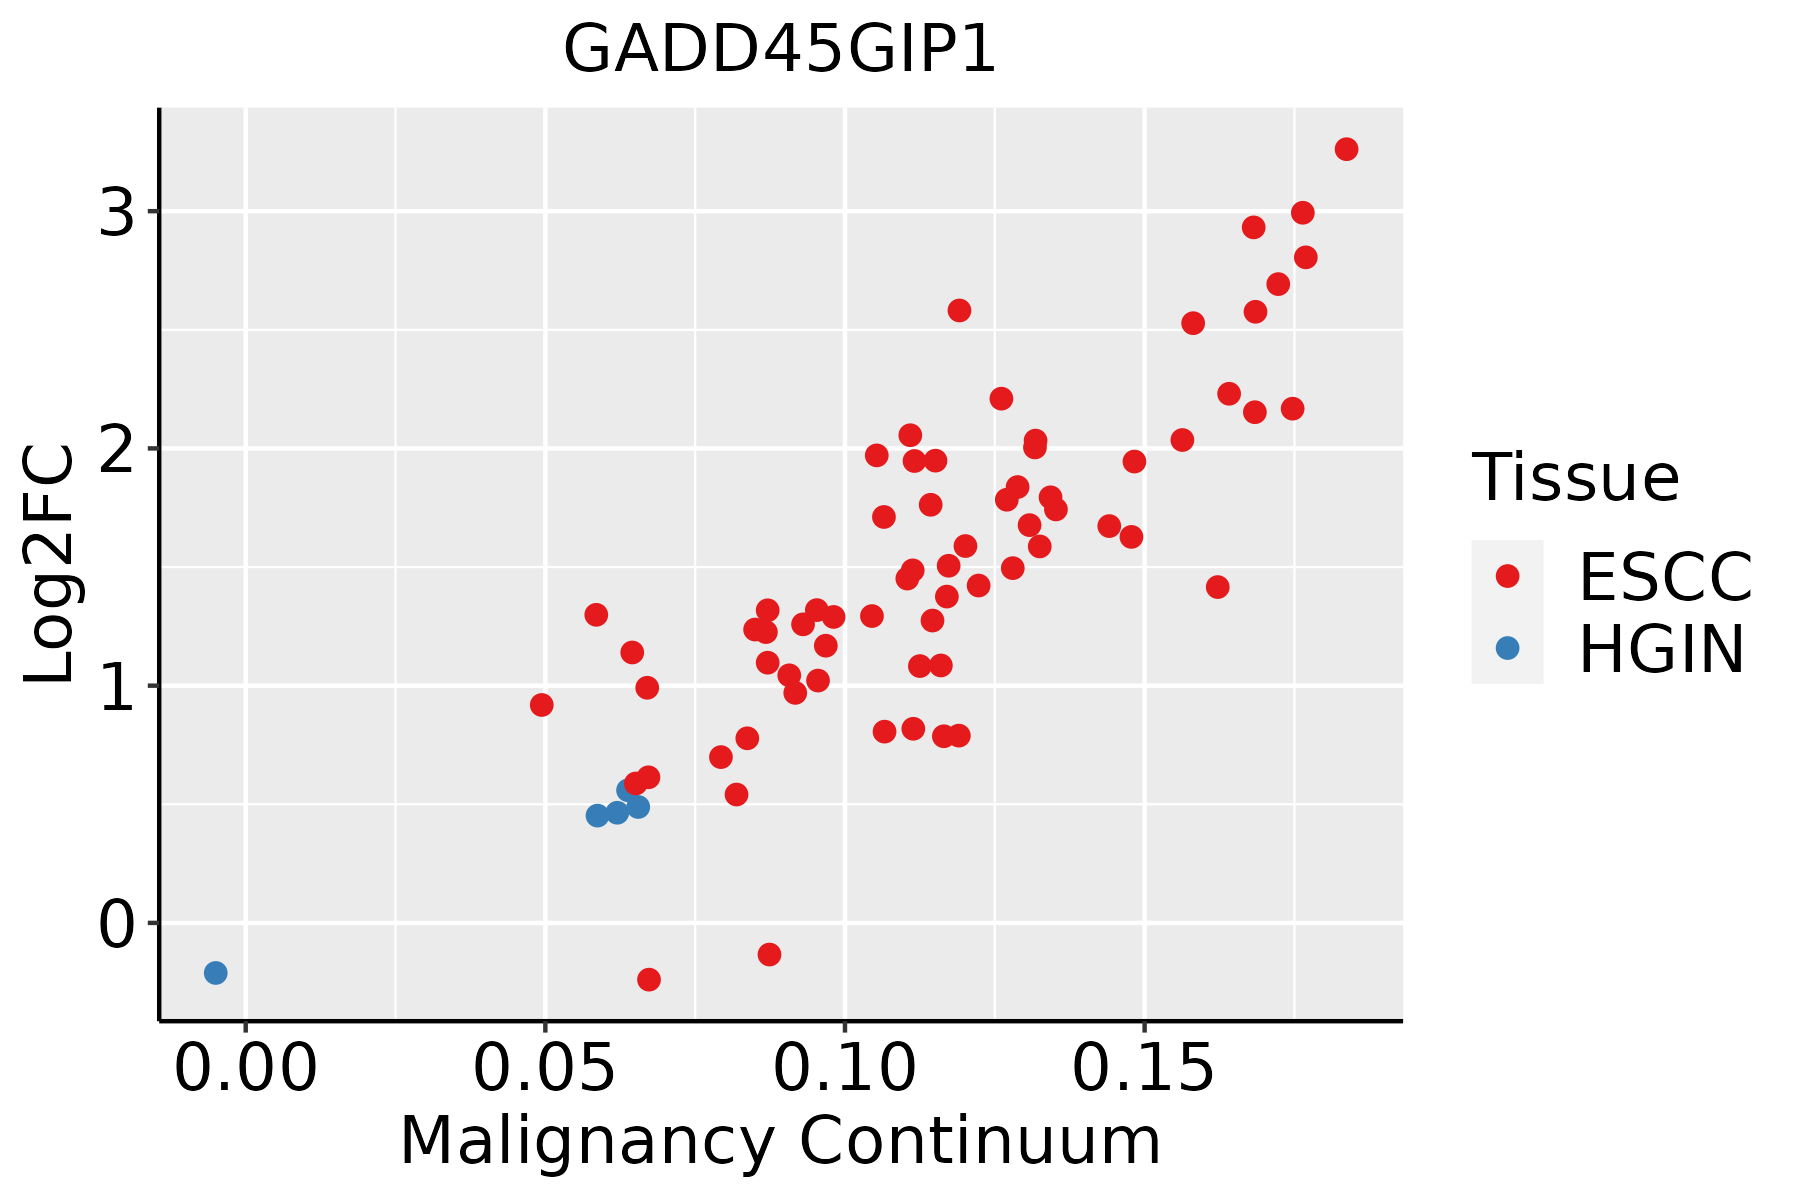 | ESCC: Esophageal squamous cell carcinoma |
| HGIN: High-grade intraepithelial neoplasias | ||
| LGIN: Low-grade intraepithelial neoplasias | ||
| GC | 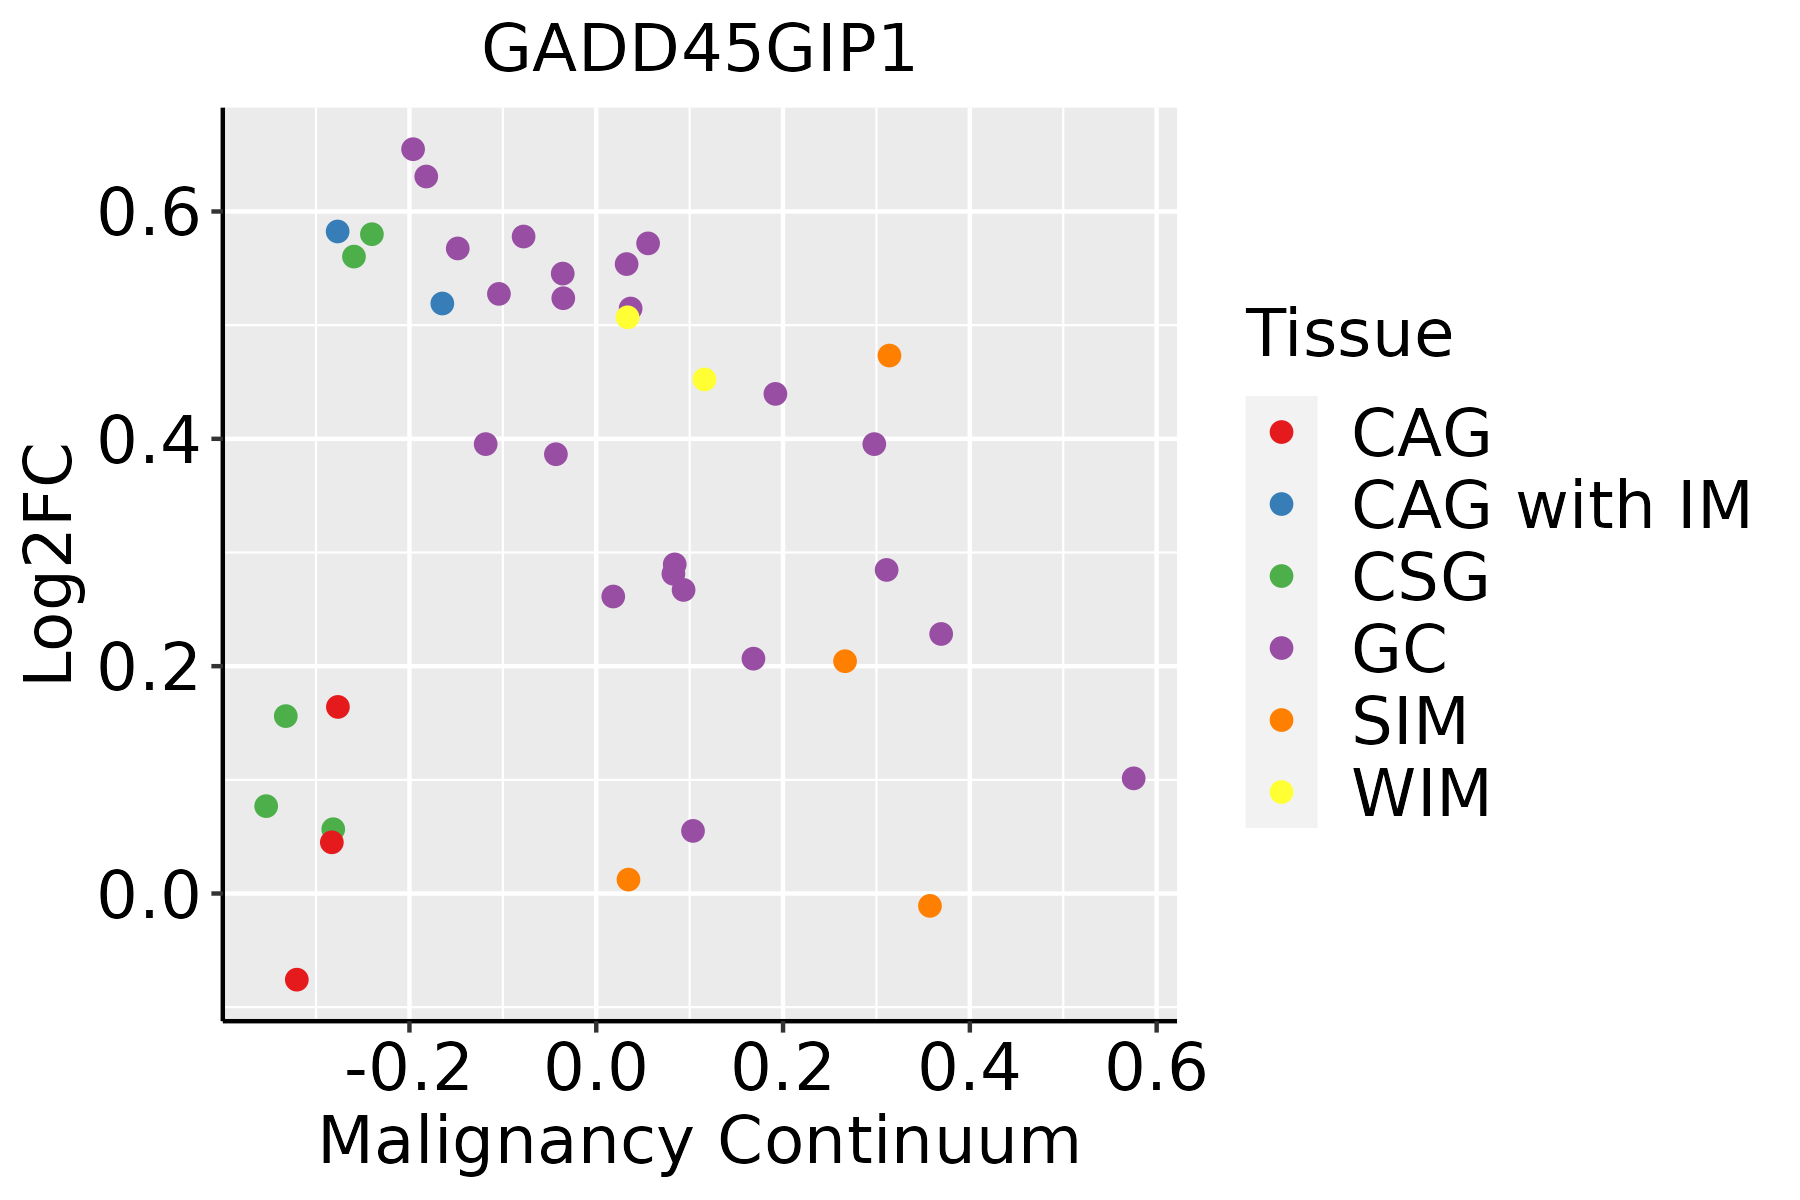 | CAG: Chronic atrophic gastritis |
| CAG with IM: Chronic atrophic gastritis with intestinal metaplasia | ||
| CSG: Chronic superficial gastritis | ||
| GC: Gastric cancer | ||
| SIM: Severe intestinal metaplasia | ||
| WIM: Wild intestinal metaplasia | ||
| Liver | 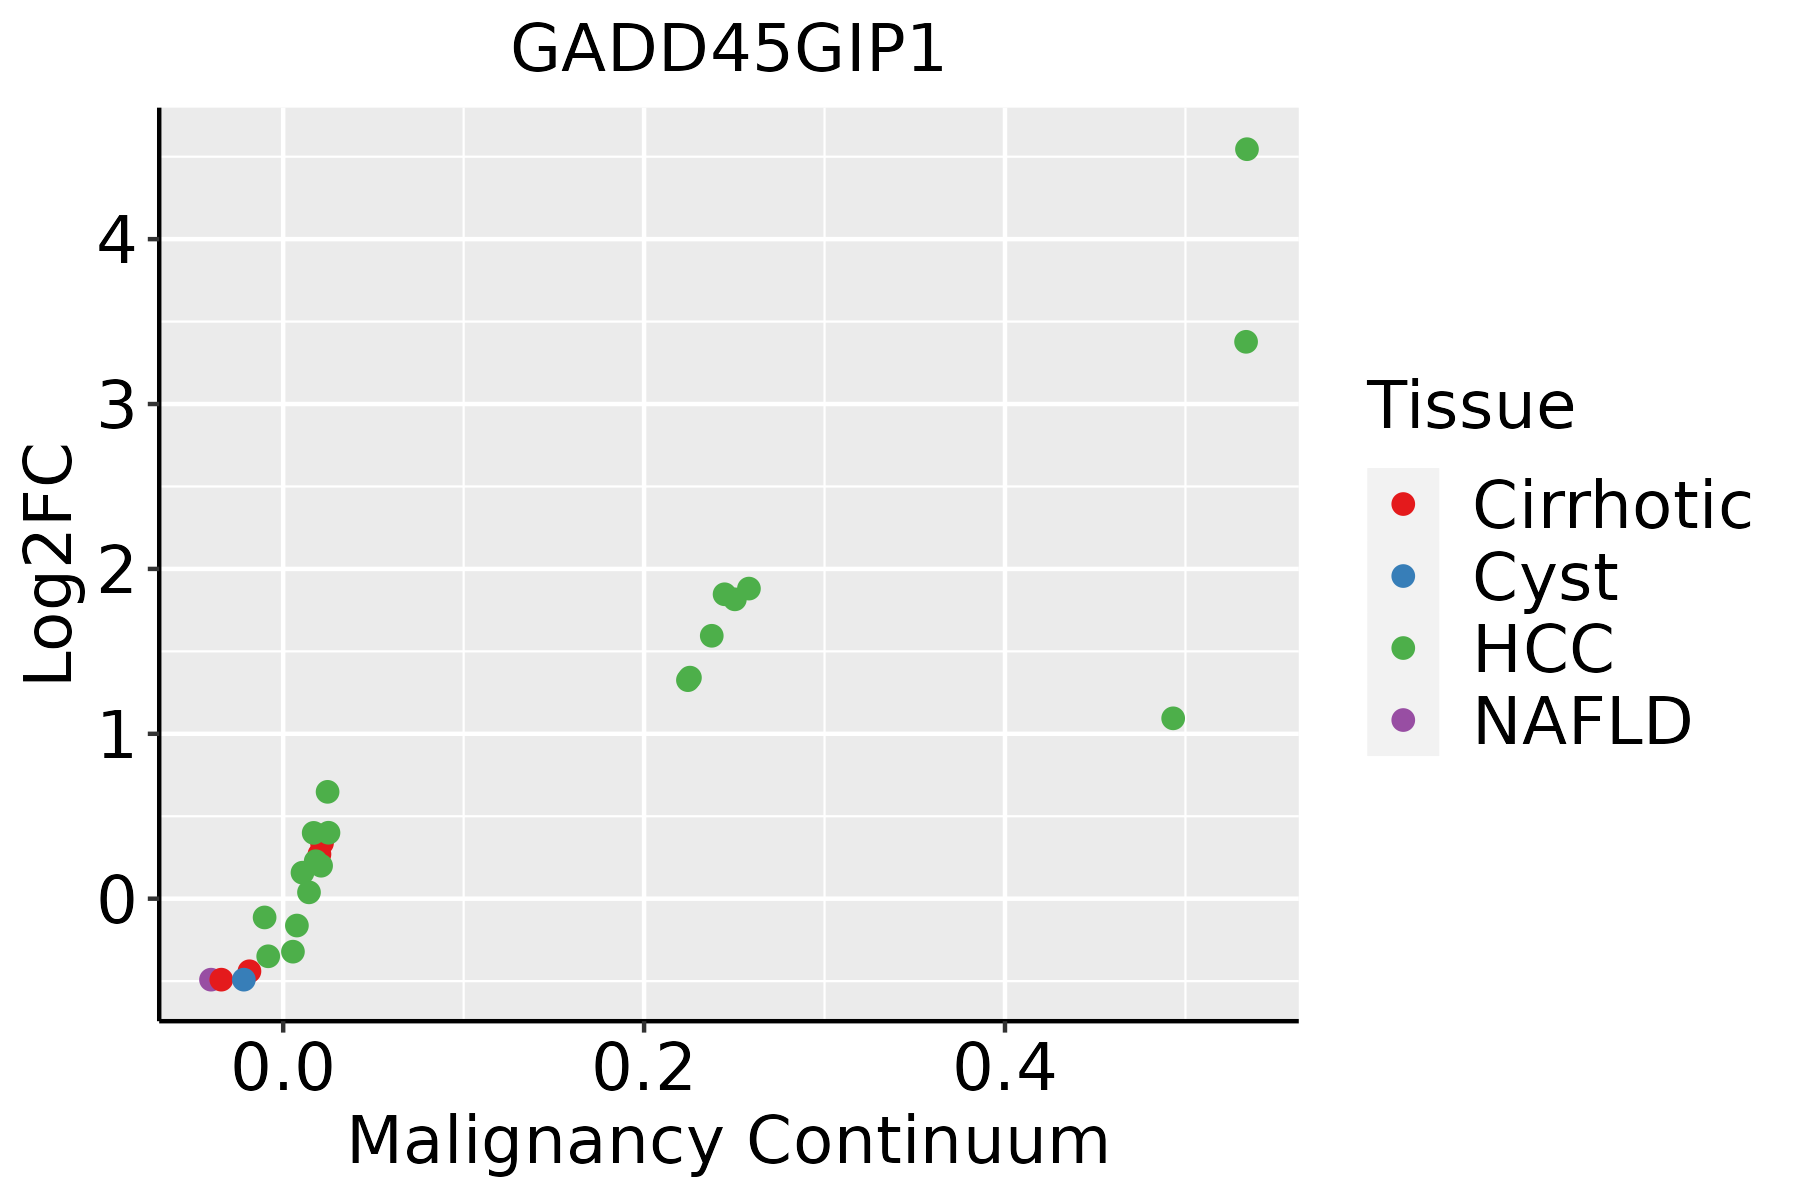 | HCC: Hepatocellular carcinoma |
| NAFLD: Non-alcoholic fatty liver disease | ||
| Oral Cavity | 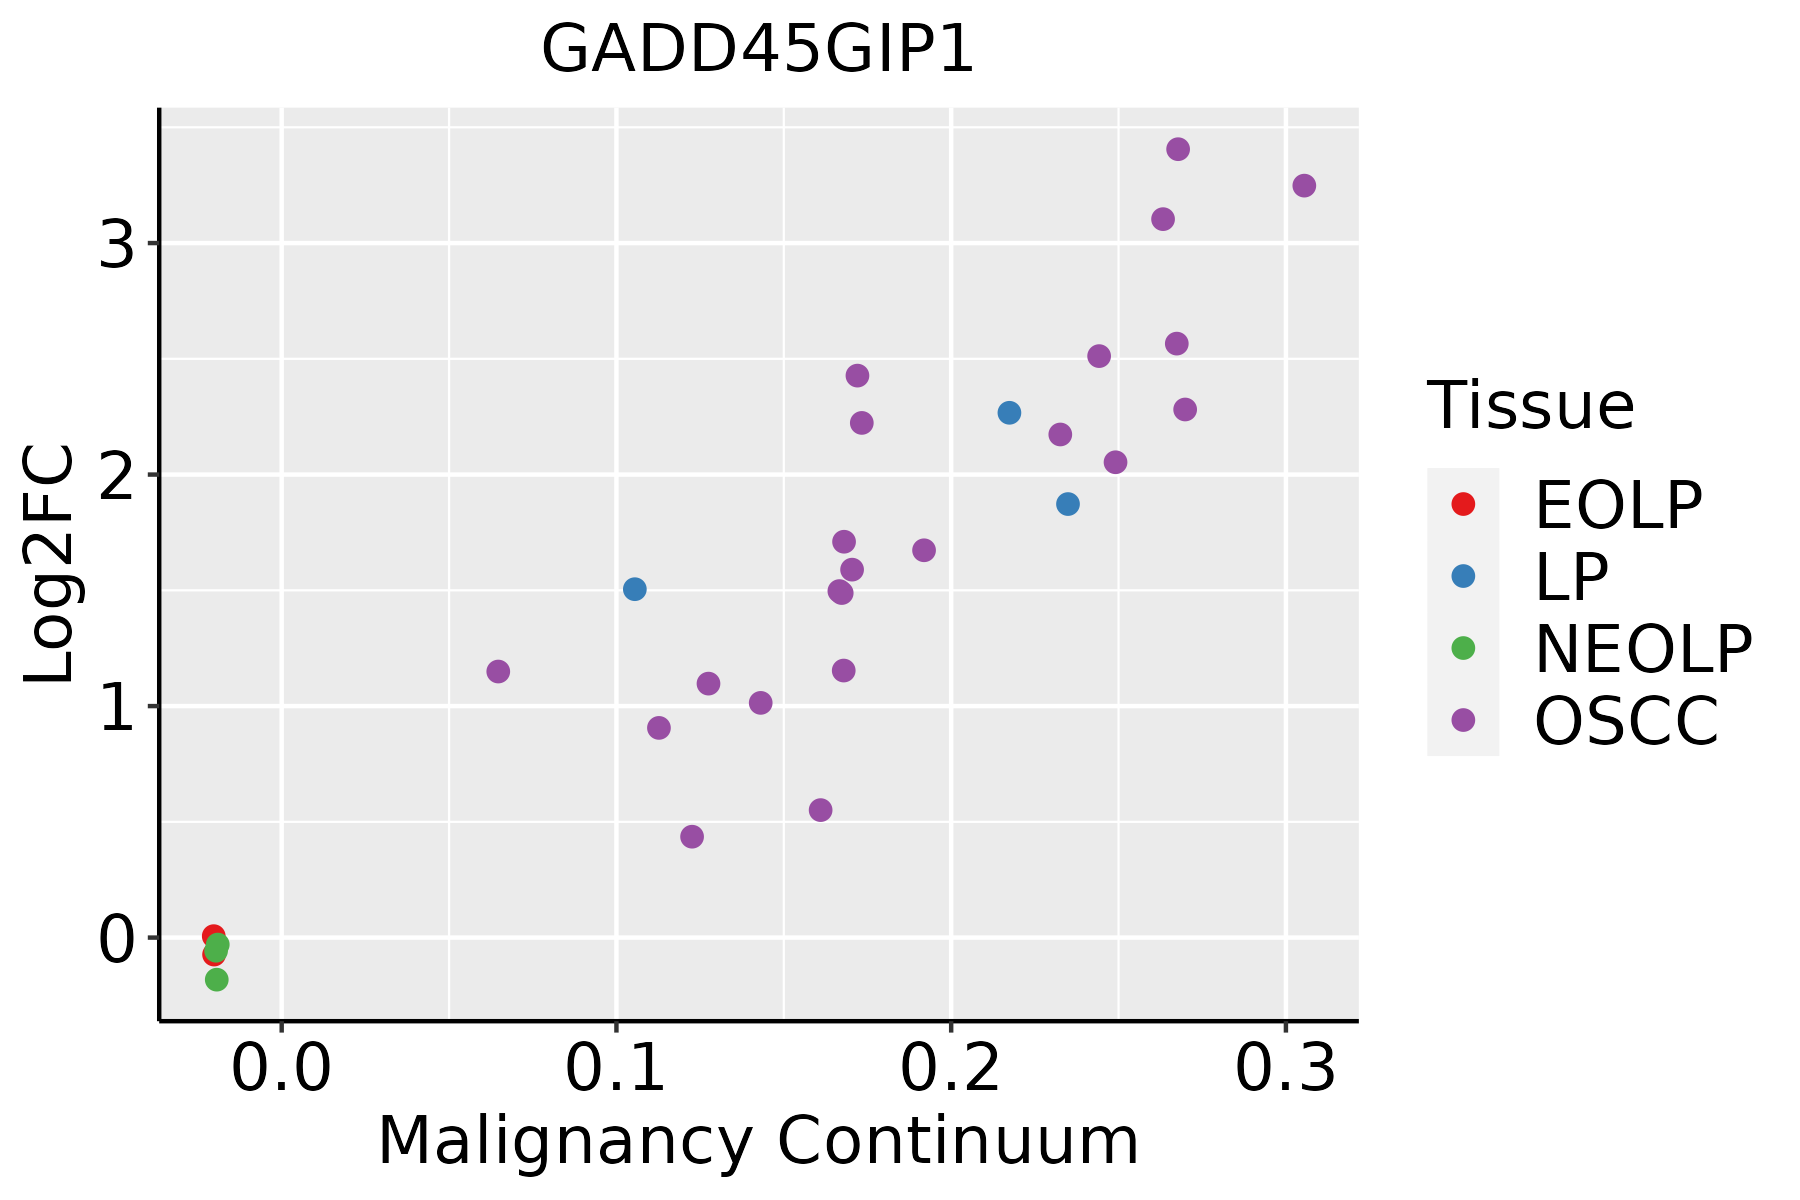 | EOLP: Erosive Oral lichen planus |
| LP: leukoplakia | ||
| NEOLP: Non-erosive oral lichen planus | ||
| OSCC: Oral squamous cell carcinoma | ||
| Prostate | 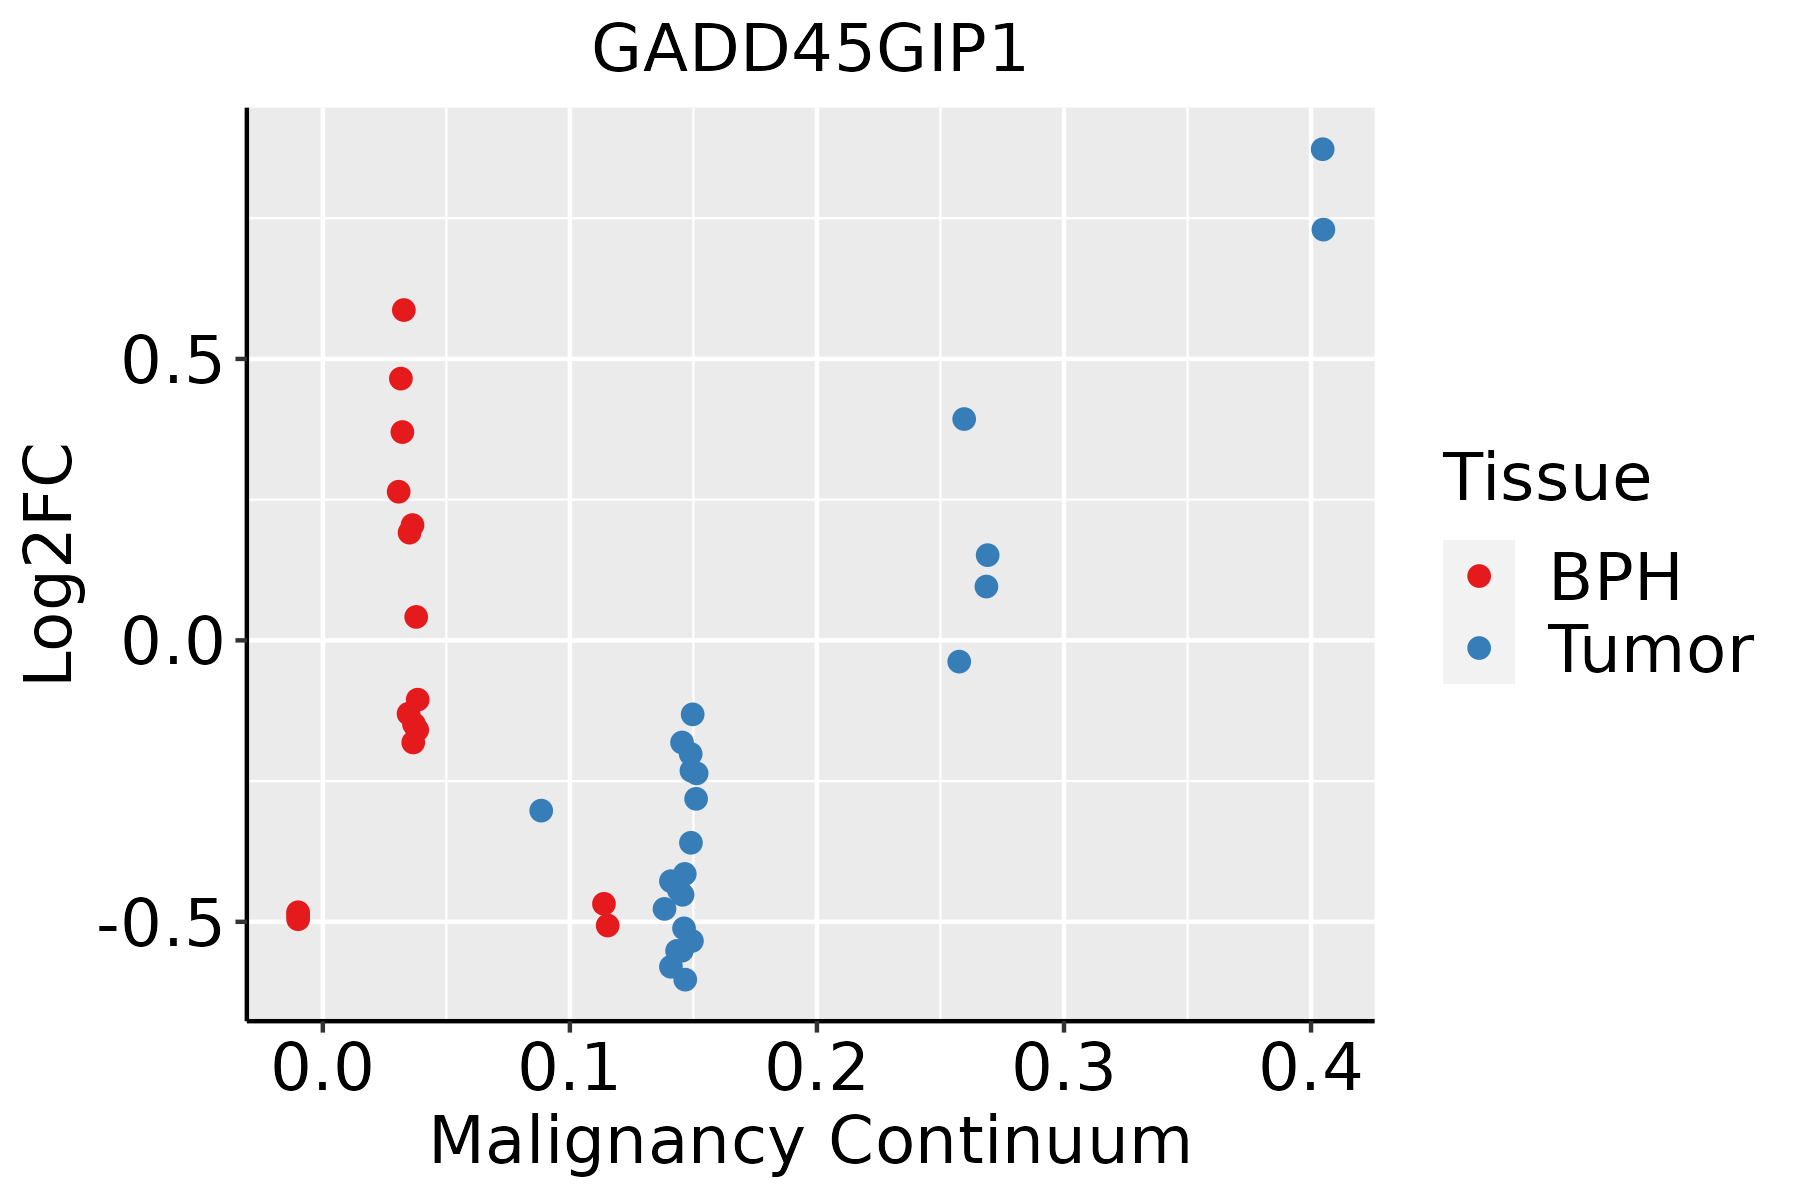 | BPH: Benign Prostatic Hyperplasia |
| Skin | 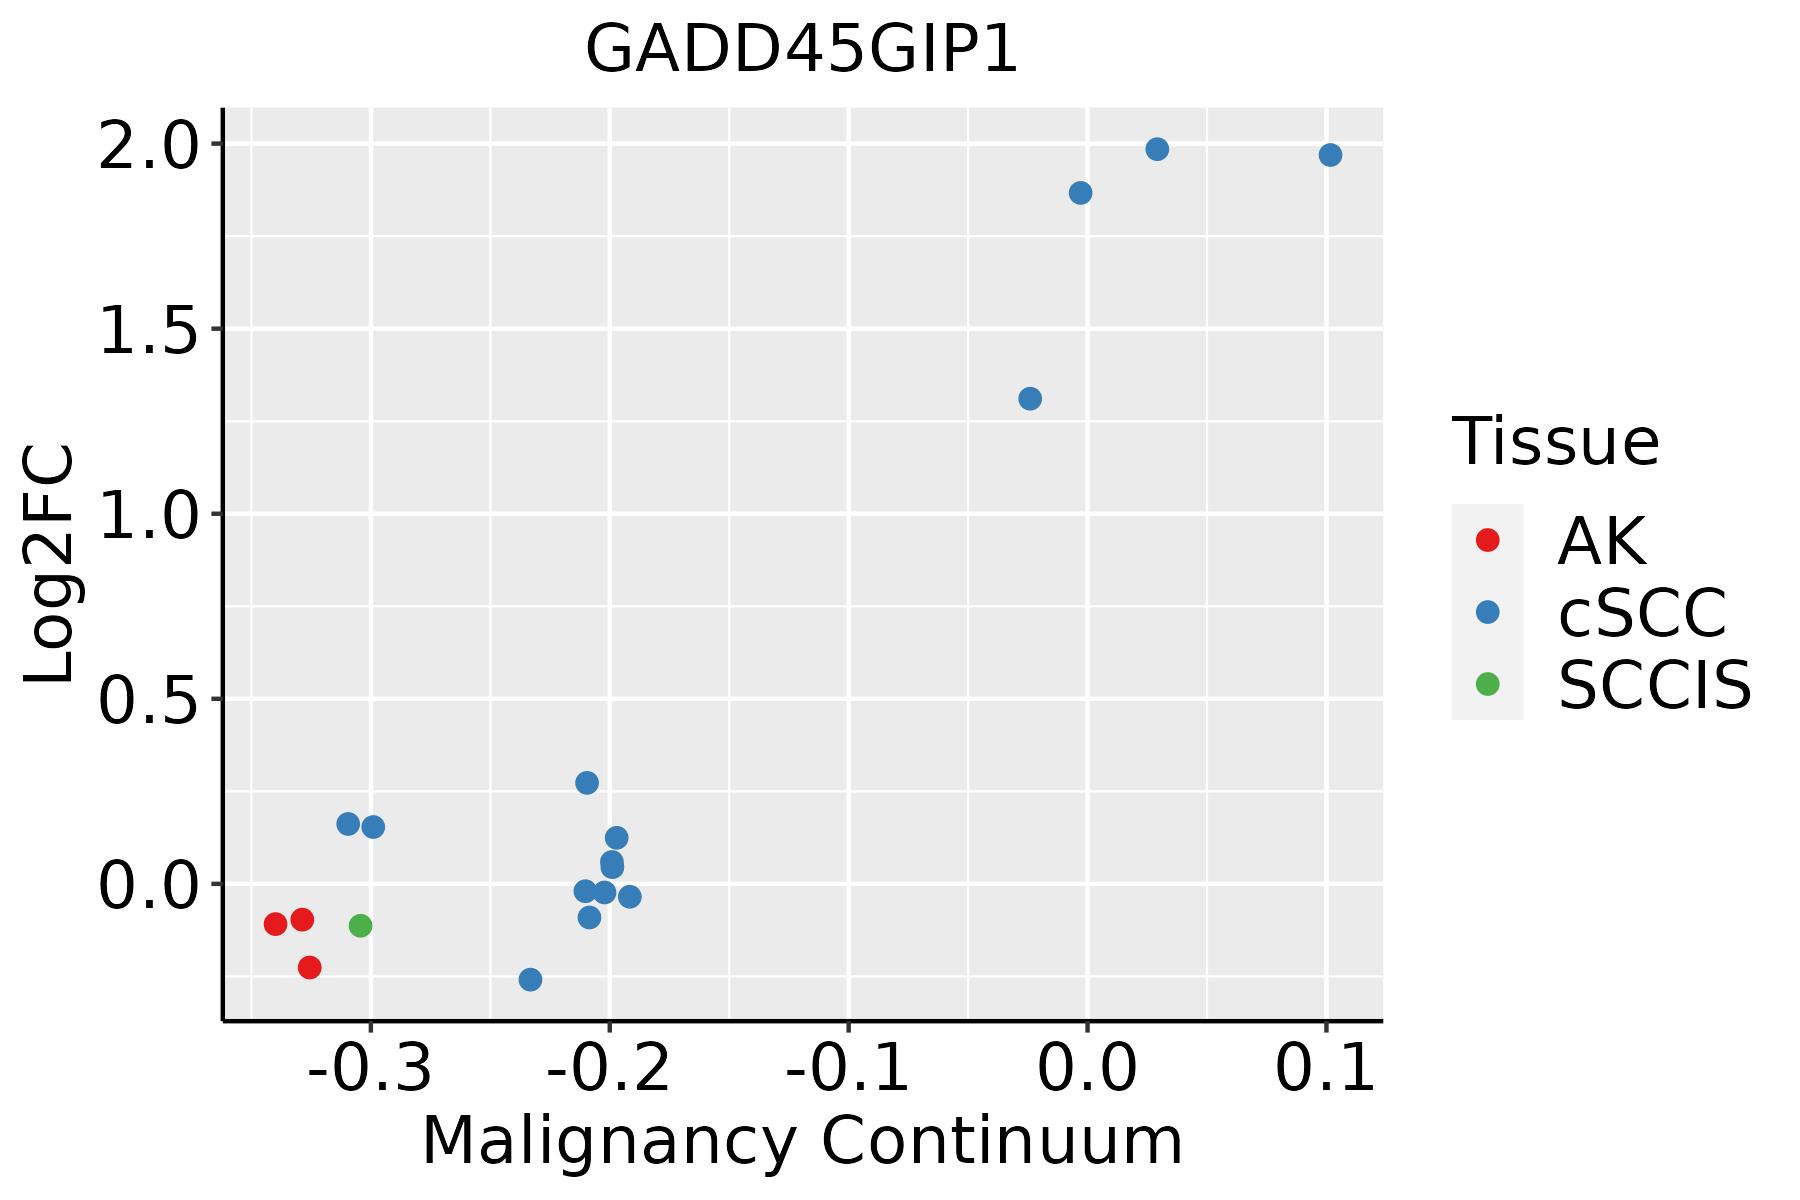 | AK: Actinic keratosis |
| cSCC: Cutaneous squamous cell carcinoma | ||
| SCCIS:squamous cell carcinoma in situ | ||
| Thyroid | 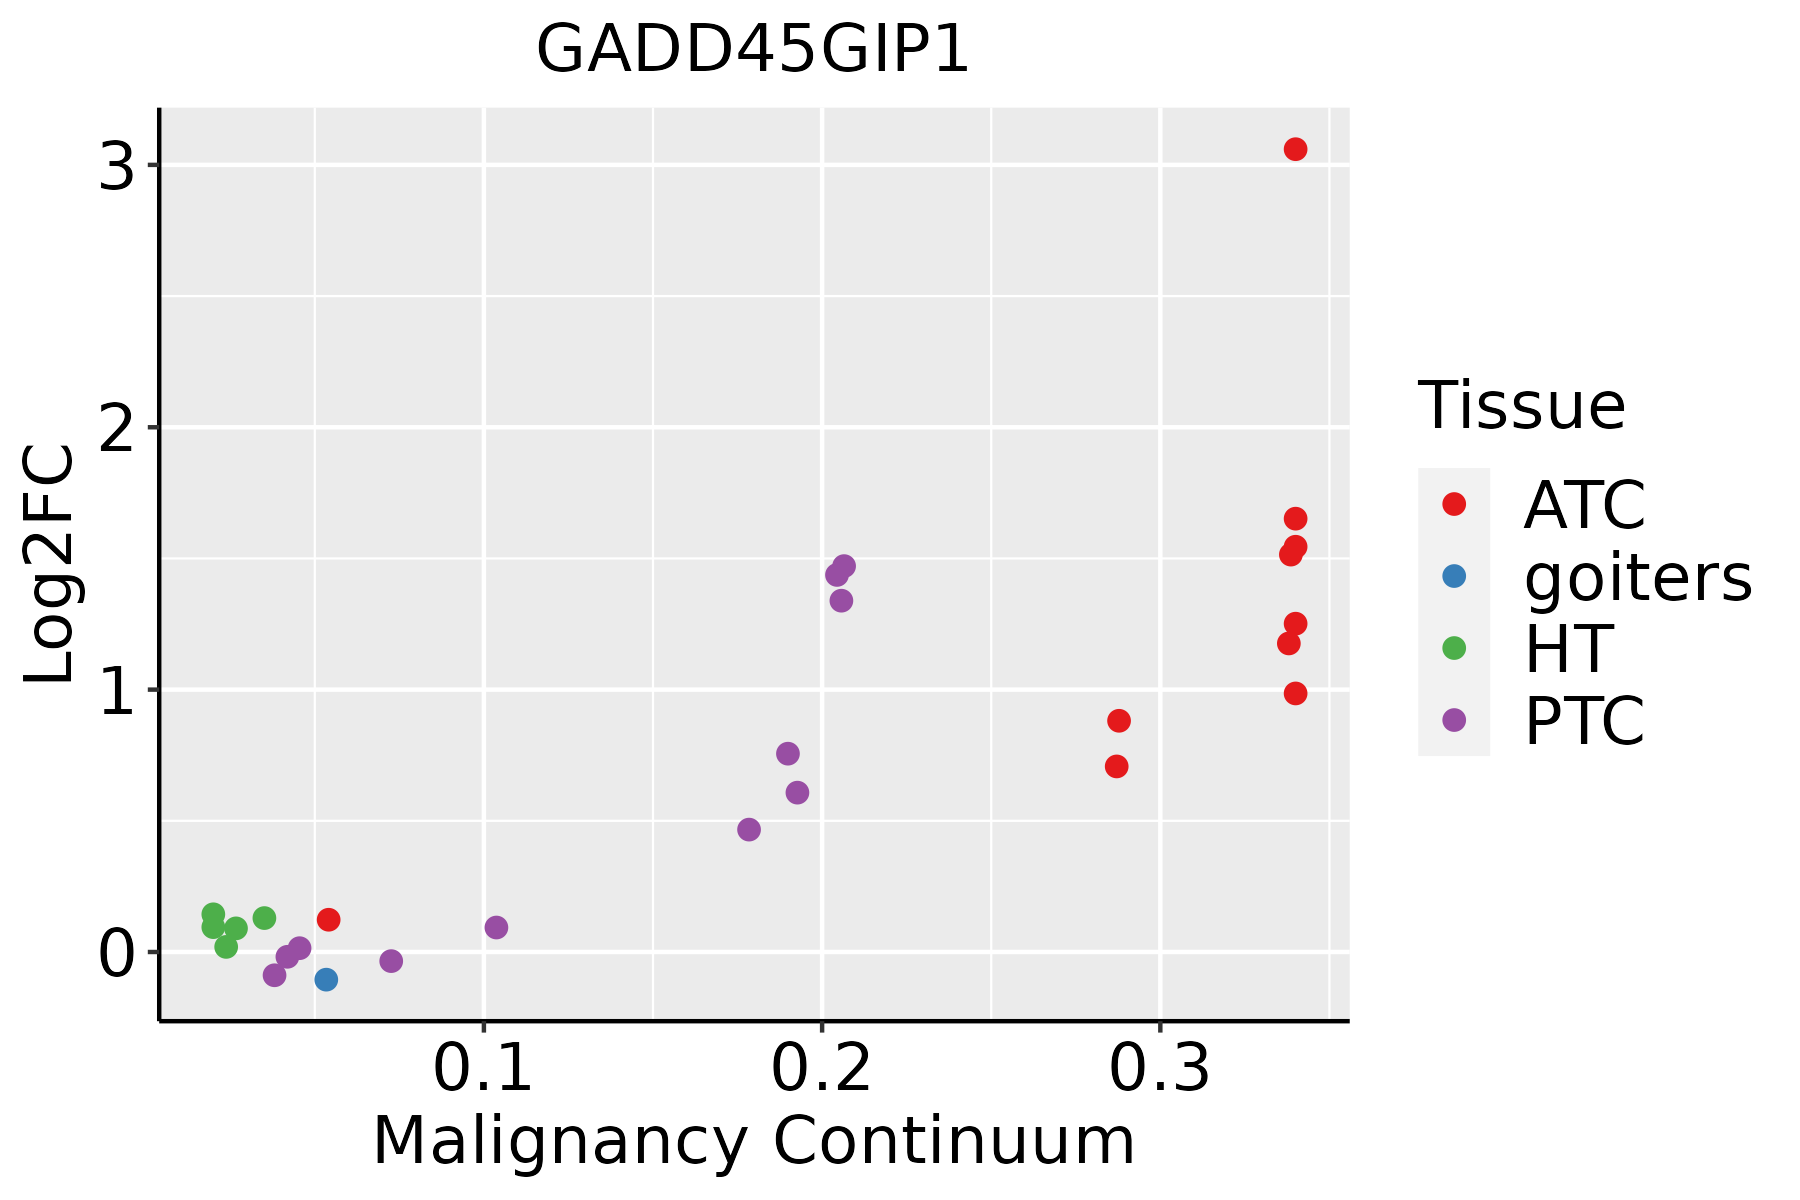 | ATC: Anaplastic thyroid cancer |
| HT: Hashimoto's thyroiditis | ||
| PTC: Papillary thyroid cancer |
| ∗log2FC in expression of this searched gene in stem-like cells from each diseased tissue sample relative to stem-like cells in normal samples in each tissue plotted against the malignancy continuum. Samples are colored based on if they are from different disease stage. |
Top |
Malignant transformation related pathway analysis |
| Find out the enriched GO biological processes and KEGG pathways involved in transition from healthy to precancer to cancer |
| Tissue | Disease Stage | Enriched GO biological Processes |
| Colorectum | AD |  |
| Colorectum | SER |  |
| Colorectum | MSS |  |
| Colorectum | MSI-H |  |
| Colorectum | FAP |  |
| ∗Top 15 enriched GO BP terms are showed in the bar plot of each disease state in each tissue. Each row represents a significant GO biological process which is colored according to the -log10(p.adjust). |
| Page: 1 2 3 4 5 6 7 8 9 |
| GO ID | Tissue | Disease Stage | Description | Gene Ratio | Bg Ratio | pvalue | p.adjust | Count |
| Page: 1 |
| Pathway ID | Tissue | Disease Stage | Description | Gene Ratio | Bg Ratio | pvalue | p.adjust | qvalue | Count |
| Page: 1 |
Top |
Cell-cell communication analysis |
| Identification of potential cell-cell interactions between two cell types and their ligand-receptor pairs for different disease states |
| Ligand | Receptor | LRpair | Pathway | Tissue | Disease Stage |
| Page: 1 |
Top |
Single-cell gene regulatory network inference analysis |
| Find out the significant the regulons (TFs) and the target genes of each regulon across cell types for different disease states |
| TF | Cell Type | Tissue | Disease Stage | Target Gene | RSS | Regulon Activity |
| ∗The dot plots of a searched regulon are shown for all cell subpopulations in each disease state of each tissue based on the regulon specific score inferred using pySCENIC and by calculating the average expression. |
| Page: 1 |
Top |
Somatic mutation of malignant transformation related genes |
| Annotation of somatic variants for genes involved in malignant transformation |
| Hugo Symbol | Variant Class | Variant Classification | dbSNP RS | HGVSc | HGVSp | HGVSp Short | SWISSPROT | BIOTYPE | SIFT | PolyPhen | Tumor Sample Barcode | Tissue | Histology | Sex | Age | Stage | Therapy Types | Drugs | Outcome |
| GADD45GIP1 | SNV | Missense_Mutation | novel | c.47N>T | p.Ala16Val | p.A16V | Q8TAE8 | protein_coding | tolerated(0.58) | benign(0.007) | TCGA-WS-AB45-01 | Colorectum | colon adenocarcinoma | Female | <65 | I/II | Unknown | Unknown | SD |
| GADD45GIP1 | deletion | Frame_Shift_Del | rs752340689 | c.585_586delNN | p.Lys196ThrfsTer43 | p.K196Tfs*43 | Q8TAE8 | protein_coding | TCGA-A6-6653-01 | Colorectum | colon adenocarcinoma | Male | >=65 | I/II | Unknown | Unknown | SD | ||
| GADD45GIP1 | SNV | Missense_Mutation | novel | c.301N>A | p.Glu101Lys | p.E101K | Q8TAE8 | protein_coding | tolerated(0.3) | benign(0.23) | TCGA-A5-A1OF-01 | Endometrium | uterine corpus endometrioid carcinoma | Female | <65 | I/II | Unknown | Unknown | SD |
| GADD45GIP1 | SNV | Missense_Mutation | novel | c.184N>A | p.Ala62Thr | p.A62T | Q8TAE8 | protein_coding | deleterious(0) | benign(0.023) | TCGA-A5-A1OF-01 | Endometrium | uterine corpus endometrioid carcinoma | Female | <65 | I/II | Unknown | Unknown | SD |
| GADD45GIP1 | SNV | Missense_Mutation | rs147251319 | c.566G>A | p.Arg189His | p.R189H | Q8TAE8 | protein_coding | tolerated(0.07) | probably_damaging(0.945) | TCGA-AX-A1CE-01 | Endometrium | uterine corpus endometrioid carcinoma | Female | <65 | I/II | Unspecific | Paclitaxel | SD |
| GADD45GIP1 | SNV | Missense_Mutation | rs779779033 | c.560G>A | p.Arg187His | p.R187H | Q8TAE8 | protein_coding | deleterious(0) | probably_damaging(0.984) | TCGA-B5-A3FA-01 | Endometrium | uterine corpus endometrioid carcinoma | Female | >=65 | I/II | Unknown | Unknown | SD |
| GADD45GIP1 | SNV | Missense_Mutation | rs763367169 | c.521N>A | p.Arg174His | p.R174H | Q8TAE8 | protein_coding | deleterious(0) | probably_damaging(0.96) | TCGA-D1-A103-01 | Endometrium | uterine corpus endometrioid carcinoma | Female | >=65 | I/II | Unknown | Unknown | SD |
| GADD45GIP1 | SNV | Missense_Mutation | novel | c.585N>T | p.Gln195His | p.Q195H | Q8TAE8 | protein_coding | deleterious(0.01) | possibly_damaging(0.855) | TCGA-EO-A22R-01 | Endometrium | uterine corpus endometrioid carcinoma | Female | <65 | I/II | Unknown | Unknown | SD |
| GADD45GIP1 | SNV | Missense_Mutation | rs753799047 | c.559C>T | p.Arg187Cys | p.R187C | Q8TAE8 | protein_coding | deleterious(0) | probably_damaging(0.993) | TCGA-EO-A22U-01 | Endometrium | uterine corpus endometrioid carcinoma | Female | >=65 | I/II | Unknown | Unknown | SD |
| GADD45GIP1 | SNV | Missense_Mutation | rs755977311 | c.565N>T | p.Arg189Cys | p.R189C | Q8TAE8 | protein_coding | deleterious(0) | probably_damaging(0.981) | TCGA-EY-A1H0-01 | Endometrium | uterine corpus endometrioid carcinoma | Female | <65 | III/IV | Chemotherapy | taxol | SD |
| Page: 1 2 |
Top |
Related drugs of malignant transformation related genes |
| Identification of chemicals and drugs interact with genes involved in malignant transfromation |
| (DGIdb 4.0) |
| Entrez ID | Symbol | Category | Interaction Types | Drug Claim Name | Drug Name | PMIDs |
| Page: 1 |

Copyright 2023-Present -The University of Texas Health Science Center at Houston |