
|
|||||
|
 | |
| |
| |
| |
| |
| |
|
Gene: EMP2 |
Gene summary for EMP2 |
| Gene information | Species | Human | Gene symbol | EMP2 | Gene ID | 2013 |
| Gene name | epithelial membrane protein 2 | |
| Gene Alias | XMP | |
| Cytomap | 16p13.13 | |
| Gene Type | protein-coding | GO ID | GO:0000003 | UniProtAcc | P54851 |
Top |
Malignant transformation analysis |
| Identification of the aberrant gene expression in precancerous and cancerous lesions by comparing the gene expression of stem-like cells in diseased tissues with normal stem cells |
| Entrez ID | Symbol | Replicates | Species | Organ | Tissue | Adj P-value | Log2FC | Malignancy |
| 2013 | EMP2 | P75T-E | Human | Esophagus | ESCC | 4.34e-74 | 1.56e+00 | 0.1125 |
| 2013 | EMP2 | P76T-E | Human | Esophagus | ESCC | 3.20e-43 | 1.19e+00 | 0.1207 |
| 2013 | EMP2 | P79T-E | Human | Esophagus | ESCC | 2.62e-66 | 1.65e+00 | 0.1154 |
| 2013 | EMP2 | P80T-E | Human | Esophagus | ESCC | 2.27e-59 | 2.91e+00 | 0.155 |
| 2013 | EMP2 | P82T-E | Human | Esophagus | ESCC | 1.88e-19 | 1.64e+00 | 0.1072 |
| 2013 | EMP2 | P83T-E | Human | Esophagus | ESCC | 2.50e-68 | 3.16e+00 | 0.1738 |
| 2013 | EMP2 | P84T-E | Human | Esophagus | ESCC | 2.42e-25 | 2.48e+00 | 0.0933 |
| 2013 | EMP2 | P89T-E | Human | Esophagus | ESCC | 5.31e-22 | 2.52e+00 | 0.1752 |
| 2013 | EMP2 | P91T-E | Human | Esophagus | ESCC | 3.28e-20 | 2.76e+00 | 0.1828 |
| 2013 | EMP2 | P107T-E | Human | Esophagus | ESCC | 2.62e-62 | 1.88e+00 | 0.171 |
| 2013 | EMP2 | P126T-E | Human | Esophagus | ESCC | 7.34e-08 | 1.79e+00 | 0.1125 |
| 2013 | EMP2 | P127T-E | Human | Esophagus | ESCC | 1.69e-51 | 1.16e+00 | 0.0826 |
| 2013 | EMP2 | P128T-E | Human | Esophagus | ESCC | 1.37e-39 | 1.75e+00 | 0.1241 |
| 2013 | EMP2 | P130T-E | Human | Esophagus | ESCC | 9.19e-26 | 8.57e-01 | 0.1676 |
| 2013 | EMP2 | NAFLD1 | Human | Liver | NAFLD | 1.14e-02 | 3.93e-01 | -0.04 |
| 2013 | EMP2 | S43 | Human | Liver | Cirrhotic | 1.97e-03 | -5.30e-02 | -0.0187 |
| 2013 | EMP2 | HCC1_Meng | Human | Liver | HCC | 7.77e-45 | -1.15e-01 | 0.0246 |
| 2013 | EMP2 | HCC2_Meng | Human | Liver | HCC | 6.21e-42 | 3.14e-01 | 0.0107 |
| 2013 | EMP2 | cirrhotic1 | Human | Liver | Cirrhotic | 3.55e-12 | 4.22e-01 | 0.0202 |
| 2013 | EMP2 | cirrhotic2 | Human | Liver | Cirrhotic | 2.85e-03 | 6.43e-02 | 0.0201 |
| Page: 1 2 3 4 5 6 7 8 9 10 11 12 13 |
| Tissue | Expression Dynamics | Abbreviation |
| Breast | 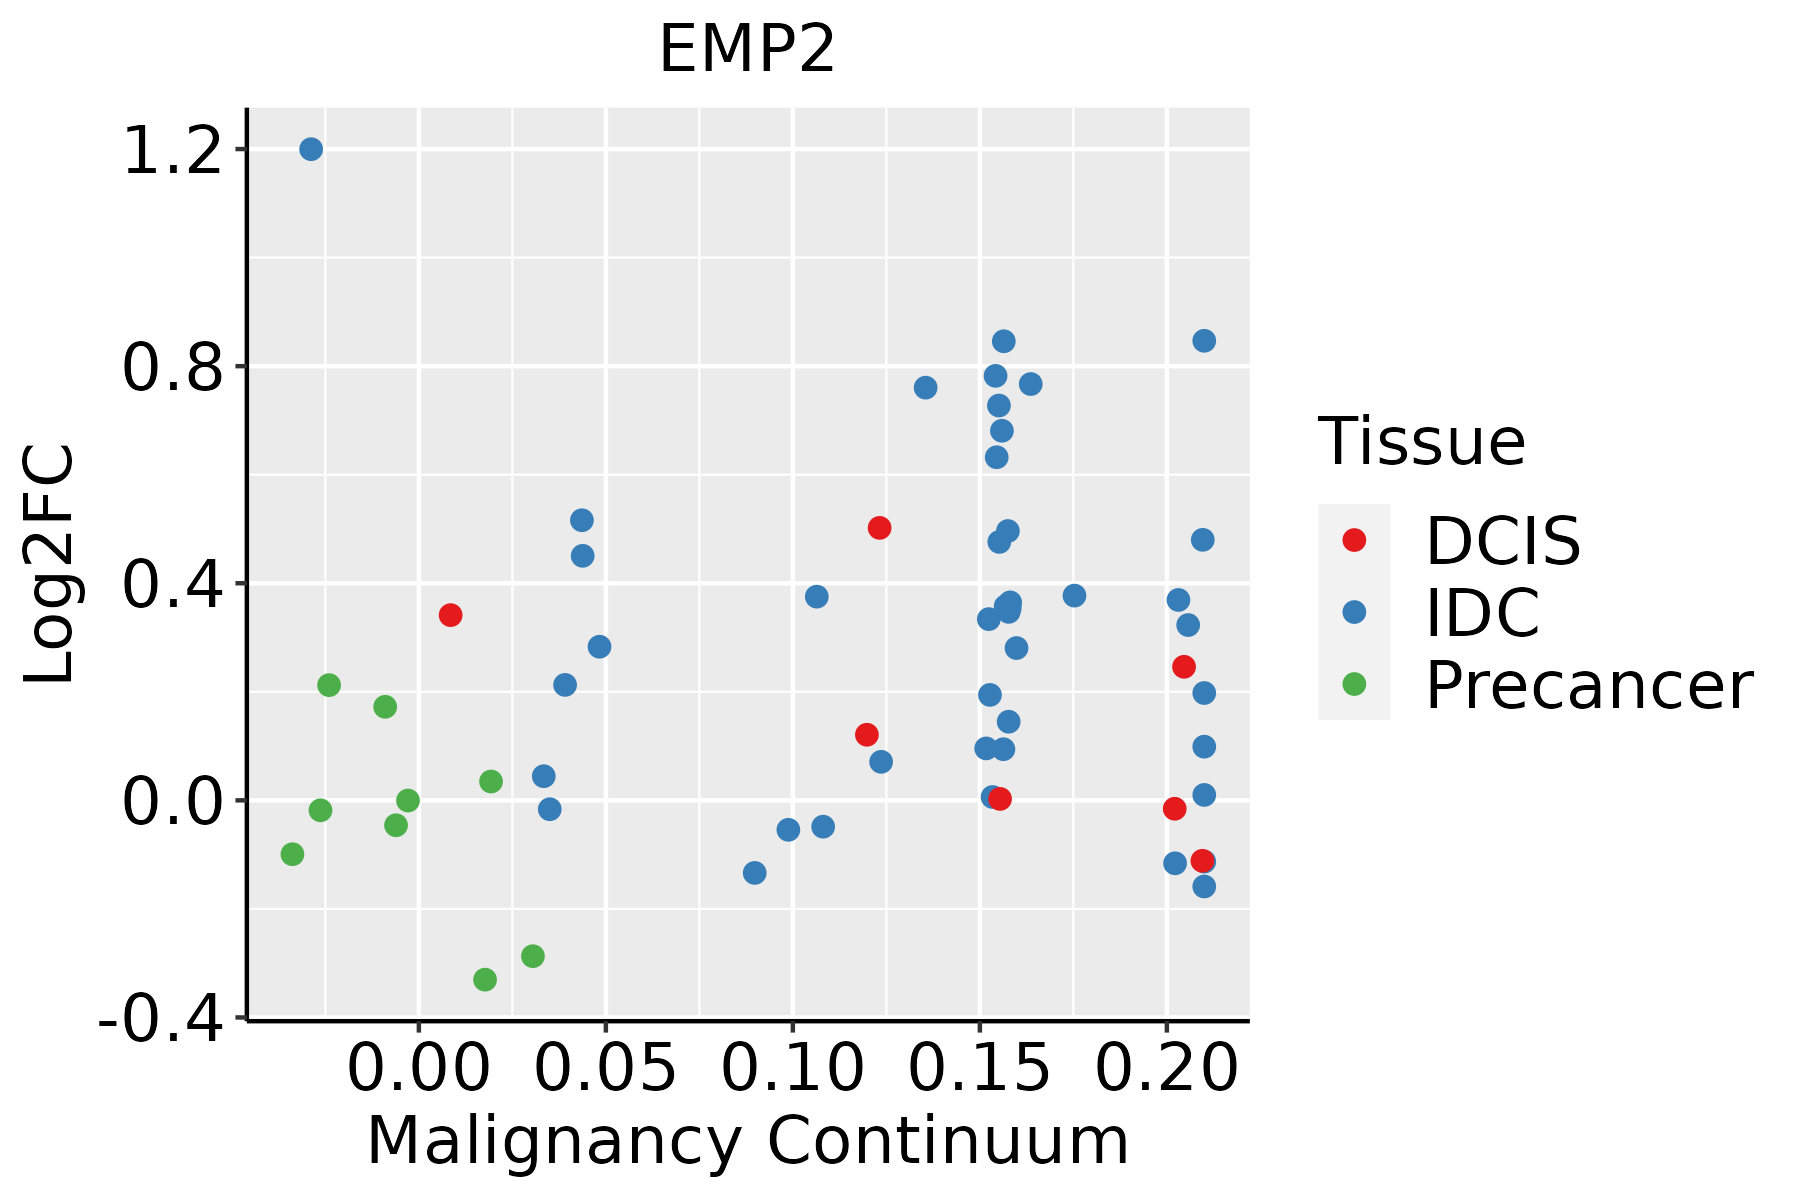 | IDC: Invasive ductal carcinoma |
| DCIS: Ductal carcinoma in situ | ||
| Precancer(BRCA1-mut): Precancerous lesion from BRCA1 mutation carriers | ||
| Cervix | 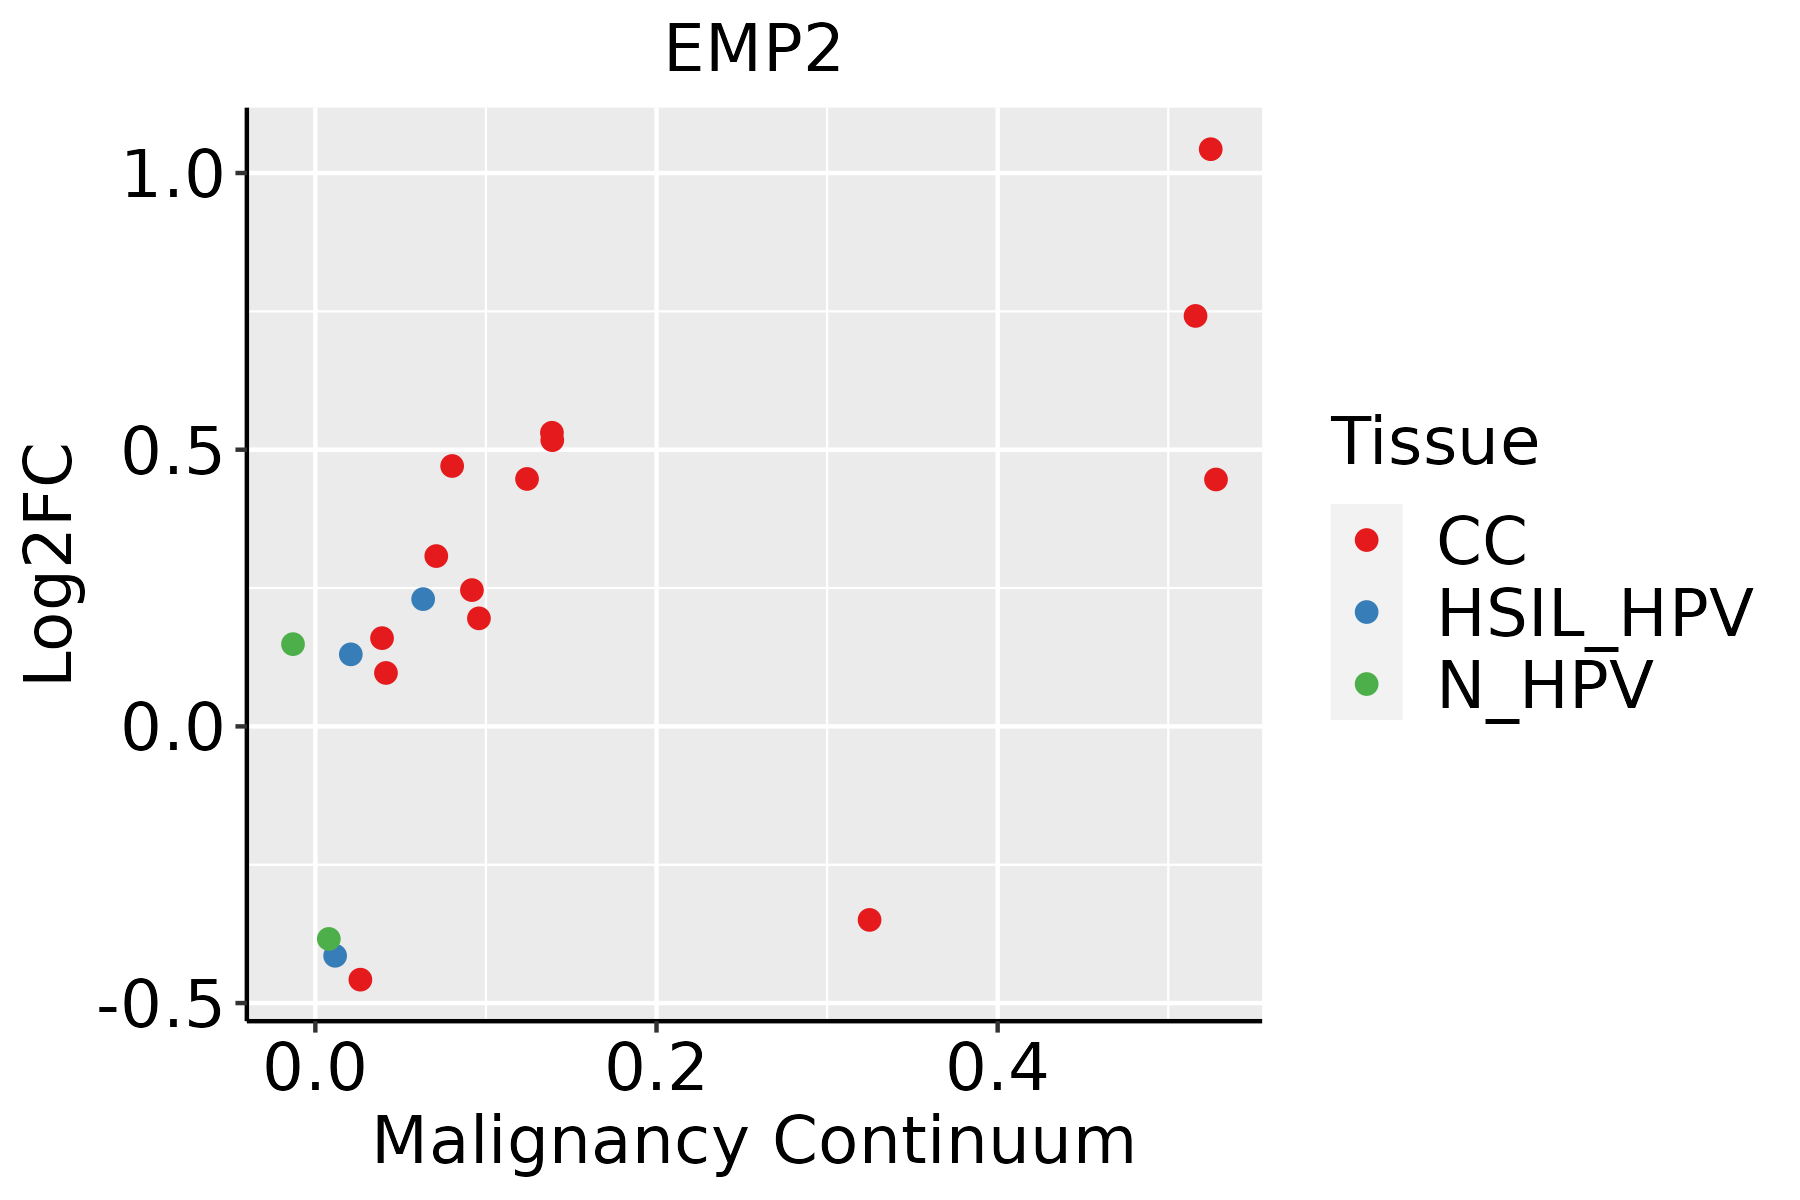 | CC: Cervix cancer |
| HSIL_HPV: HPV-infected high-grade squamous intraepithelial lesions | ||
| N_HPV: HPV-infected normal cervix | ||
| Colorectum (GSE201348) |  | FAP: Familial adenomatous polyposis |
| CRC: Colorectal cancer | ||
| Colorectum (HTA11) |  | AD: Adenomas |
| SER: Sessile serrated lesions | ||
| MSI-H: Microsatellite-high colorectal cancer | ||
| MSS: Microsatellite stable colorectal cancer | ||
| Esophagus |  | ESCC: Esophageal squamous cell carcinoma |
| HGIN: High-grade intraepithelial neoplasias | ||
| LGIN: Low-grade intraepithelial neoplasias | ||
| Liver |  | HCC: Hepatocellular carcinoma |
| NAFLD: Non-alcoholic fatty liver disease | ||
| Lung | 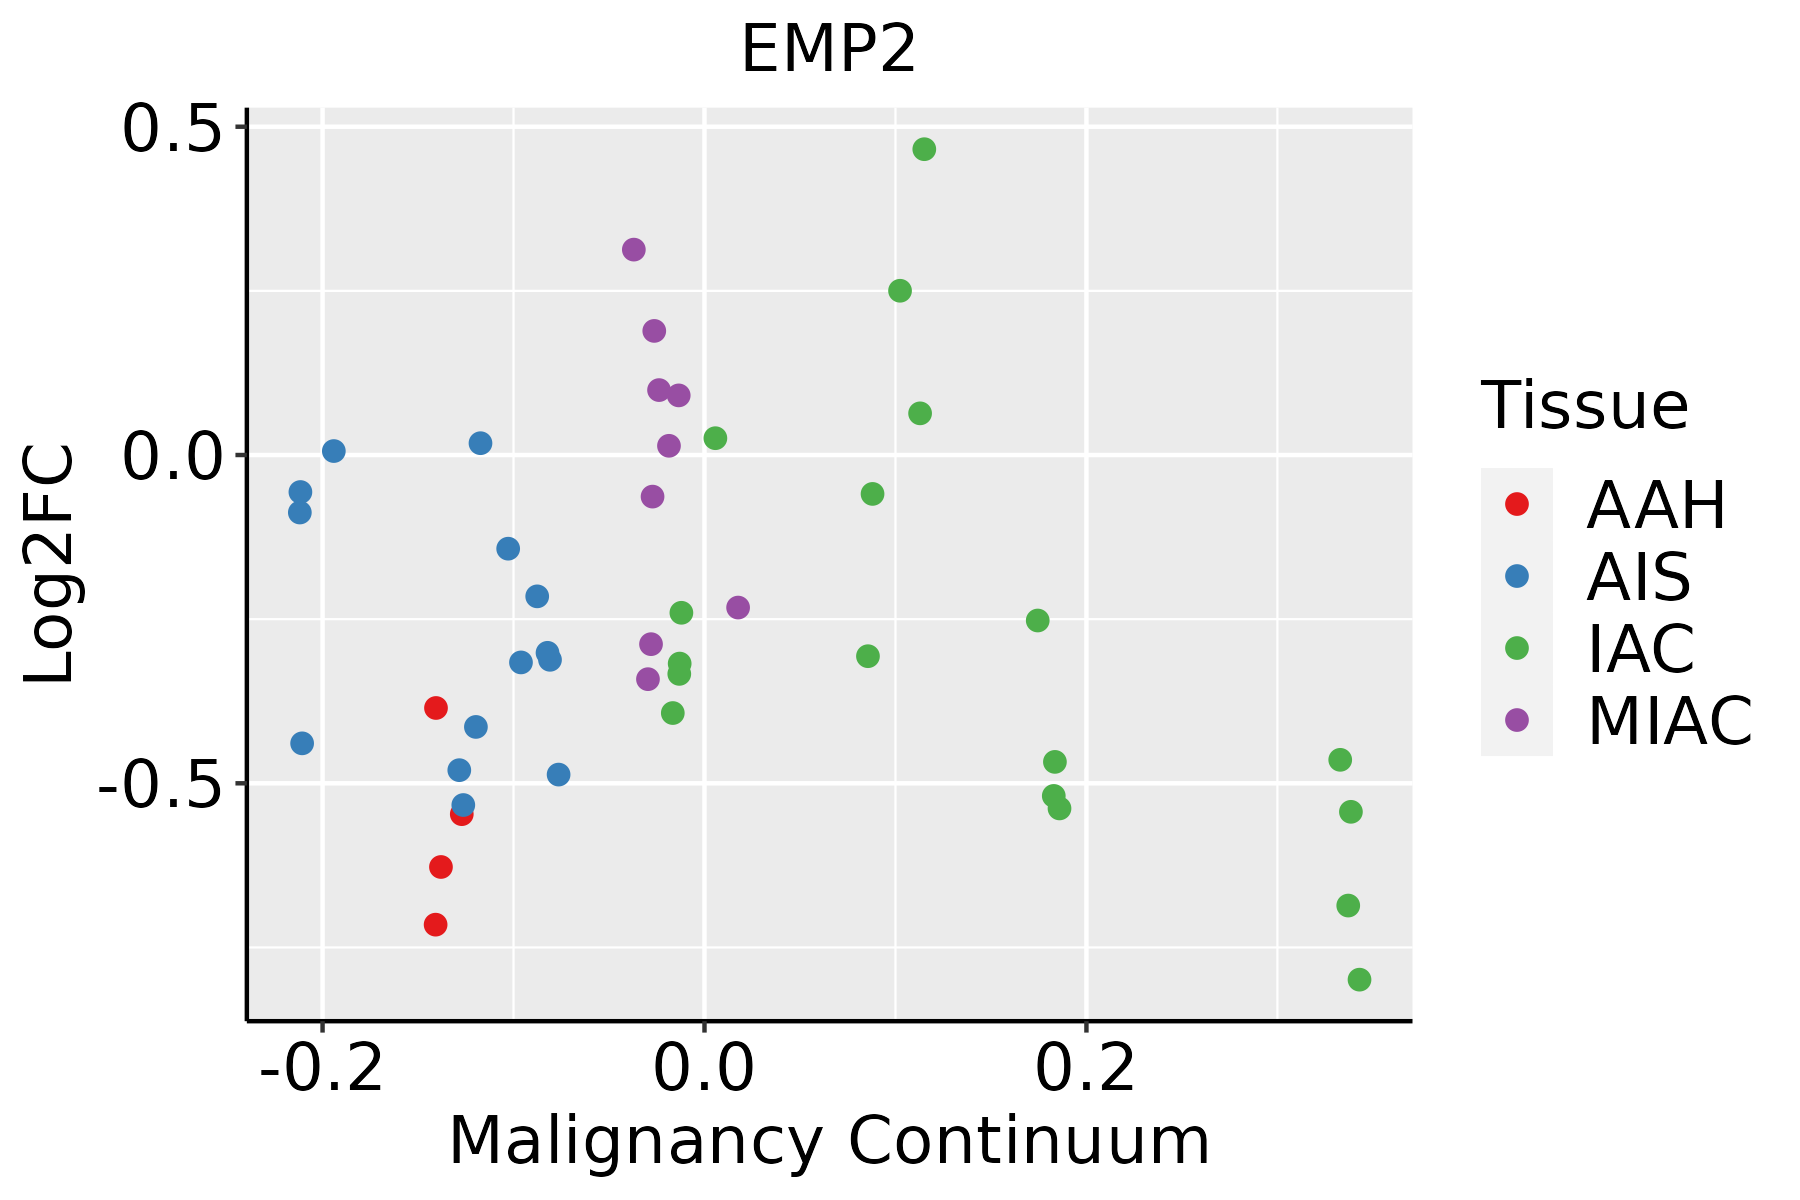 | AAH: Atypical adenomatous hyperplasia |
| AIS: Adenocarcinoma in situ | ||
| IAC: Invasive lung adenocarcinoma | ||
| MIA: Minimally invasive adenocarcinoma | ||
| Oral Cavity | 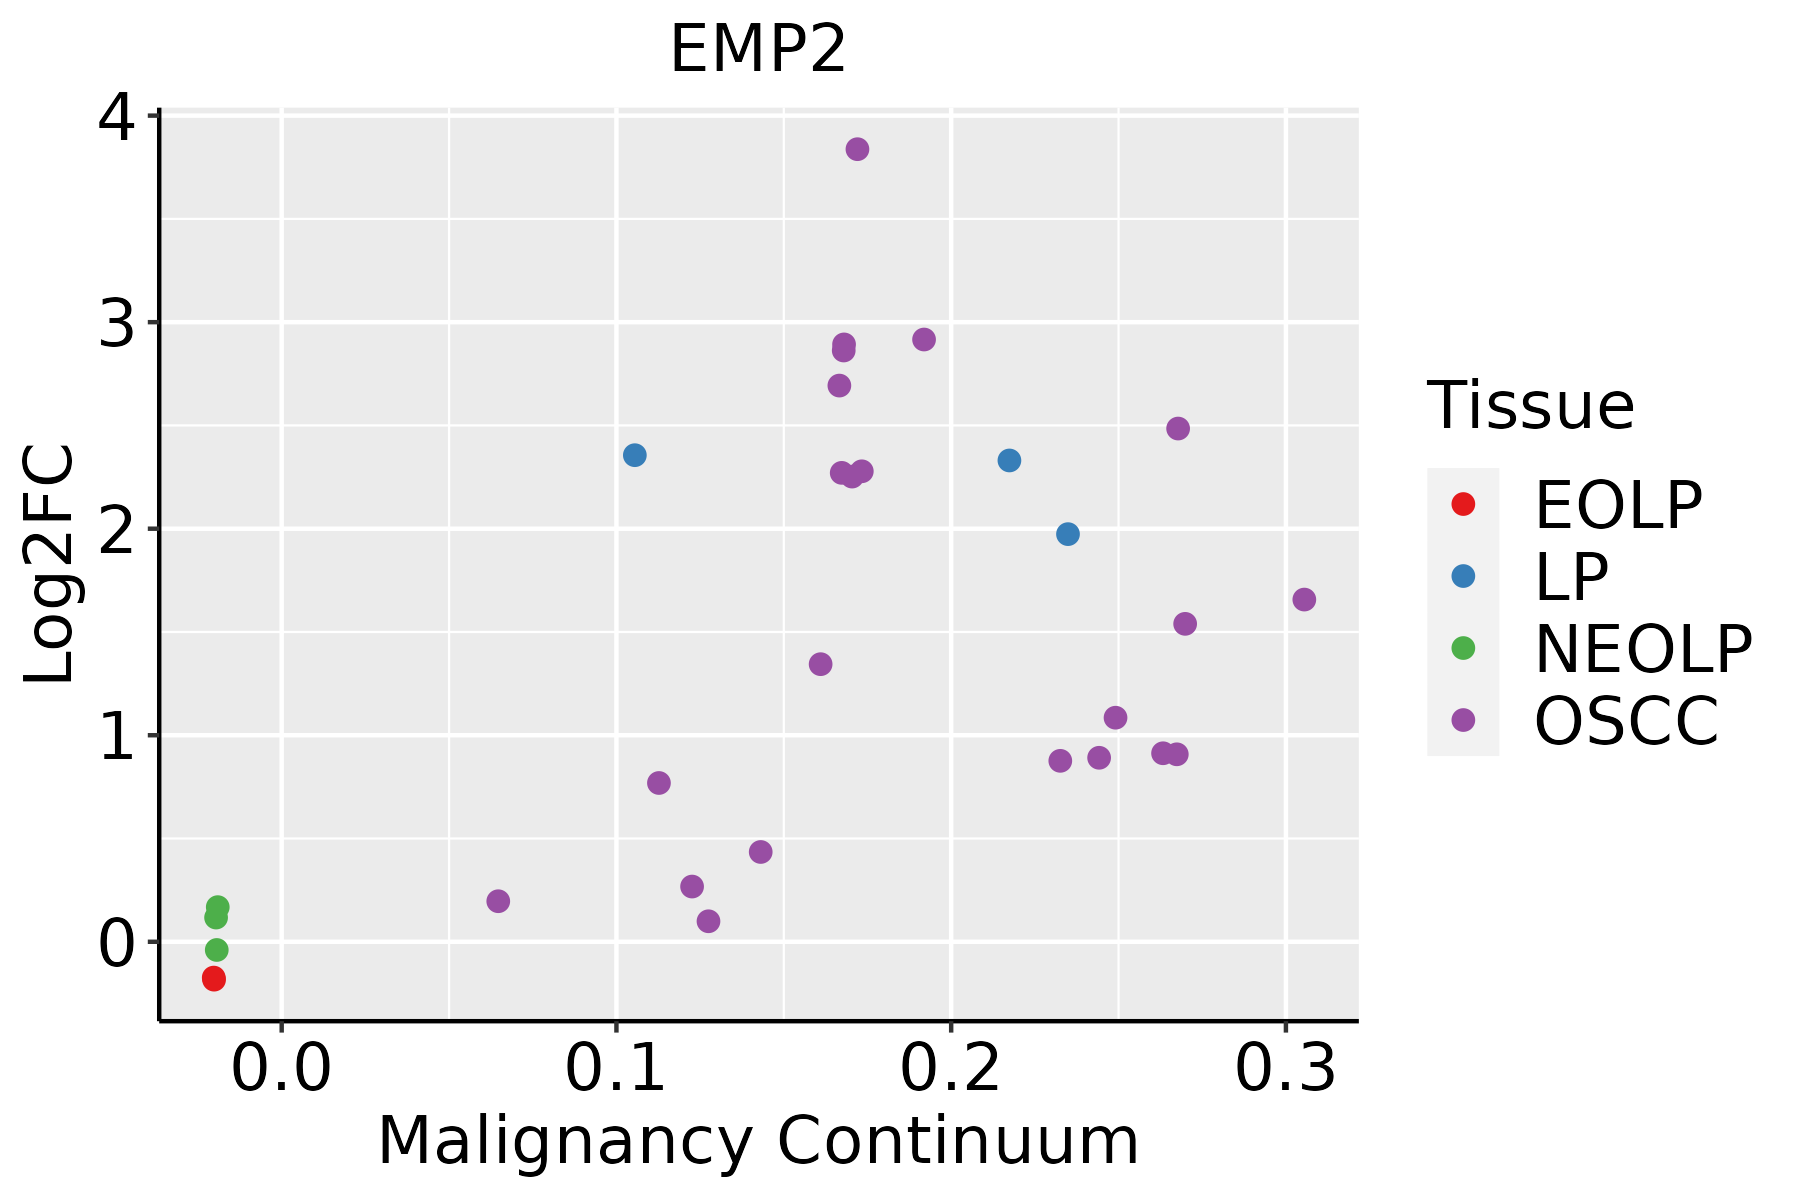 | EOLP: Erosive Oral lichen planus |
| LP: leukoplakia | ||
| NEOLP: Non-erosive oral lichen planus | ||
| OSCC: Oral squamous cell carcinoma | ||
| Prostate | 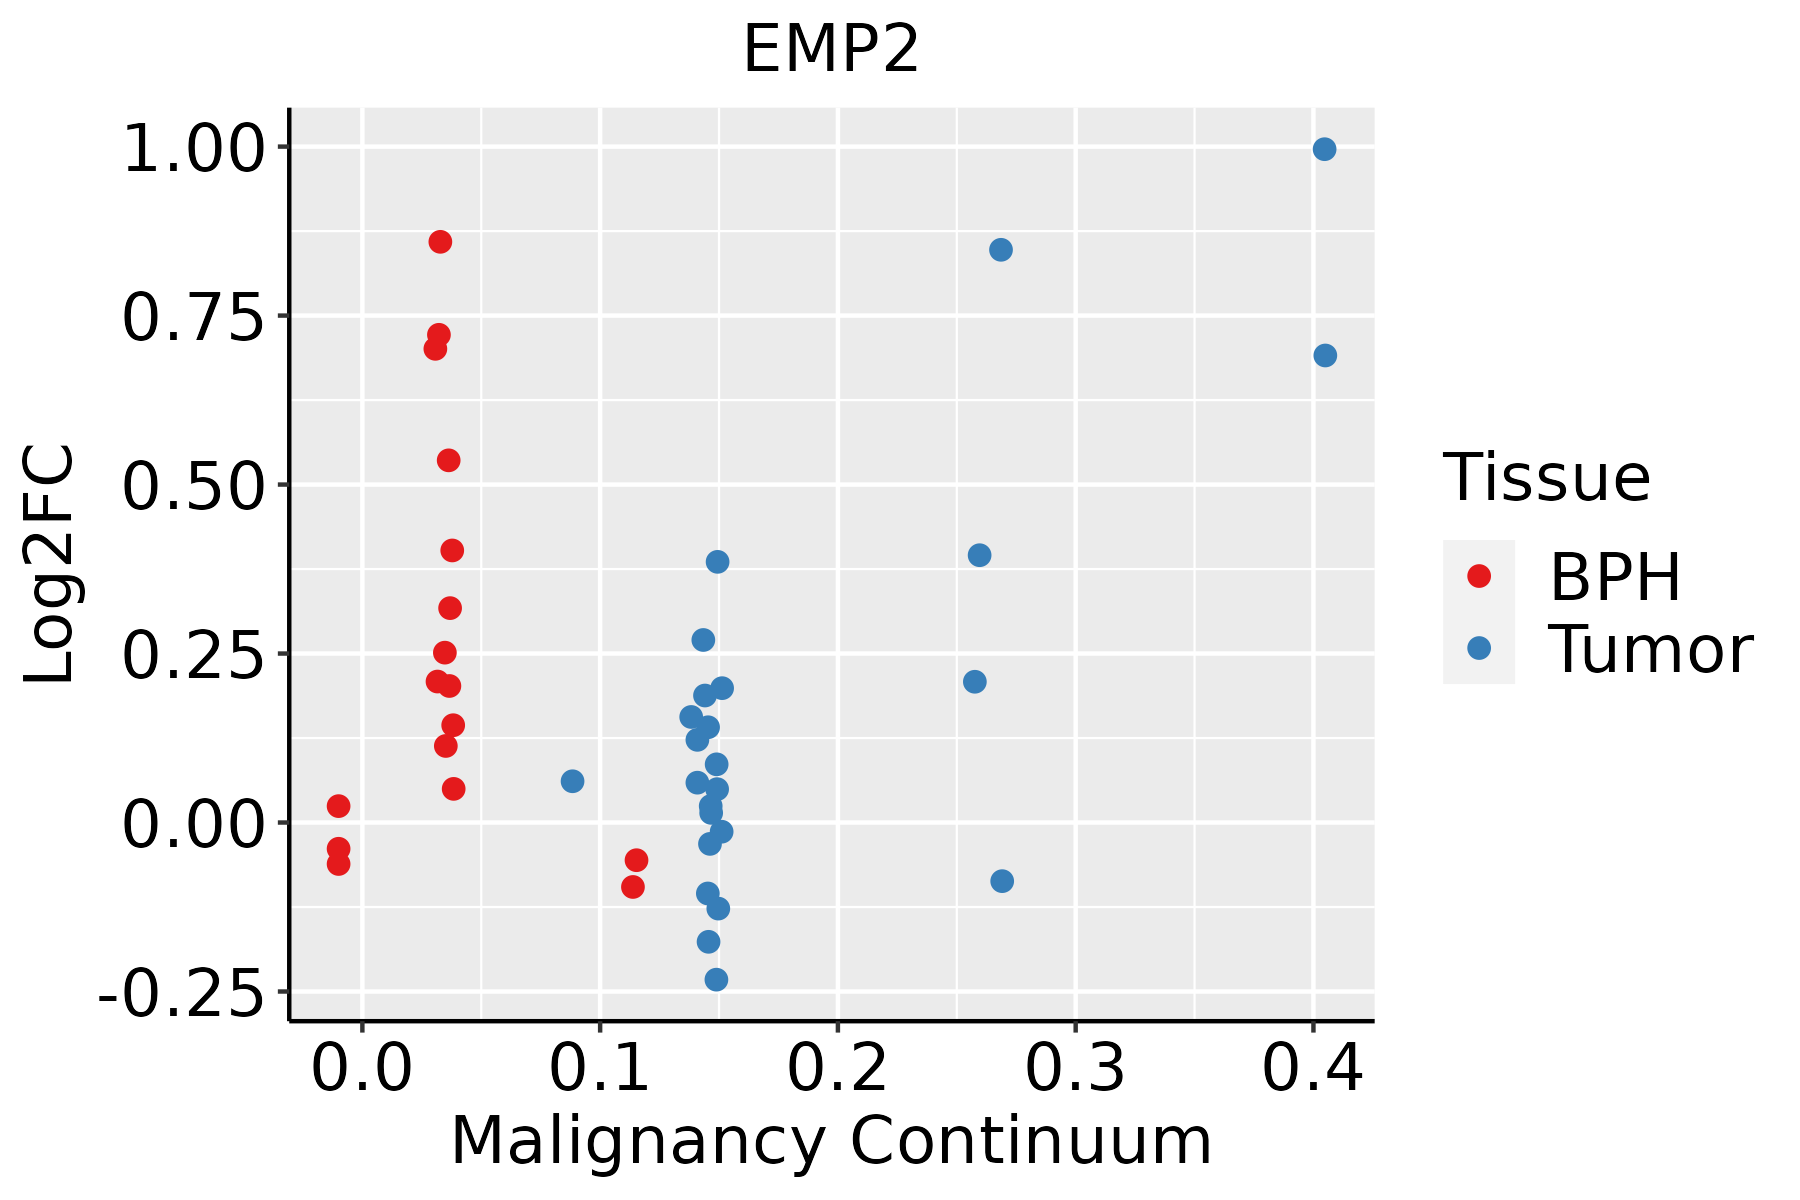 | BPH: Benign Prostatic Hyperplasia |
| Skin | 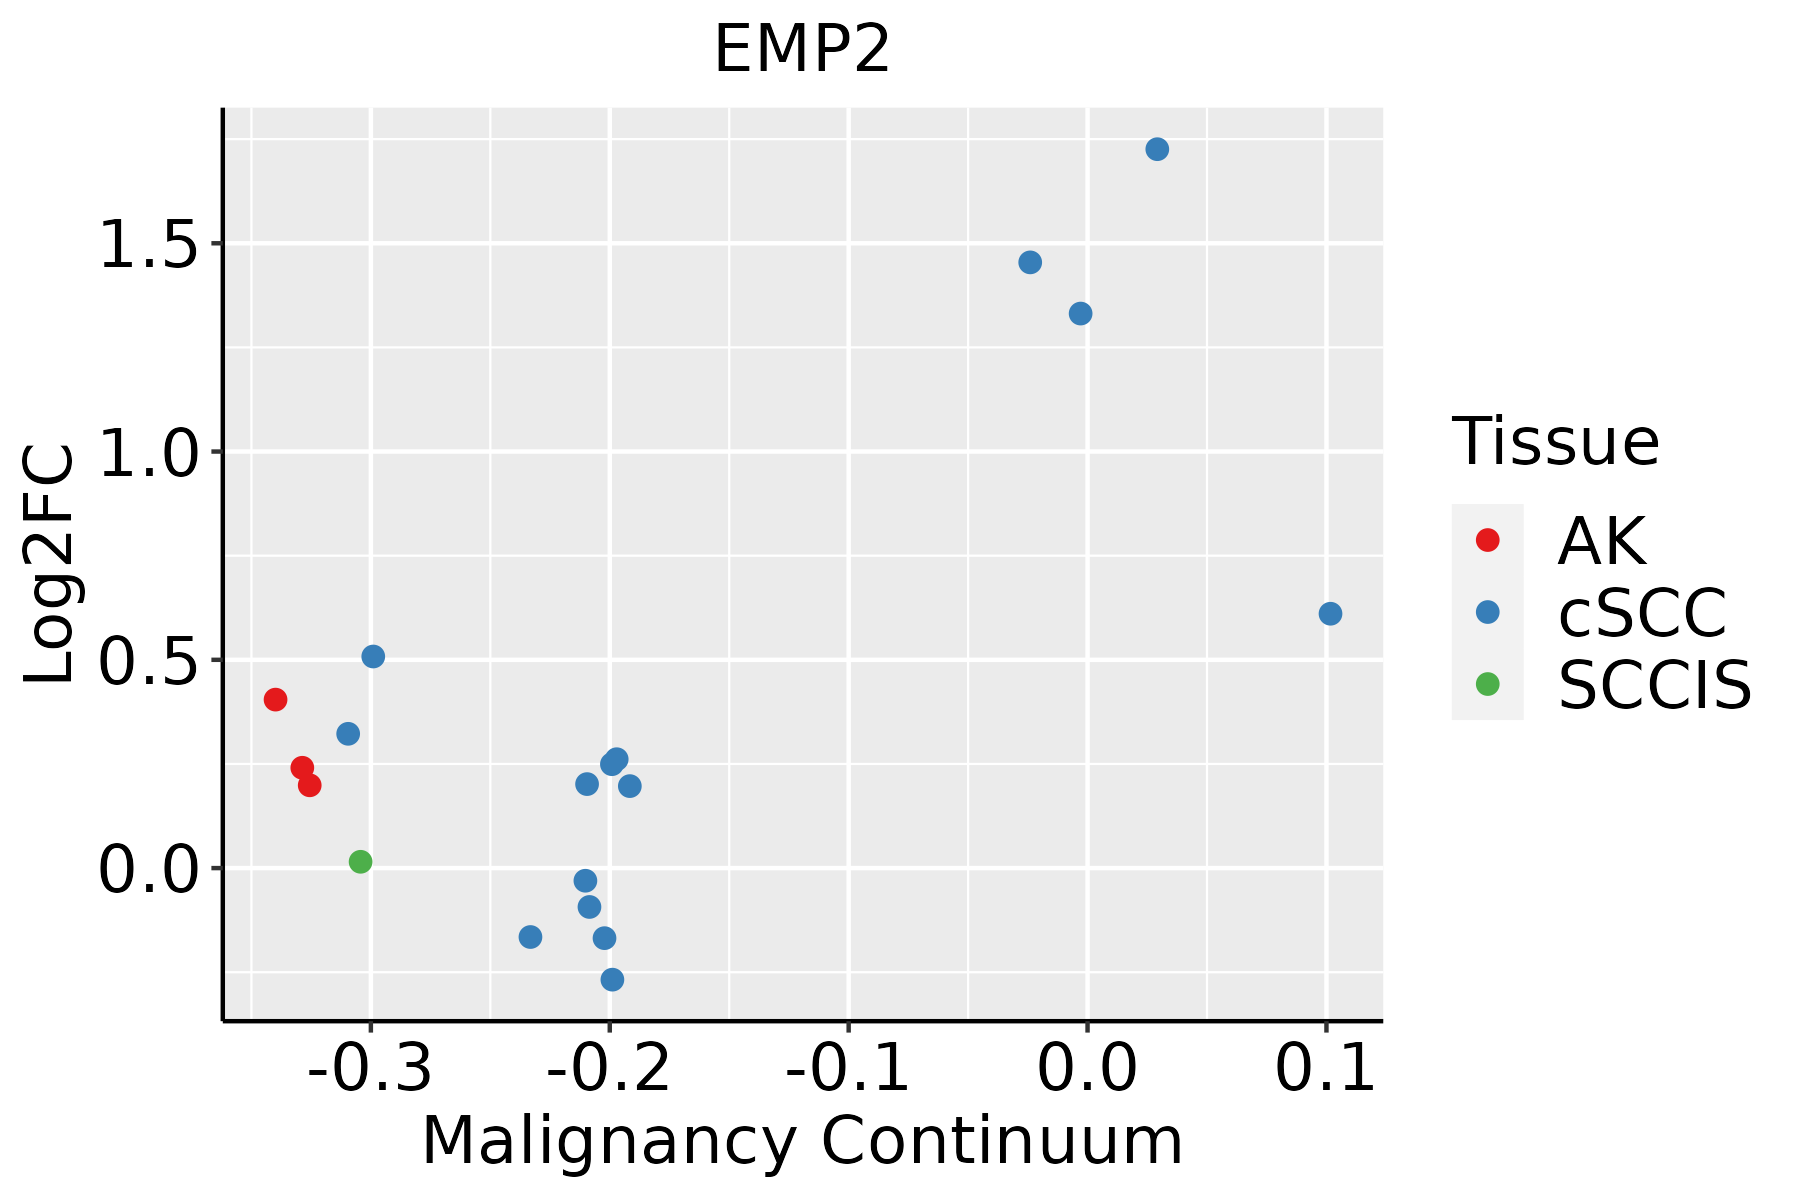 | AK: Actinic keratosis |
| cSCC: Cutaneous squamous cell carcinoma | ||
| SCCIS:squamous cell carcinoma in situ | ||
| Thyroid | 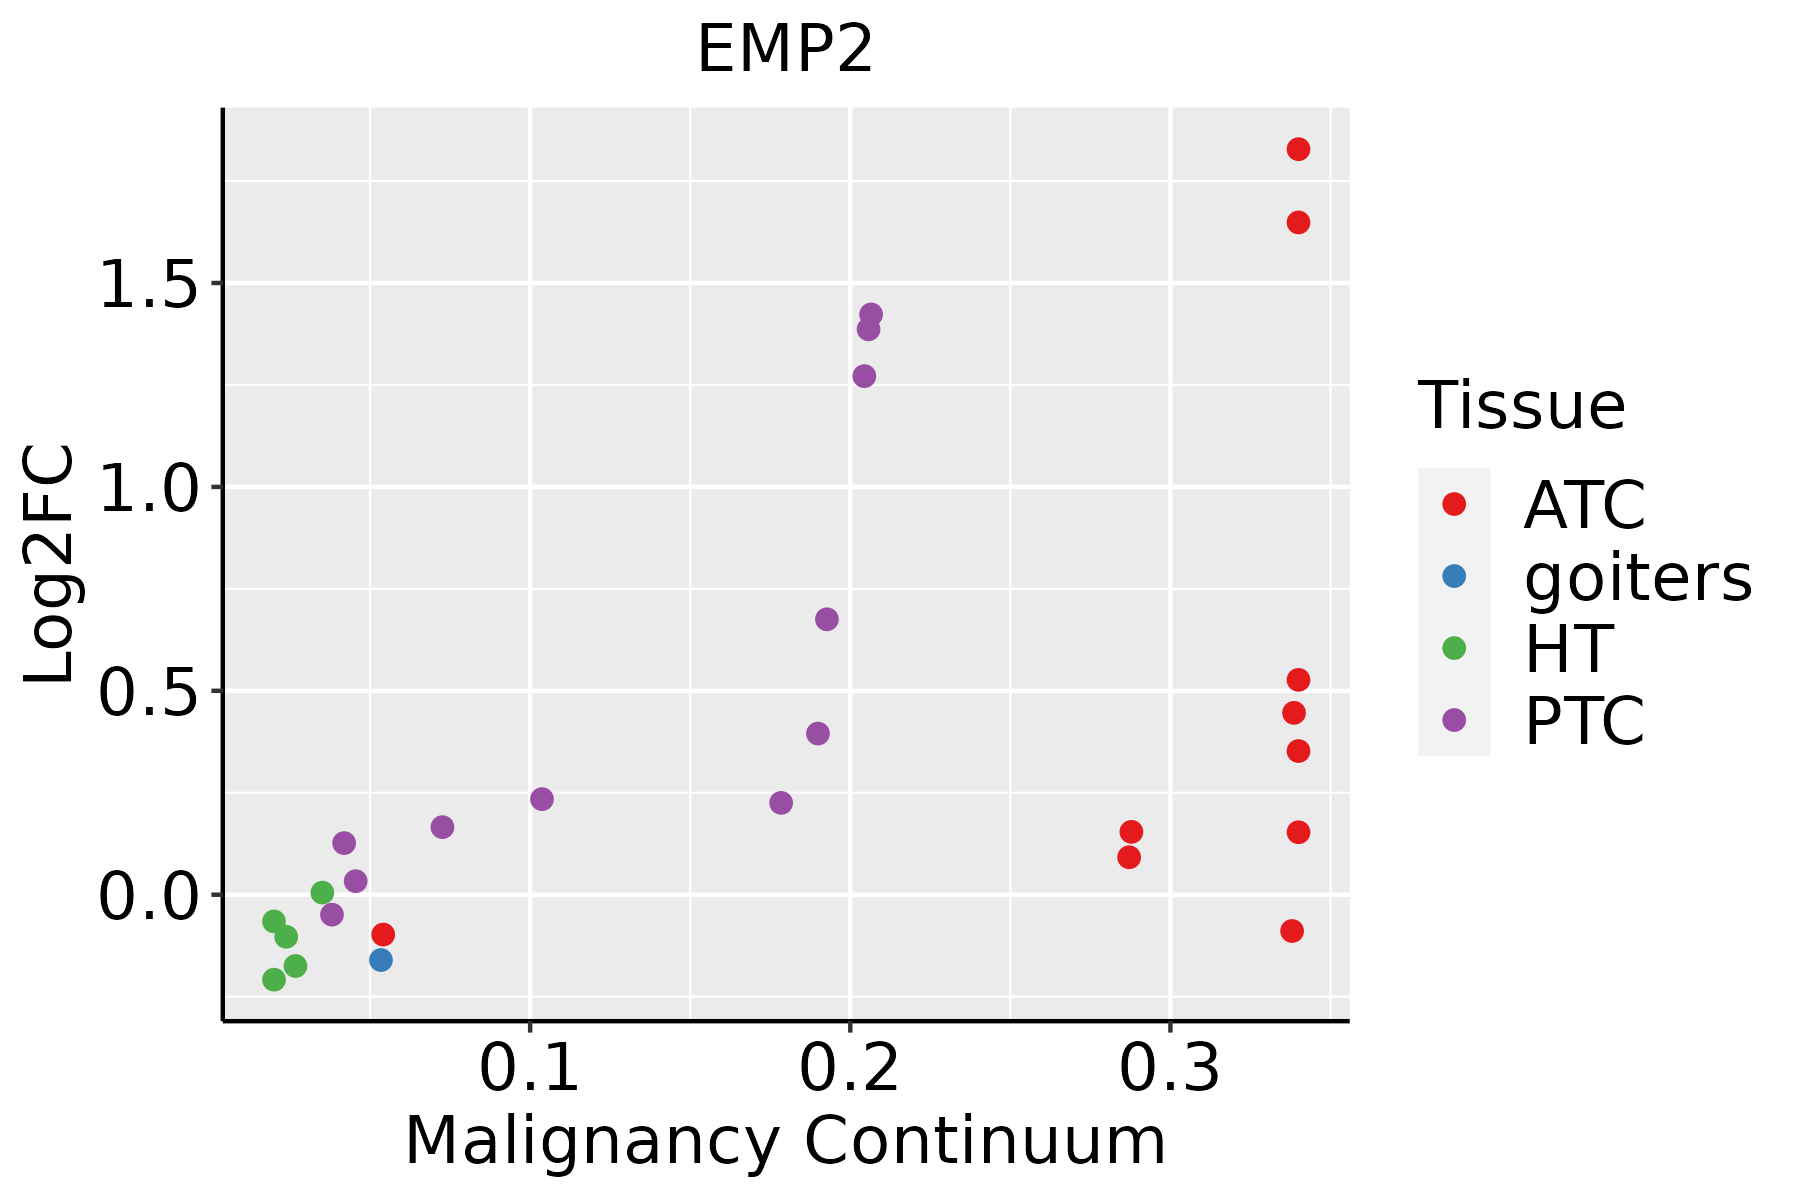 | ATC: Anaplastic thyroid cancer |
| HT: Hashimoto's thyroiditis | ||
| PTC: Papillary thyroid cancer |
| ∗log2FC in expression of this searched gene in stem-like cells from each diseased tissue sample relative to stem-like cells in normal samples in each tissue plotted against the malignancy continuum. Samples are colored based on if they are from different disease stage. |
Top |
Malignant transformation related pathway analysis |
| Find out the enriched GO biological processes and KEGG pathways involved in transition from healthy to precancer to cancer |
| Tissue | Disease Stage | Enriched GO biological Processes |
| Colorectum | AD |  |
| Colorectum | SER |  |
| Colorectum | MSS |  |
| Colorectum | MSI-H |  |
| Colorectum | FAP |  |
| ∗Top 15 enriched GO BP terms are showed in the bar plot of each disease state in each tissue. Each row represents a significant GO biological process which is colored according to the -log10(p.adjust). |
| Page: 1 2 3 4 5 6 7 8 9 |
| GO ID | Tissue | Disease Stage | Description | Gene Ratio | Bg Ratio | pvalue | p.adjust | Count |
| GO:00457859 | Breast | Precancer | positive regulation of cell adhesion | 52/1080 | 437/18723 | 5.74e-07 | 2.49e-05 | 52 |
| GO:00075653 | Breast | Precancer | female pregnancy | 29/1080 | 193/18723 | 2.07e-06 | 7.31e-05 | 29 |
| GO:00447063 | Breast | Precancer | multi-multicellular organism process | 31/1080 | 220/18723 | 3.73e-06 | 1.19e-04 | 31 |
| GO:00106319 | Breast | Precancer | epithelial cell migration | 40/1080 | 357/18723 | 4.57e-05 | 9.71e-04 | 40 |
| GO:00901329 | Breast | Precancer | epithelium migration | 40/1080 | 360/18723 | 5.51e-05 | 1.14e-03 | 40 |
| GO:00435426 | Breast | Precancer | endothelial cell migration | 33/1080 | 279/18723 | 7.28e-05 | 1.44e-03 | 33 |
| GO:00901309 | Breast | Precancer | tissue migration | 40/1080 | 365/18723 | 7.48e-05 | 1.47e-03 | 40 |
| GO:00508789 | Breast | Precancer | regulation of body fluid levels | 40/1080 | 379/18723 | 1.68e-04 | 2.77e-03 | 40 |
| GO:00106329 | Breast | Precancer | regulation of epithelial cell migration | 33/1080 | 292/18723 | 1.74e-04 | 2.86e-03 | 33 |
| GO:00075663 | Breast | Precancer | embryo implantation | 11/1080 | 53/18723 | 1.82e-04 | 2.95e-03 | 11 |
| GO:00016678 | Breast | Precancer | ameboidal-type cell migration | 47/1080 | 475/18723 | 2.19e-04 | 3.35e-03 | 47 |
| GO:00070159 | Breast | Precancer | actin filament organization | 44/1080 | 442/18723 | 3.02e-04 | 4.35e-03 | 44 |
| GO:00105943 | Breast | Precancer | regulation of endothelial cell migration | 27/1080 | 232/18723 | 4.12e-04 | 5.55e-03 | 27 |
| GO:0045765 | Breast | Precancer | regulation of angiogenesis | 35/1080 | 342/18723 | 7.35e-04 | 8.80e-03 | 35 |
| GO:1901342 | Breast | Precancer | regulation of vasculature development | 35/1080 | 348/18723 | 1.00e-03 | 1.12e-02 | 35 |
| GO:00019134 | Breast | Precancer | T cell mediated cytotoxicity | 9/1080 | 49/18723 | 1.74e-03 | 1.74e-02 | 9 |
| GO:00315794 | Breast | Precancer | membrane raft organization | 6/1080 | 25/18723 | 2.49e-03 | 2.28e-02 | 6 |
| GO:00336749 | Breast | Precancer | positive regulation of kinase activity | 42/1080 | 467/18723 | 2.94e-03 | 2.54e-02 | 42 |
| GO:00024563 | Breast | Precancer | T cell mediated immunity | 14/1080 | 109/18723 | 3.97e-03 | 3.15e-02 | 14 |
| GO:00108119 | Breast | Precancer | positive regulation of cell-substrate adhesion | 15/1080 | 123/18723 | 4.80e-03 | 3.64e-02 | 15 |
| Page: 1 2 3 4 5 6 7 8 9 10 11 12 13 14 15 16 17 18 19 20 21 22 23 24 25 26 27 28 29 30 31 32 33 34 35 36 37 38 39 40 41 42 43 |
| Pathway ID | Tissue | Disease Stage | Description | Gene Ratio | Bg Ratio | pvalue | p.adjust | qvalue | Count |
| hsa045109 | Breast | IDC | Focal adhesion | 32/867 | 203/8465 | 8.60e-03 | 4.23e-02 | 3.17e-02 | 32 |
| hsa0451013 | Breast | IDC | Focal adhesion | 32/867 | 203/8465 | 8.60e-03 | 4.23e-02 | 3.17e-02 | 32 |
| hsa0451010 | Cervix | CC | Focal adhesion | 59/1267 | 203/8465 | 1.53e-07 | 1.84e-06 | 1.09e-06 | 59 |
| hsa0451014 | Cervix | CC | Focal adhesion | 59/1267 | 203/8465 | 1.53e-07 | 1.84e-06 | 1.09e-06 | 59 |
| hsa0451023 | Cervix | HSIL_HPV | Focal adhesion | 21/459 | 203/8465 | 3.24e-03 | 2.02e-02 | 1.63e-02 | 21 |
| hsa0451033 | Cervix | HSIL_HPV | Focal adhesion | 21/459 | 203/8465 | 3.24e-03 | 2.02e-02 | 1.63e-02 | 21 |
| hsa04510 | Colorectum | AD | Focal adhesion | 67/2092 | 203/8465 | 4.40e-03 | 2.17e-02 | 1.38e-02 | 67 |
| hsa045101 | Colorectum | AD | Focal adhesion | 67/2092 | 203/8465 | 4.40e-03 | 2.17e-02 | 1.38e-02 | 67 |
| hsa045102 | Colorectum | FAP | Focal adhesion | 61/1404 | 203/8465 | 1.03e-06 | 2.15e-05 | 1.31e-05 | 61 |
| hsa045103 | Colorectum | FAP | Focal adhesion | 61/1404 | 203/8465 | 1.03e-06 | 2.15e-05 | 1.31e-05 | 61 |
| hsa045104 | Colorectum | CRC | Focal adhesion | 51/1091 | 203/8465 | 1.29e-06 | 5.41e-05 | 3.66e-05 | 51 |
| hsa045105 | Colorectum | CRC | Focal adhesion | 51/1091 | 203/8465 | 1.29e-06 | 5.41e-05 | 3.66e-05 | 51 |
| hsa0451020 | Esophagus | ESCC | Focal adhesion | 127/4205 | 203/8465 | 1.25e-04 | 4.99e-04 | 2.56e-04 | 127 |
| hsa04510111 | Esophagus | ESCC | Focal adhesion | 127/4205 | 203/8465 | 1.25e-04 | 4.99e-04 | 2.56e-04 | 127 |
| hsa045106 | Liver | NAFLD | Focal adhesion | 38/1043 | 203/8465 | 5.13e-03 | 4.43e-02 | 3.57e-02 | 38 |
| hsa0451011 | Liver | NAFLD | Focal adhesion | 38/1043 | 203/8465 | 5.13e-03 | 4.43e-02 | 3.57e-02 | 38 |
| hsa0451021 | Liver | Cirrhotic | Focal adhesion | 93/2530 | 203/8465 | 9.27e-07 | 1.10e-05 | 6.80e-06 | 93 |
| hsa0451031 | Liver | Cirrhotic | Focal adhesion | 93/2530 | 203/8465 | 9.27e-07 | 1.10e-05 | 6.80e-06 | 93 |
| hsa0451041 | Liver | HCC | Focal adhesion | 125/4020 | 203/8465 | 3.12e-05 | 1.88e-04 | 1.04e-04 | 125 |
| hsa0451051 | Liver | HCC | Focal adhesion | 125/4020 | 203/8465 | 3.12e-05 | 1.88e-04 | 1.04e-04 | 125 |
| Page: 1 2 |
Top |
Cell-cell communication analysis |
| Identification of potential cell-cell interactions between two cell types and their ligand-receptor pairs for different disease states |
| Ligand | Receptor | LRpair | Pathway | Tissue | Disease Stage |
| Page: 1 |
Top |
Single-cell gene regulatory network inference analysis |
| Find out the significant the regulons (TFs) and the target genes of each regulon across cell types for different disease states |
| TF | Cell Type | Tissue | Disease Stage | Target Gene | RSS | Regulon Activity |
| ∗The dot plots of a searched regulon are shown for all cell subpopulations in each disease state of each tissue based on the regulon specific score inferred using pySCENIC and by calculating the average expression. |
| Page: 1 |
Top |
Somatic mutation of malignant transformation related genes |
| Annotation of somatic variants for genes involved in malignant transformation |
| Hugo Symbol | Variant Class | Variant Classification | dbSNP RS | HGVSc | HGVSp | HGVSp Short | SWISSPROT | BIOTYPE | SIFT | PolyPhen | Tumor Sample Barcode | Tissue | Histology | Sex | Age | Stage | Therapy Types | Drugs | Outcome |
| EMP2 | insertion | In_Frame_Ins | novel | c.444_445insCTTGTAATCCCA | p.Val148_Ala149insLeuValIlePro | p.V148_A149insLVIP | P54851 | protein_coding | TCGA-A2-A0CM-01 | Breast | breast invasive carcinoma | Female | <65 | I/II | Chemotherapy | adriamycin | PD | ||
| EMP2 | insertion | Frame_Shift_Ins | novel | c.204_205insGCAGCCGCGC | p.Ile69AlafsTer56 | p.I69Afs*56 | P54851 | protein_coding | TCGA-B6-A0IA-01 | Breast | breast invasive carcinoma | Female | <65 | I/II | Unknown | Unknown | SD | ||
| EMP2 | insertion | Frame_Shift_Ins | novel | c.202_203insGGAGGAGGGAGAATTTGGAAAGGAGAAAT | p.Met68ArgfsTer11 | p.M68Rfs*11 | P54851 | protein_coding | TCGA-B6-A0IA-01 | Breast | breast invasive carcinoma | Female | <65 | I/II | Unknown | Unknown | SD | ||
| EMP2 | SNV | Missense_Mutation | rs587777482 | c.28G>A | p.Ala10Thr | p.A10T | P54851 | protein_coding | tolerated(0.08) | benign(0.146) | TCGA-2W-A8YY-01 | Cervix | cervical & endocervical cancer | Female | <65 | I/II | Chemotherapy | cisplatin | CR |
| EMP2 | SNV | Missense_Mutation | rs370673124 | c.359N>A | p.Arg120His | p.R120H | P54851 | protein_coding | tolerated(0.34) | benign(0.027) | TCGA-AA-3713-01 | Colorectum | colon adenocarcinoma | Male | >=65 | III/IV | Chemotherapy | 5-fluorouracil | PR |
| EMP2 | SNV | Missense_Mutation | c.176N>A | p.Ser59Tyr | p.S59Y | P54851 | protein_coding | deleterious(0.04) | possibly_damaging(0.837) | TCGA-AA-3713-01 | Colorectum | colon adenocarcinoma | Male | >=65 | III/IV | Chemotherapy | 5-fluorouracil | PR | |
| EMP2 | SNV | Missense_Mutation | rs587777482 | c.28G>A | p.Ala10Thr | p.A10T | P54851 | protein_coding | tolerated(0.08) | benign(0.146) | TCGA-AD-6895-01 | Colorectum | colon adenocarcinoma | Male | >=65 | III/IV | Unknown | Unknown | SD |
| EMP2 | SNV | Missense_Mutation | rs587777482 | c.28G>A | p.Ala10Thr | p.A10T | P54851 | protein_coding | tolerated(0.08) | benign(0.146) | TCGA-AP-A051-01 | Endometrium | uterine corpus endometrioid carcinoma | Female | >=65 | I/II | Unknown | Unknown | SD |
| EMP2 | SNV | Missense_Mutation | c.418N>A | p.Gly140Ser | p.G140S | P54851 | protein_coding | deleterious(0) | probably_damaging(0.99) | TCGA-AX-A0J1-01 | Endometrium | uterine corpus endometrioid carcinoma | Female | >=65 | I/II | Unknown | Unknown | SD | |
| EMP2 | SNV | Missense_Mutation | rs562241873 | c.232N>A | p.Ala78Thr | p.A78T | P54851 | protein_coding | deleterious(0.01) | possibly_damaging(0.456) | TCGA-AX-A0J1-01 | Endometrium | uterine corpus endometrioid carcinoma | Female | >=65 | I/II | Unknown | Unknown | SD |
| Page: 1 2 3 |
Top |
Related drugs of malignant transformation related genes |
| Identification of chemicals and drugs interact with genes involved in malignant transfromation |
| (DGIdb 4.0) |
| Entrez ID | Symbol | Category | Interaction Types | Drug Claim Name | Drug Name | PMIDs |
| 2013 | EMP2 | CELL SURFACE | HORMONES | 18400107 |
| Page: 1 |

Copyright 2023-Present -The University of Texas Health Science Center at Houston |