
|
|||||
|
 | |
| |
| |
| |
| |
| |
|
Gene: EFHD2 |
Gene summary for EFHD2 |
| Gene information | Species | Human | Gene symbol | EFHD2 | Gene ID | 79180 |
| Gene name | EF-hand domain family member D2 | |
| Gene Alias | SWS1 | |
| Cytomap | 1p36.21 | |
| Gene Type | protein-coding | GO ID | GO:0005575 | UniProtAcc | A0A024QZ77 |
Top |
Malignant transformation analysis |
| Identification of the aberrant gene expression in precancerous and cancerous lesions by comparing the gene expression of stem-like cells in diseased tissues with normal stem cells |
| Entrez ID | Symbol | Replicates | Species | Organ | Tissue | Adj P-value | Log2FC | Malignancy |
| 79180 | EFHD2 | Pat09-B | Human | Stomach | GC | 8.93e-05 | 1.06e-01 | -0.0359 |
| 79180 | EFHD2 | Pat10-B | Human | Stomach | GC | 5.32e-10 | 6.73e-01 | 0.084 |
| 79180 | EFHD2 | Pat11-B | Human | Stomach | GC | 7.11e-16 | 3.68e-01 | -0.182 |
| 79180 | EFHD2 | Pat12-B | Human | Stomach | GC | 1.38e-09 | 2.00e-01 | 0.0325 |
| 79180 | EFHD2 | Pat13-B | Human | Stomach | GC | 1.07e-09 | 3.17e-01 | 0.0555 |
| 79180 | EFHD2 | Pat15-B | Human | Stomach | GC | 1.35e-21 | 4.51e-01 | -0.0778 |
| 79180 | EFHD2 | Pat16-B | Human | Stomach | GC | 8.17e-08 | 1.57e-01 | 0.1918 |
| 79180 | EFHD2 | Pat18-B | Human | Stomach | GC | 1.42e-18 | 4.76e-01 | -0.0432 |
| 79180 | EFHD2 | Pat19-B | Human | Stomach | GC | 1.22e-21 | 5.56e-01 | 0.0826 |
| 79180 | EFHD2 | Pat22-B | Human | Stomach | GC | 1.11e-41 | 5.49e-01 | -0.1042 |
| 79180 | EFHD2 | Pat24-B | Human | Stomach | GC | 5.68e-19 | 6.08e-01 | -0.1184 |
| 79180 | EFHD2 | Pat25-A | Human | Stomach | CAG with IM | 6.05e-24 | 4.08e-02 | -0.1648 |
| 79180 | EFHD2 | Pat26-A | Human | Stomach | CSG | 2.26e-14 | -4.47e-02 | -0.2402 |
| 79180 | EFHD2 | Pat28-A | Human | Stomach | CSG | 1.08e-08 | 2.88e-02 | -0.2594 |
| 79180 | EFHD2 | Pat29-A | Human | Stomach | CAG with IM | 6.51e-13 | 5.10e-01 | -0.2769 |
| 79180 | EFHD2 | NAG_2 | Human | Stomach | CSG | 1.15e-05 | 4.66e-01 | -0.3324 |
| 79180 | EFHD2 | SIM_2 | Human | Stomach | SIM | 7.25e-03 | 2.12e-01 | 0.3139 |
| 79180 | EFHD2 | male-WTA | Human | Thyroid | PTC | 4.15e-60 | 7.80e-01 | 0.1037 |
| 79180 | EFHD2 | female-WTA | Human | Thyroid | PTC | 6.33e-11 | 7.01e-01 | 0.0726 |
| 79180 | EFHD2 | PTC01 | Human | Thyroid | PTC | 1.60e-25 | 8.57e-01 | 0.1899 |
| Page: 1 2 3 4 5 6 7 8 9 |
| Tissue | Expression Dynamics | Abbreviation |
| Colorectum (GSE201348) |  | FAP: Familial adenomatous polyposis |
| CRC: Colorectal cancer | ||
| Colorectum (HTA11) |  | AD: Adenomas |
| SER: Sessile serrated lesions | ||
| MSI-H: Microsatellite-high colorectal cancer | ||
| MSS: Microsatellite stable colorectal cancer | ||
| Esophagus |  | ESCC: Esophageal squamous cell carcinoma |
| HGIN: High-grade intraepithelial neoplasias | ||
| LGIN: Low-grade intraepithelial neoplasias | ||
| GC | 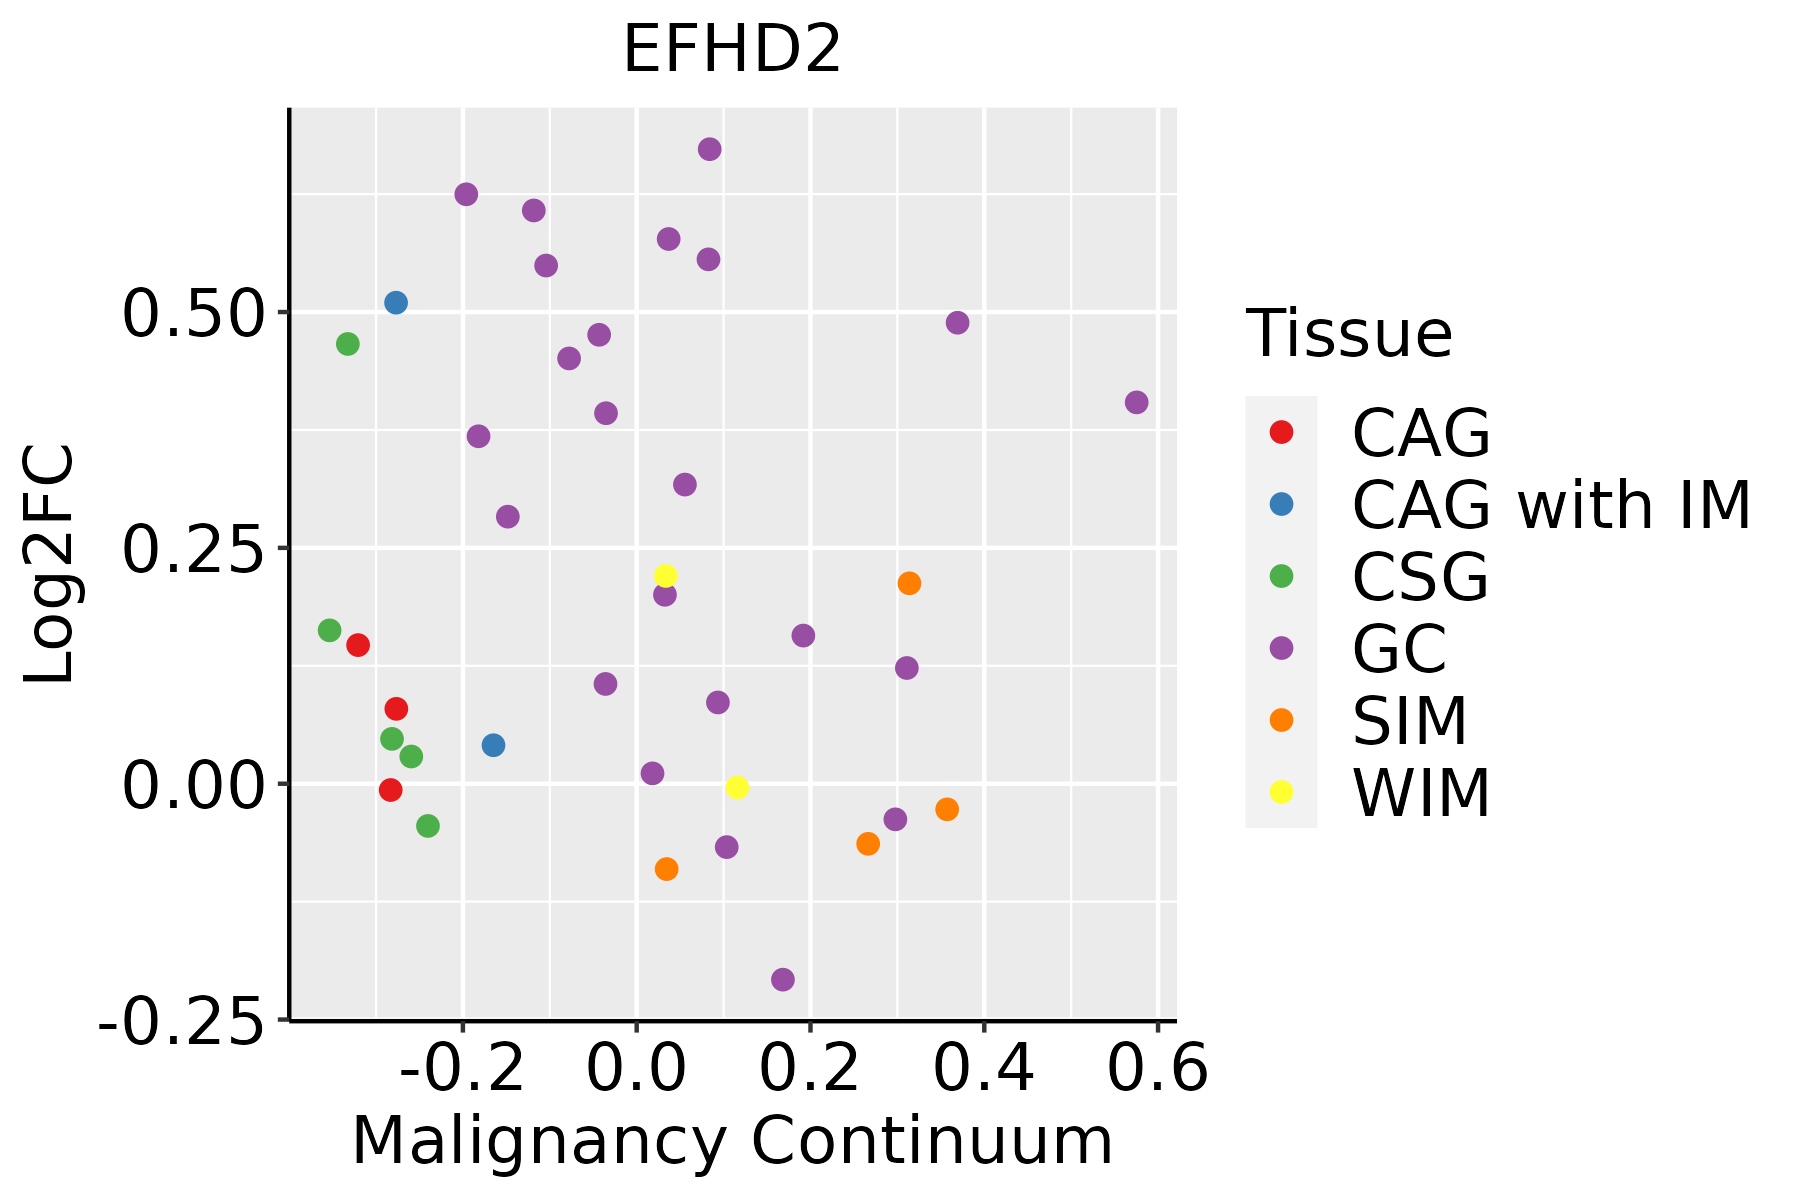 | CAG: Chronic atrophic gastritis |
| CAG with IM: Chronic atrophic gastritis with intestinal metaplasia | ||
| CSG: Chronic superficial gastritis | ||
| GC: Gastric cancer | ||
| SIM: Severe intestinal metaplasia | ||
| WIM: Wild intestinal metaplasia | ||
| Liver | 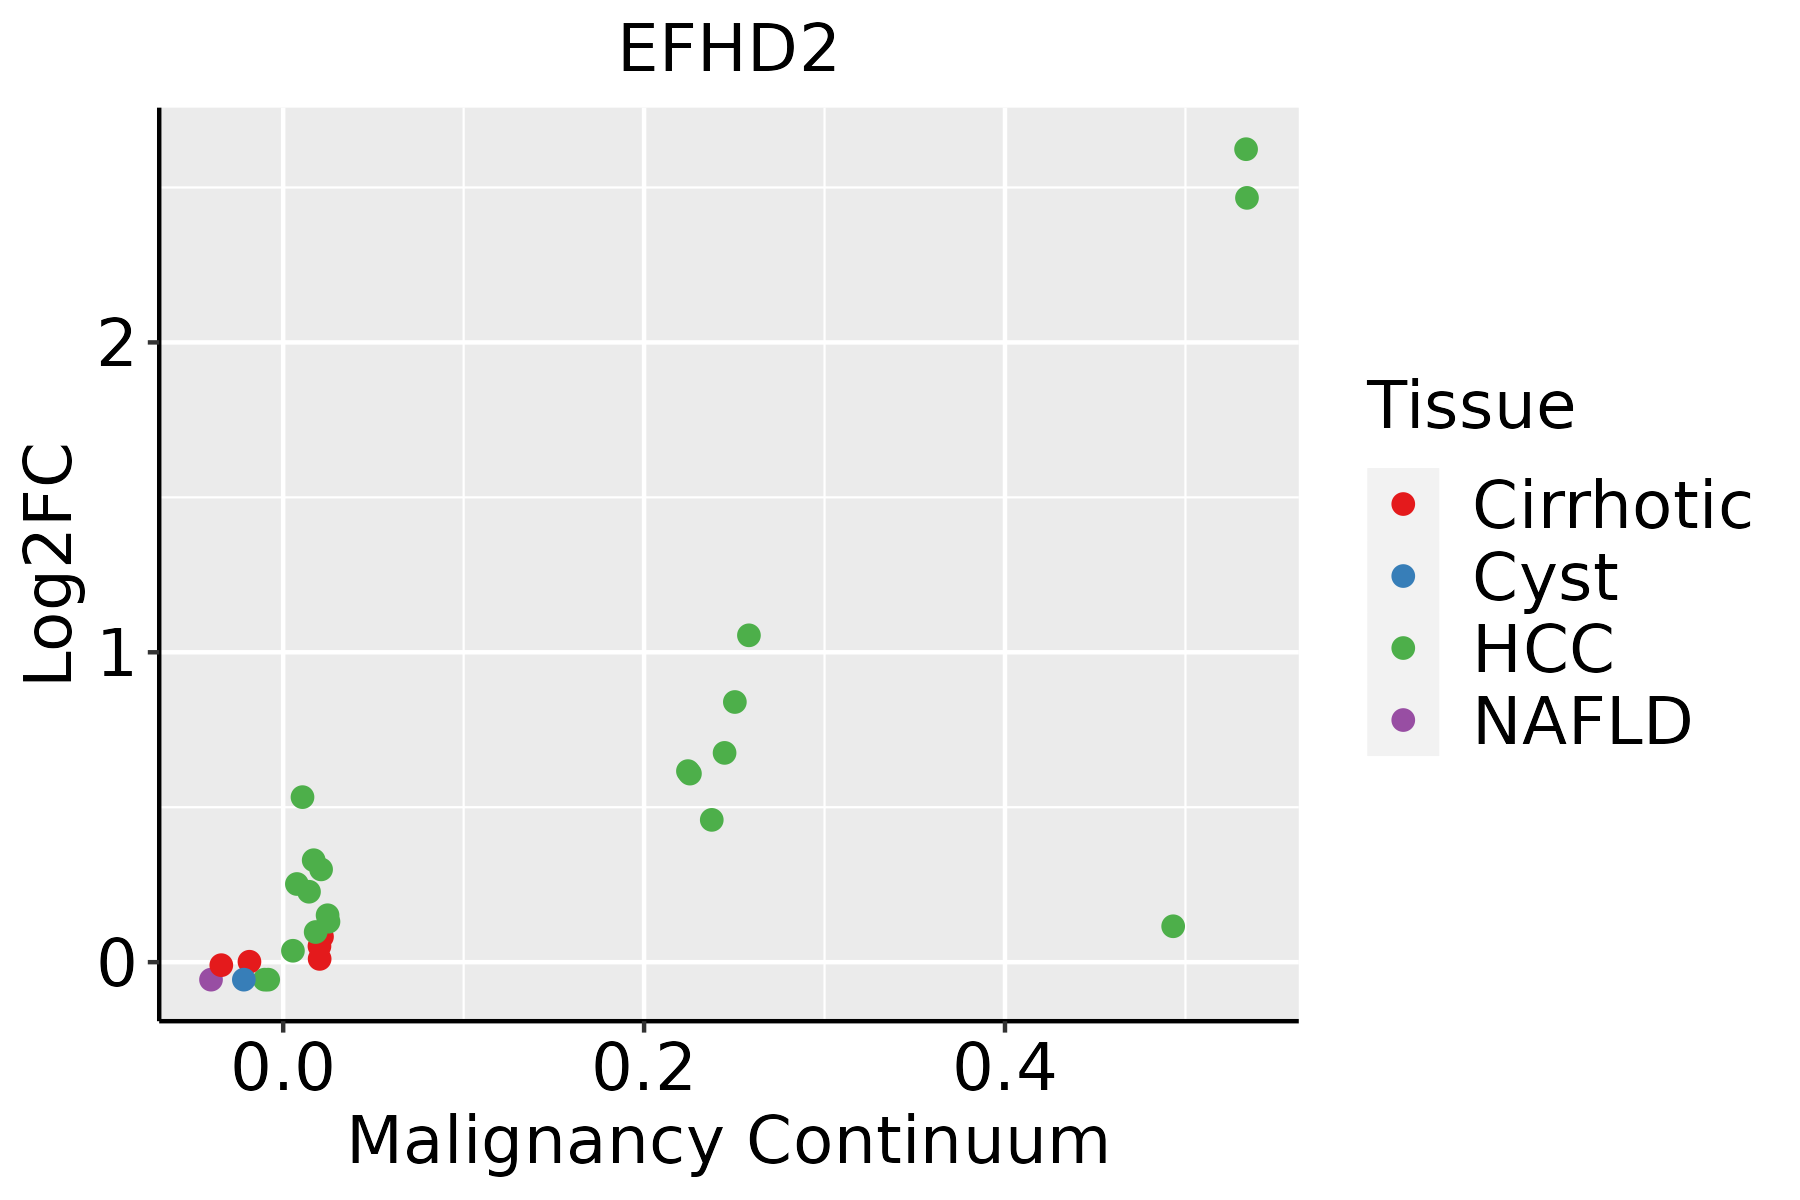 | HCC: Hepatocellular carcinoma |
| NAFLD: Non-alcoholic fatty liver disease | ||
| Oral Cavity | 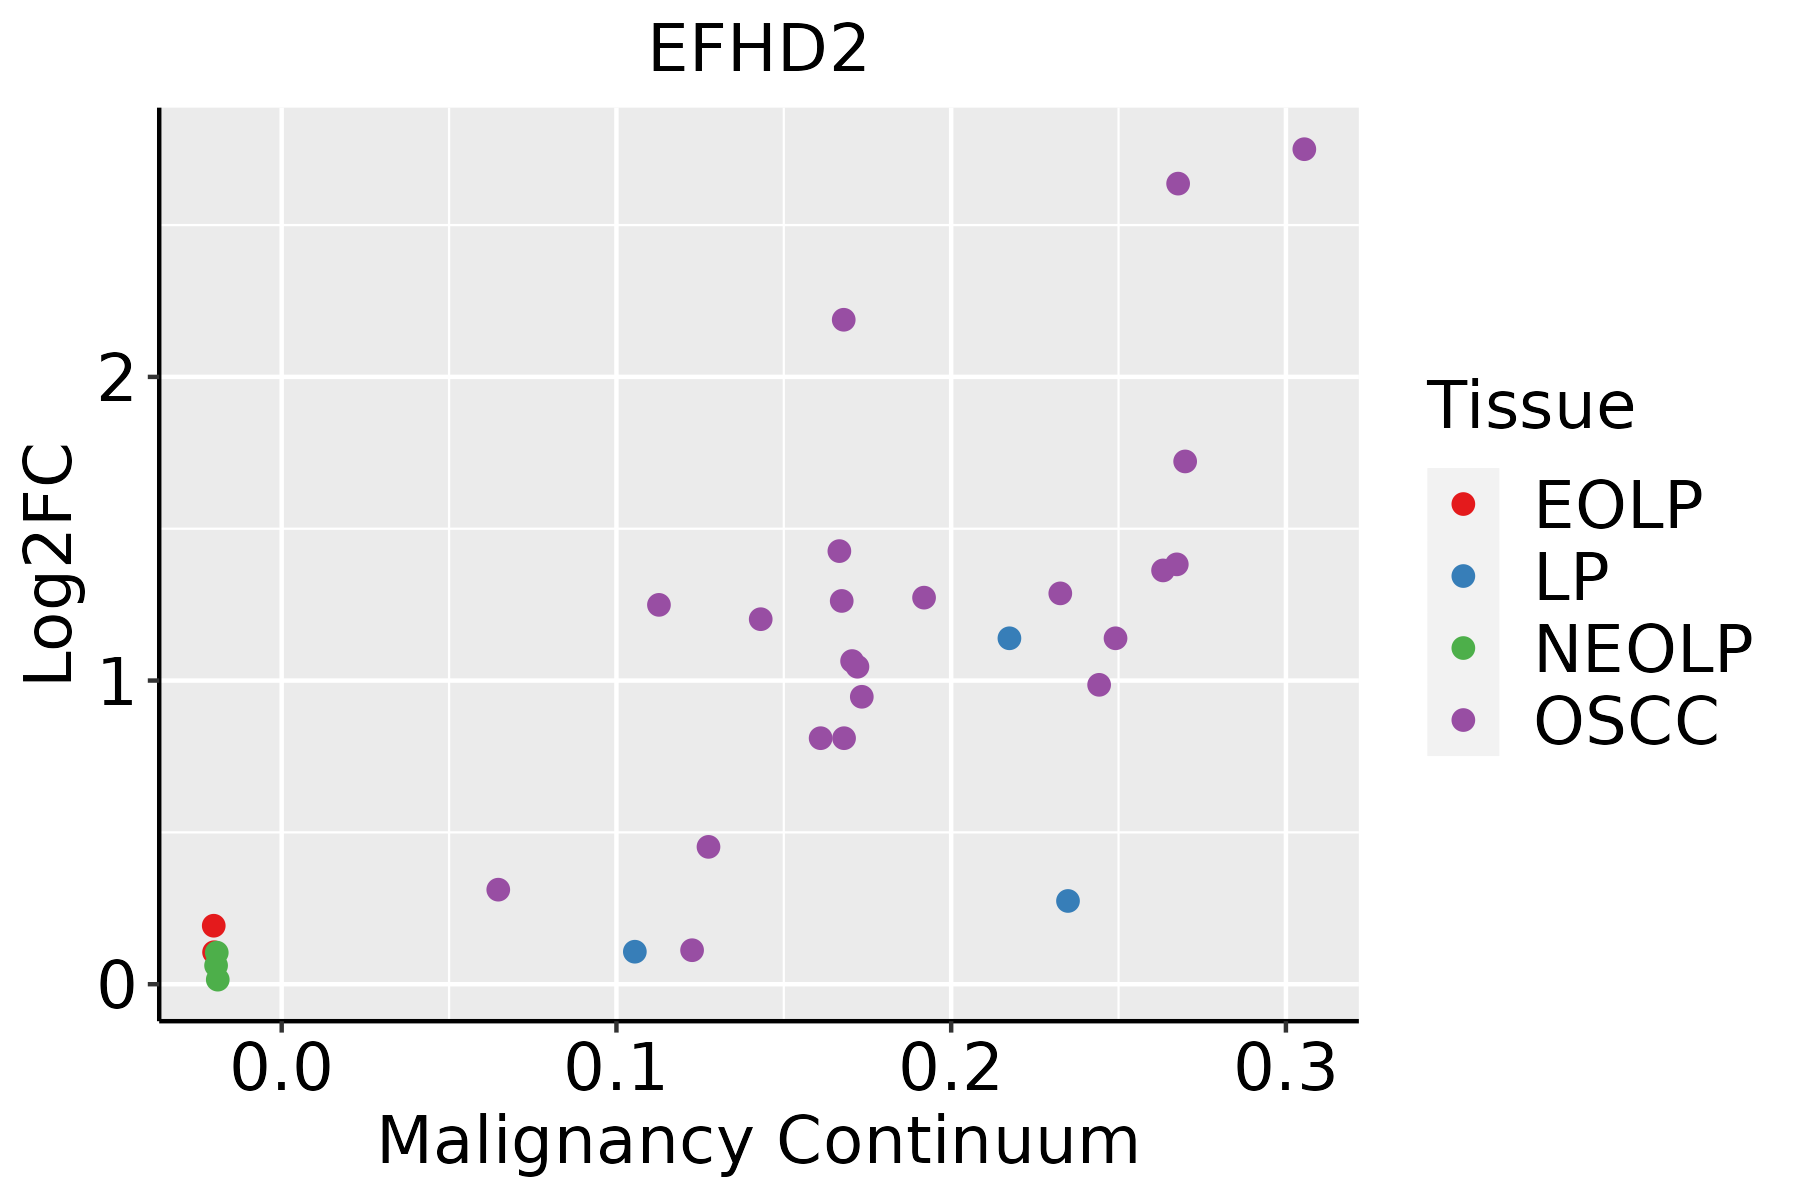 | EOLP: Erosive Oral lichen planus |
| LP: leukoplakia | ||
| NEOLP: Non-erosive oral lichen planus | ||
| OSCC: Oral squamous cell carcinoma | ||
| Skin | 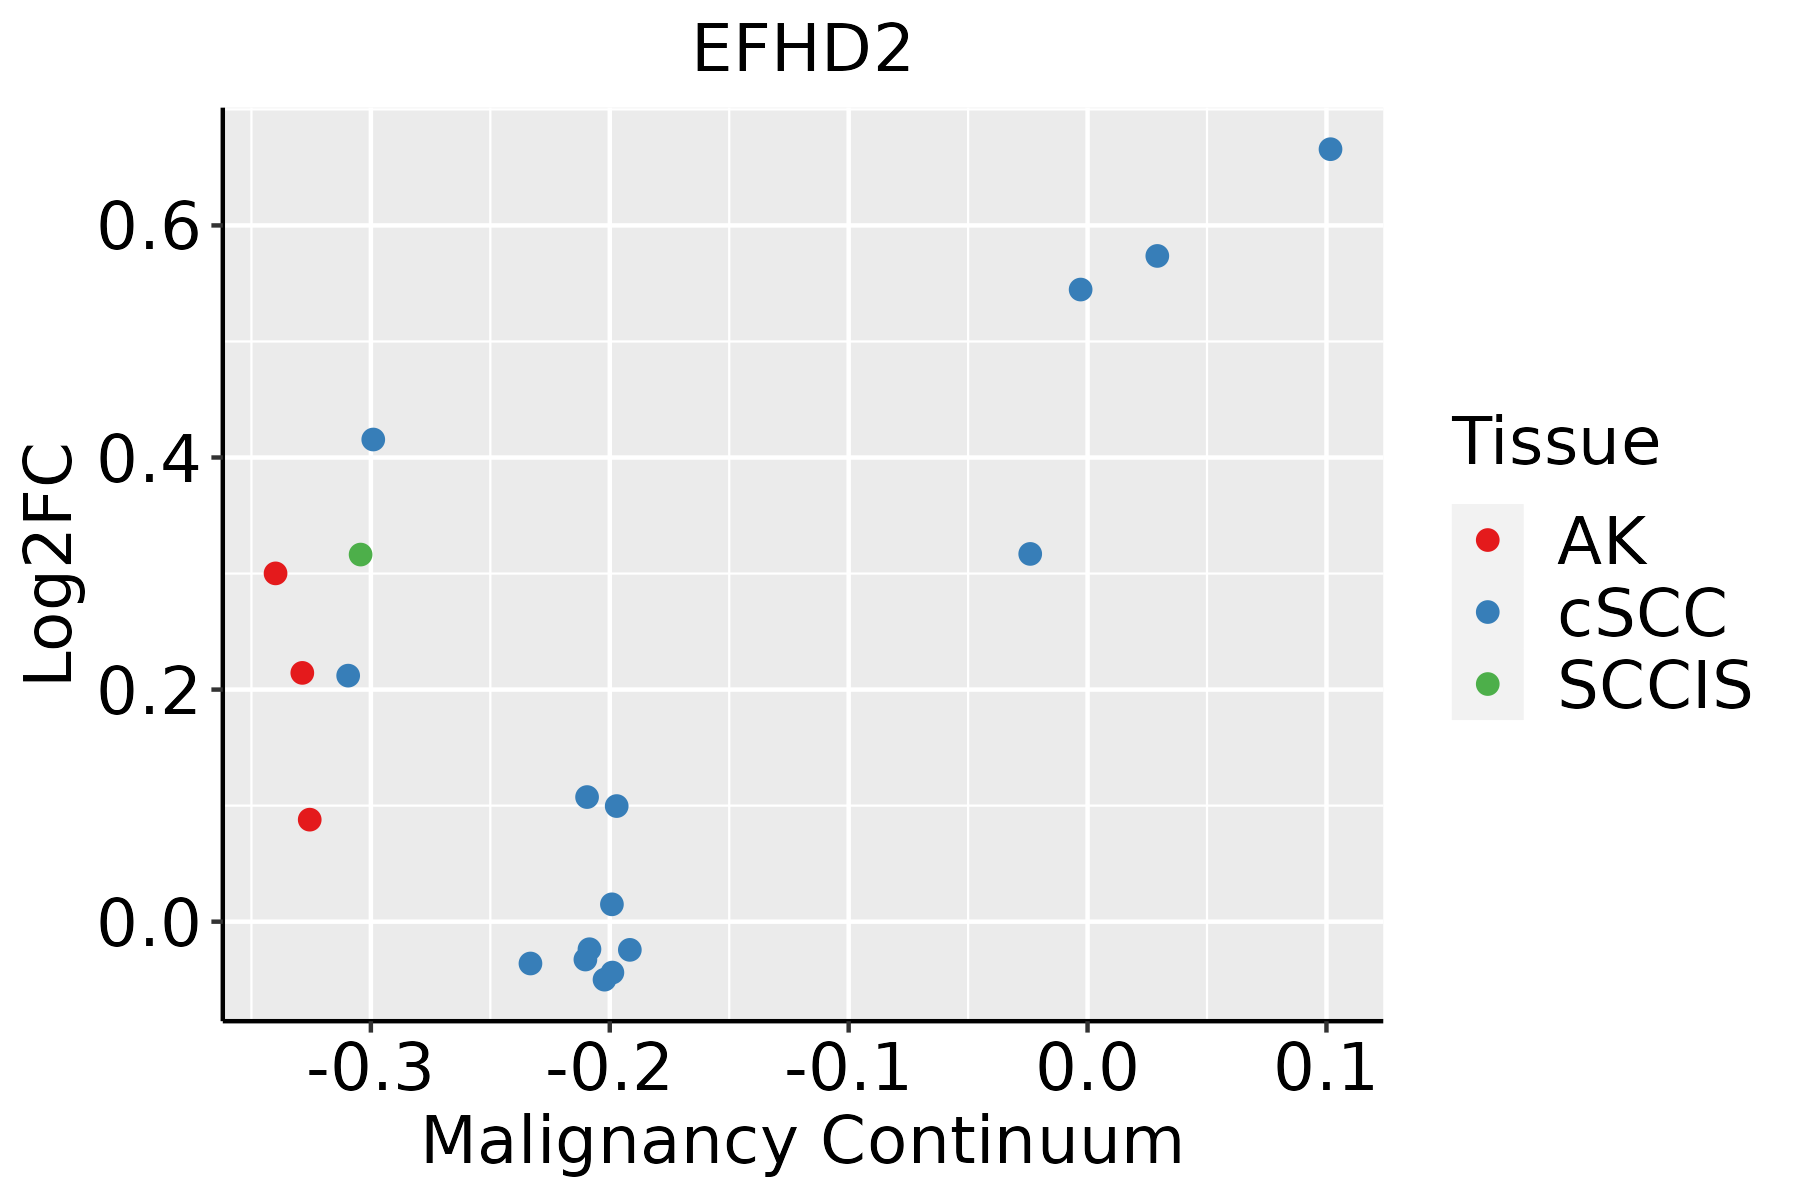 | AK: Actinic keratosis |
| cSCC: Cutaneous squamous cell carcinoma | ||
| SCCIS:squamous cell carcinoma in situ | ||
| Thyroid |  | ATC: Anaplastic thyroid cancer |
| HT: Hashimoto's thyroiditis | ||
| PTC: Papillary thyroid cancer |
| ∗log2FC in expression of this searched gene in stem-like cells from each diseased tissue sample relative to stem-like cells in normal samples in each tissue plotted against the malignancy continuum. Samples are colored based on if they are from different disease stage. |
Top |
Malignant transformation related pathway analysis |
| Find out the enriched GO biological processes and KEGG pathways involved in transition from healthy to precancer to cancer |
| Tissue | Disease Stage | Enriched GO biological Processes |
| Colorectum | AD |  |
| Colorectum | SER |  |
| Colorectum | MSS |  |
| Colorectum | MSI-H |  |
| Colorectum | FAP |  |
| ∗Top 15 enriched GO BP terms are showed in the bar plot of each disease state in each tissue. Each row represents a significant GO biological process which is colored according to the -log10(p.adjust). |
| Page: 1 2 3 4 5 6 7 8 9 |
| GO ID | Tissue | Disease Stage | Description | Gene Ratio | Bg Ratio | pvalue | p.adjust | Count |
| Page: 1 |
| Pathway ID | Tissue | Disease Stage | Description | Gene Ratio | Bg Ratio | pvalue | p.adjust | qvalue | Count |
| Page: 1 |
Top |
Cell-cell communication analysis |
| Identification of potential cell-cell interactions between two cell types and their ligand-receptor pairs for different disease states |
| Ligand | Receptor | LRpair | Pathway | Tissue | Disease Stage |
| Page: 1 |
Top |
Single-cell gene regulatory network inference analysis |
| Find out the significant the regulons (TFs) and the target genes of each regulon across cell types for different disease states |
| TF | Cell Type | Tissue | Disease Stage | Target Gene | RSS | Regulon Activity |
| ∗The dot plots of a searched regulon are shown for all cell subpopulations in each disease state of each tissue based on the regulon specific score inferred using pySCENIC and by calculating the average expression. |
| Page: 1 |
Top |
Somatic mutation of malignant transformation related genes |
| Annotation of somatic variants for genes involved in malignant transformation |
| Hugo Symbol | Variant Class | Variant Classification | dbSNP RS | HGVSc | HGVSp | HGVSp Short | SWISSPROT | BIOTYPE | SIFT | PolyPhen | Tumor Sample Barcode | Tissue | Histology | Sex | Age | Stage | Therapy Types | Drugs | Outcome |
| EFHD2 | SNV | Missense_Mutation | c.235N>A | p.Val79Ile | p.V79I | Q96C19 | protein_coding | tolerated(0.08) | benign(0.013) | TCGA-AZ-6598-01 | Colorectum | colon adenocarcinoma | Female | >=65 | I/II | Unknown | Unknown | SD | |
| EFHD2 | SNV | Missense_Mutation | c.267N>A | p.Phe89Leu | p.F89L | Q96C19 | protein_coding | deleterious(0.04) | benign(0.384) | TCGA-BS-A0UF-01 | Endometrium | uterine corpus endometrioid carcinoma | Female | >=65 | I/II | Unknown | Unknown | SD | |
| EFHD2 | SNV | Missense_Mutation | c.475A>G | p.Lys159Glu | p.K159E | Q96C19 | protein_coding | deleterious(0.01) | possibly_damaging(0.844) | TCGA-CC-A7IF-01 | Liver | liver hepatocellular carcinoma | Male | <65 | III/IV | Unknown | Unknown | PD | |
| EFHD2 | SNV | Missense_Mutation | c.279N>T | p.Gln93His | p.Q93H | Q96C19 | protein_coding | deleterious(0.04) | benign(0.125) | TCGA-86-7955-01 | Lung | lung adenocarcinoma | Male | <65 | I/II | Chemotherapy | etoposide | PD | |
| EFHD2 | SNV | Missense_Mutation | novel | c.488N>T | p.Gly163Val | p.G163V | Q96C19 | protein_coding | deleterious(0) | probably_damaging(1) | TCGA-56-7222-01 | Lung | lung squamous cell carcinoma | Male | <65 | I/II | Chemotherapy | cisplatin | PD |
| EFHD2 | SNV | Missense_Mutation | novel | c.310N>G | p.Tyr104Asp | p.Y104D | Q96C19 | protein_coding | deleterious(0) | probably_damaging(0.974) | TCGA-CN-5367-01 | Oral cavity | head & neck squamous cell carcinoma | Female | <65 | I/II | Chemotherapy | cisplatin | SD |
| EFHD2 | SNV | Missense_Mutation | novel | c.263A>G | p.Glu88Gly | p.E88G | Q96C19 | protein_coding | deleterious(0.01) | possibly_damaging(0.714) | TCGA-XK-AAIW-01 | Prostate | prostate adenocarcinoma | Male | >=65 | 9 | Unknown | Unknown | PD |
| EFHD2 | SNV | Missense_Mutation | rs562670393 | c.607G>A | p.Val203Met | p.V203M | Q96C19 | protein_coding | tolerated(0.11) | benign(0.276) | TCGA-BR-A4QL-01 | Stomach | stomach adenocarcinoma | Female | >=65 | III/IV | Chemotherapy | xeloda | CR |
| EFHD2 | SNV | Missense_Mutation | novel | c.337N>A | p.Asp113Asn | p.D113N | Q96C19 | protein_coding | deleterious(0.03) | possibly_damaging(0.844) | TCGA-VQ-A8P2-01 | Stomach | stomach adenocarcinoma | Male | >=65 | III/IV | Unspecific | Complete Response | |
| EFHD2 | insertion | Frame_Shift_Ins | novel | c.441_442insGAGA | p.Leu148GlufsTer33 | p.L148Efs*33 | Q96C19 | protein_coding | TCGA-FY-A4B0-01 | Thyroid | thyroid carcinoma | Male | >=65 | I/II | Hormone Therapy | synthroid | SD |
| Page: 1 |
Top |
Related drugs of malignant transformation related genes |
| Identification of chemicals and drugs interact with genes involved in malignant transfromation |
| (DGIdb 4.0) |
| Entrez ID | Symbol | Category | Interaction Types | Drug Claim Name | Drug Name | PMIDs |
| Page: 1 |

Copyright 2023-Present -The University of Texas Health Science Center at Houston |