
|
|||||
|
 | |
| |
| |
| |
| |
| |
|
Gene: DDX6 |
Gene summary for DDX6 |
| Gene information | Species | Human | Gene symbol | DDX6 | Gene ID | 1656 |
| Gene name | DEAD-box helicase 6 | |
| Gene Alias | HLR2 | |
| Cytomap | 11q23.3 | |
| Gene Type | protein-coding | GO ID | GO:0000003 | UniProtAcc | B2R858 |
Top |
Malignant transformation analysis |
| Identification of the aberrant gene expression in precancerous and cancerous lesions by comparing the gene expression of stem-like cells in diseased tissues with normal stem cells |
| Entrez ID | Symbol | Replicates | Species | Organ | Tissue | Adj P-value | Log2FC | Malignancy |
| 1656 | DDX6 | P4_S8_cSCC | Human | Skin | cSCC | 2.87e-08 | 2.18e-01 | -0.3095 |
| 1656 | DDX6 | P1_cSCC | Human | Skin | cSCC | 4.07e-08 | 3.42e-01 | 0.0292 |
| 1656 | DDX6 | P2_cSCC | Human | Skin | cSCC | 6.73e-03 | 2.41e-01 | -0.024 |
| 1656 | DDX6 | P4_cSCC | Human | Skin | cSCC | 4.53e-05 | 2.99e-01 | -0.00290000000000005 |
| 1656 | DDX6 | P10_cSCC | Human | Skin | cSCC | 4.18e-14 | 4.74e-01 | 0.1017 |
| 1656 | DDX6 | male-WTA | Human | Thyroid | PTC | 9.19e-56 | 4.33e-01 | 0.1037 |
| 1656 | DDX6 | PTC01 | Human | Thyroid | PTC | 1.58e-13 | 3.75e-01 | 0.1899 |
| 1656 | DDX6 | PTC03 | Human | Thyroid | PTC | 5.99e-10 | 3.82e-01 | 0.1784 |
| 1656 | DDX6 | PTC04 | Human | Thyroid | PTC | 6.64e-31 | 7.05e-01 | 0.1927 |
| 1656 | DDX6 | PTC05 | Human | Thyroid | PTC | 6.53e-23 | 1.05e+00 | 0.2065 |
| 1656 | DDX6 | PTC06 | Human | Thyroid | PTC | 1.34e-45 | 1.26e+00 | 0.2057 |
| 1656 | DDX6 | PTC07 | Human | Thyroid | PTC | 1.42e-50 | 8.82e-01 | 0.2044 |
| 1656 | DDX6 | ATC09 | Human | Thyroid | ATC | 9.71e-09 | 3.30e-01 | 0.2871 |
| 1656 | DDX6 | ATC11 | Human | Thyroid | ATC | 1.00e-03 | 3.63e-01 | 0.3386 |
| 1656 | DDX6 | ATC12 | Human | Thyroid | ATC | 2.12e-13 | 2.35e-01 | 0.34 |
| 1656 | DDX6 | ATC13 | Human | Thyroid | ATC | 1.40e-32 | 6.33e-01 | 0.34 |
| 1656 | DDX6 | ATC1 | Human | Thyroid | ATC | 2.76e-07 | 3.67e-01 | 0.2878 |
| 1656 | DDX6 | ATC2 | Human | Thyroid | ATC | 2.53e-10 | 1.31e+00 | 0.34 |
| 1656 | DDX6 | ATC3 | Human | Thyroid | ATC | 7.22e-05 | 3.20e-01 | 0.338 |
| 1656 | DDX6 | ATC4 | Human | Thyroid | ATC | 1.26e-16 | 3.41e-01 | 0.34 |
| Page: 1 2 3 4 5 6 7 8 9 |
| Tissue | Expression Dynamics | Abbreviation |
| Esophagus |  | ESCC: Esophageal squamous cell carcinoma |
| HGIN: High-grade intraepithelial neoplasias | ||
| LGIN: Low-grade intraepithelial neoplasias | ||
| Liver | 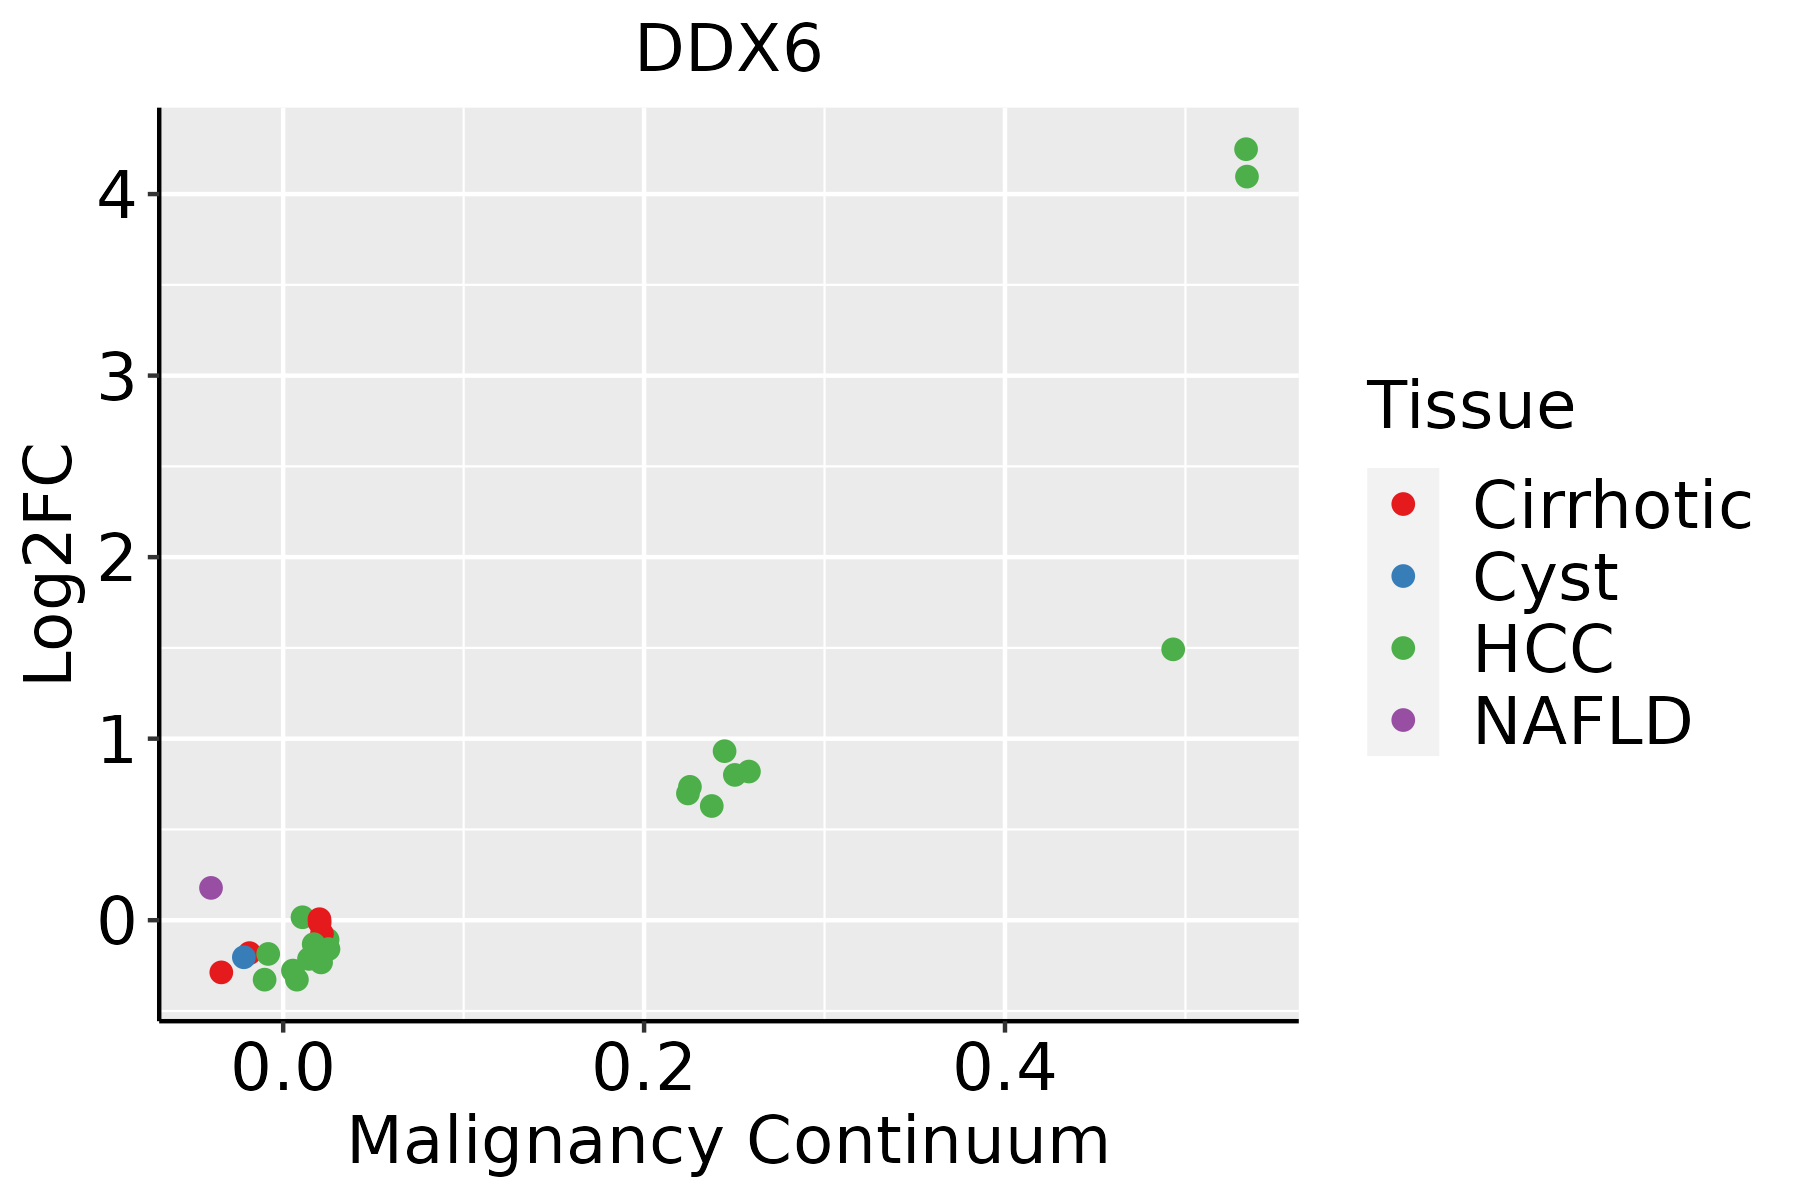 | HCC: Hepatocellular carcinoma |
| NAFLD: Non-alcoholic fatty liver disease | ||
| Lung | 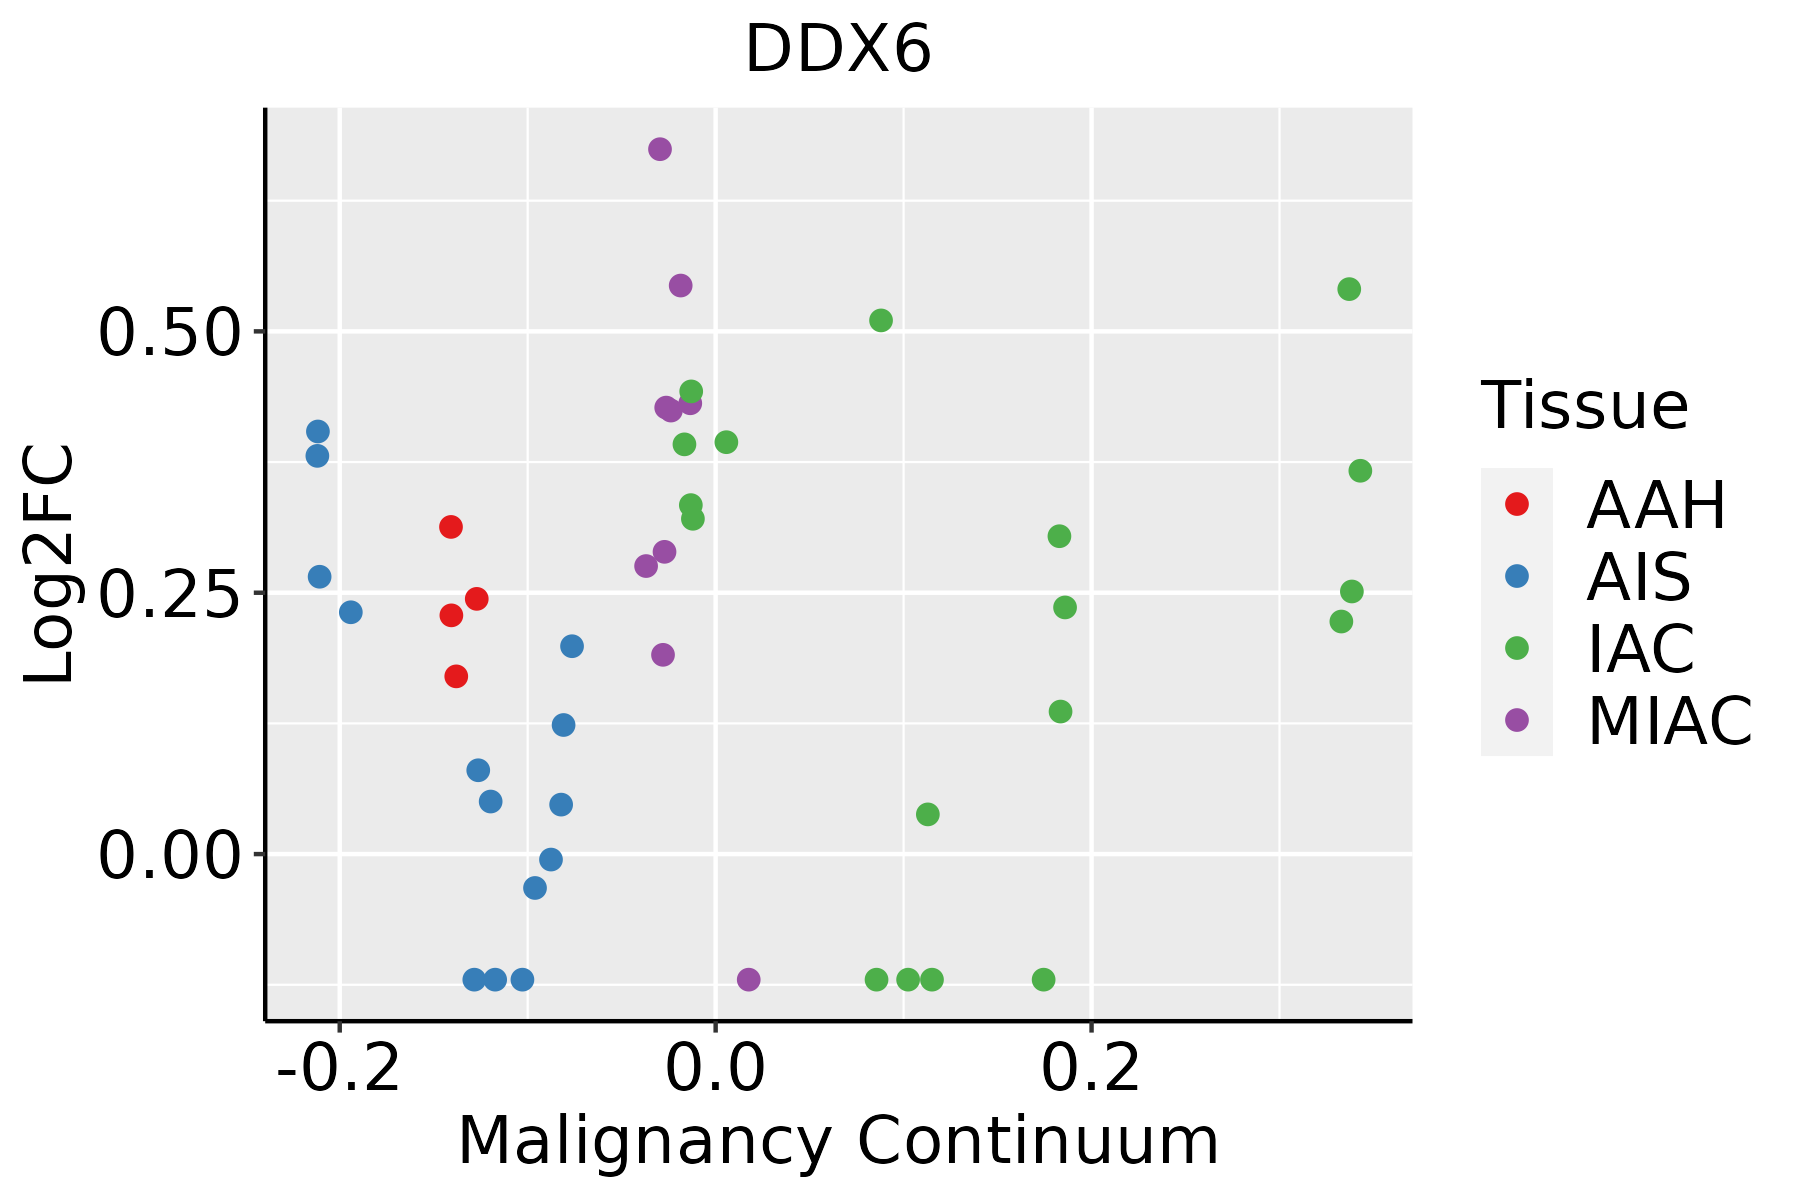 | AAH: Atypical adenomatous hyperplasia |
| AIS: Adenocarcinoma in situ | ||
| IAC: Invasive lung adenocarcinoma | ||
| MIA: Minimally invasive adenocarcinoma | ||
| Oral Cavity | 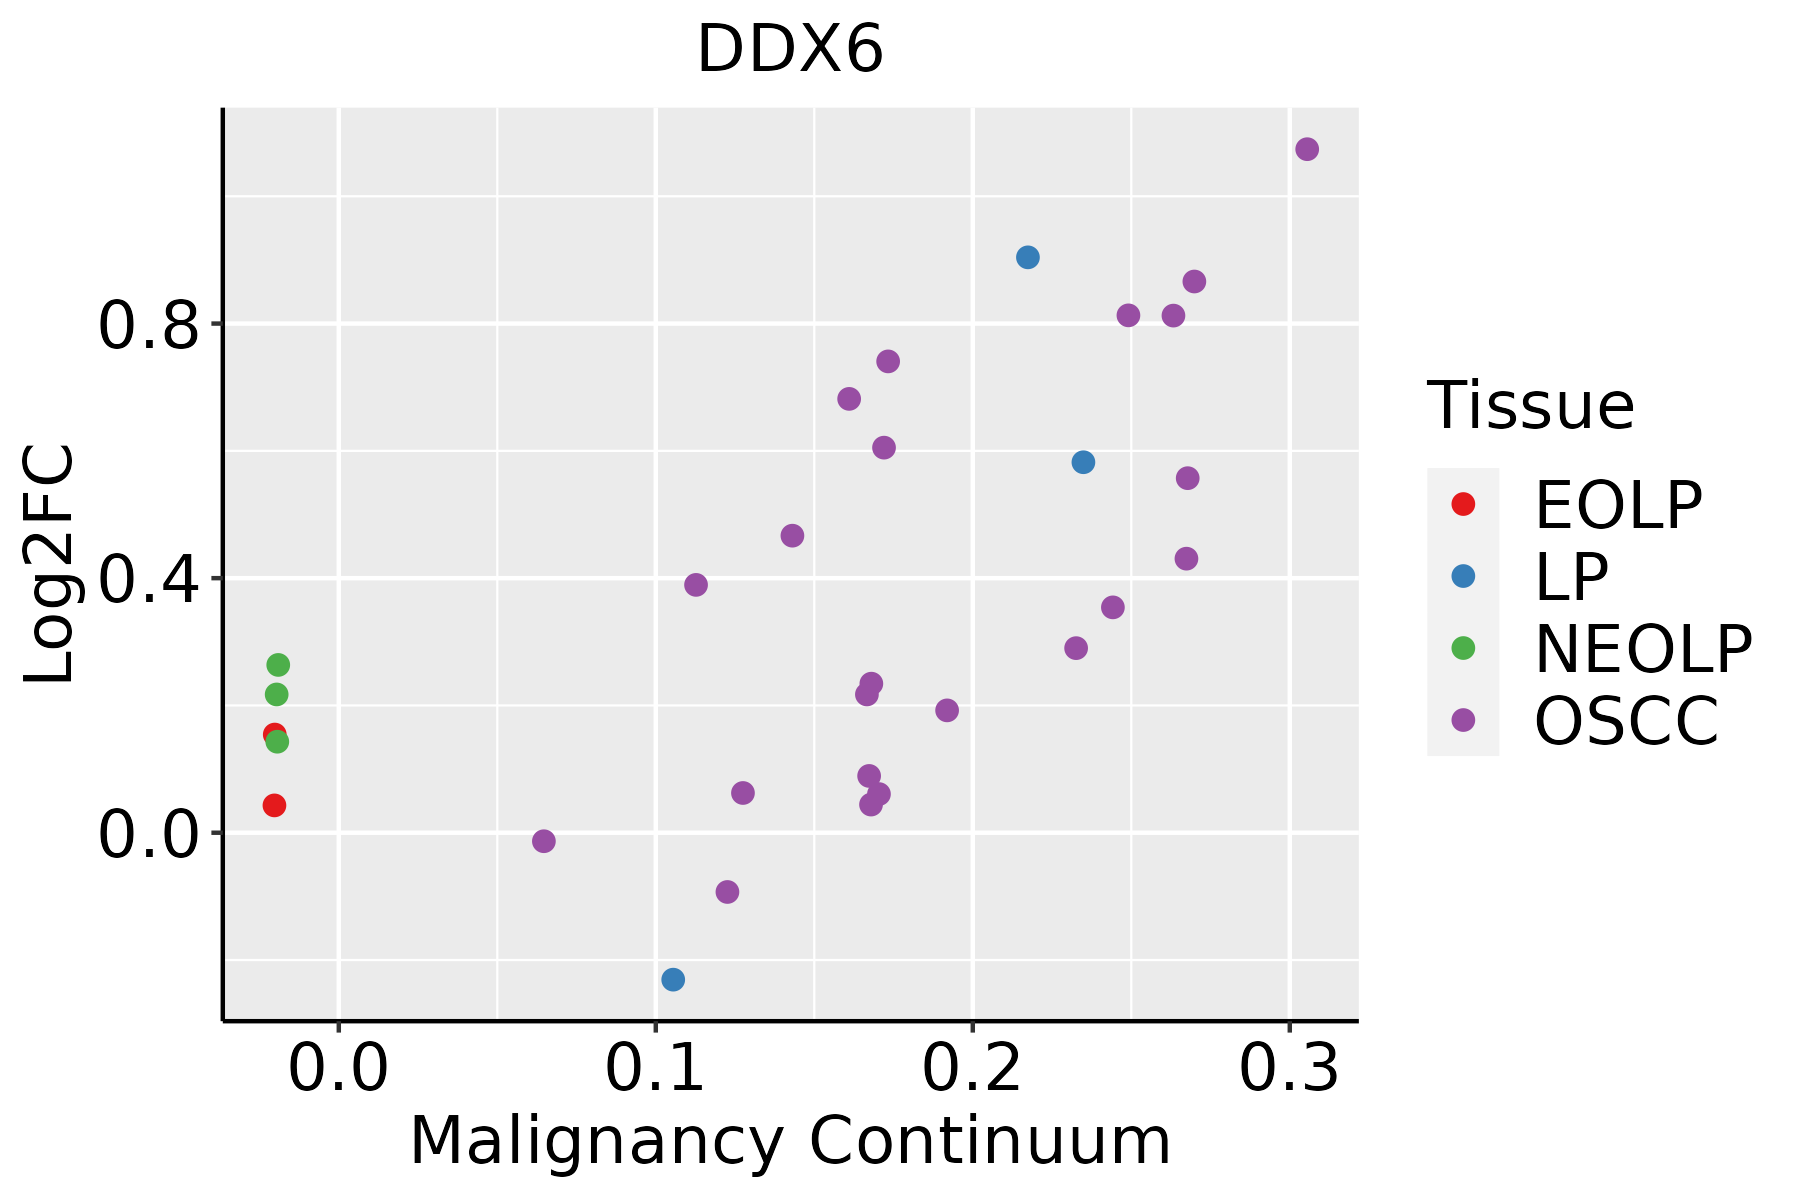 | EOLP: Erosive Oral lichen planus |
| LP: leukoplakia | ||
| NEOLP: Non-erosive oral lichen planus | ||
| OSCC: Oral squamous cell carcinoma | ||
| Prostate | 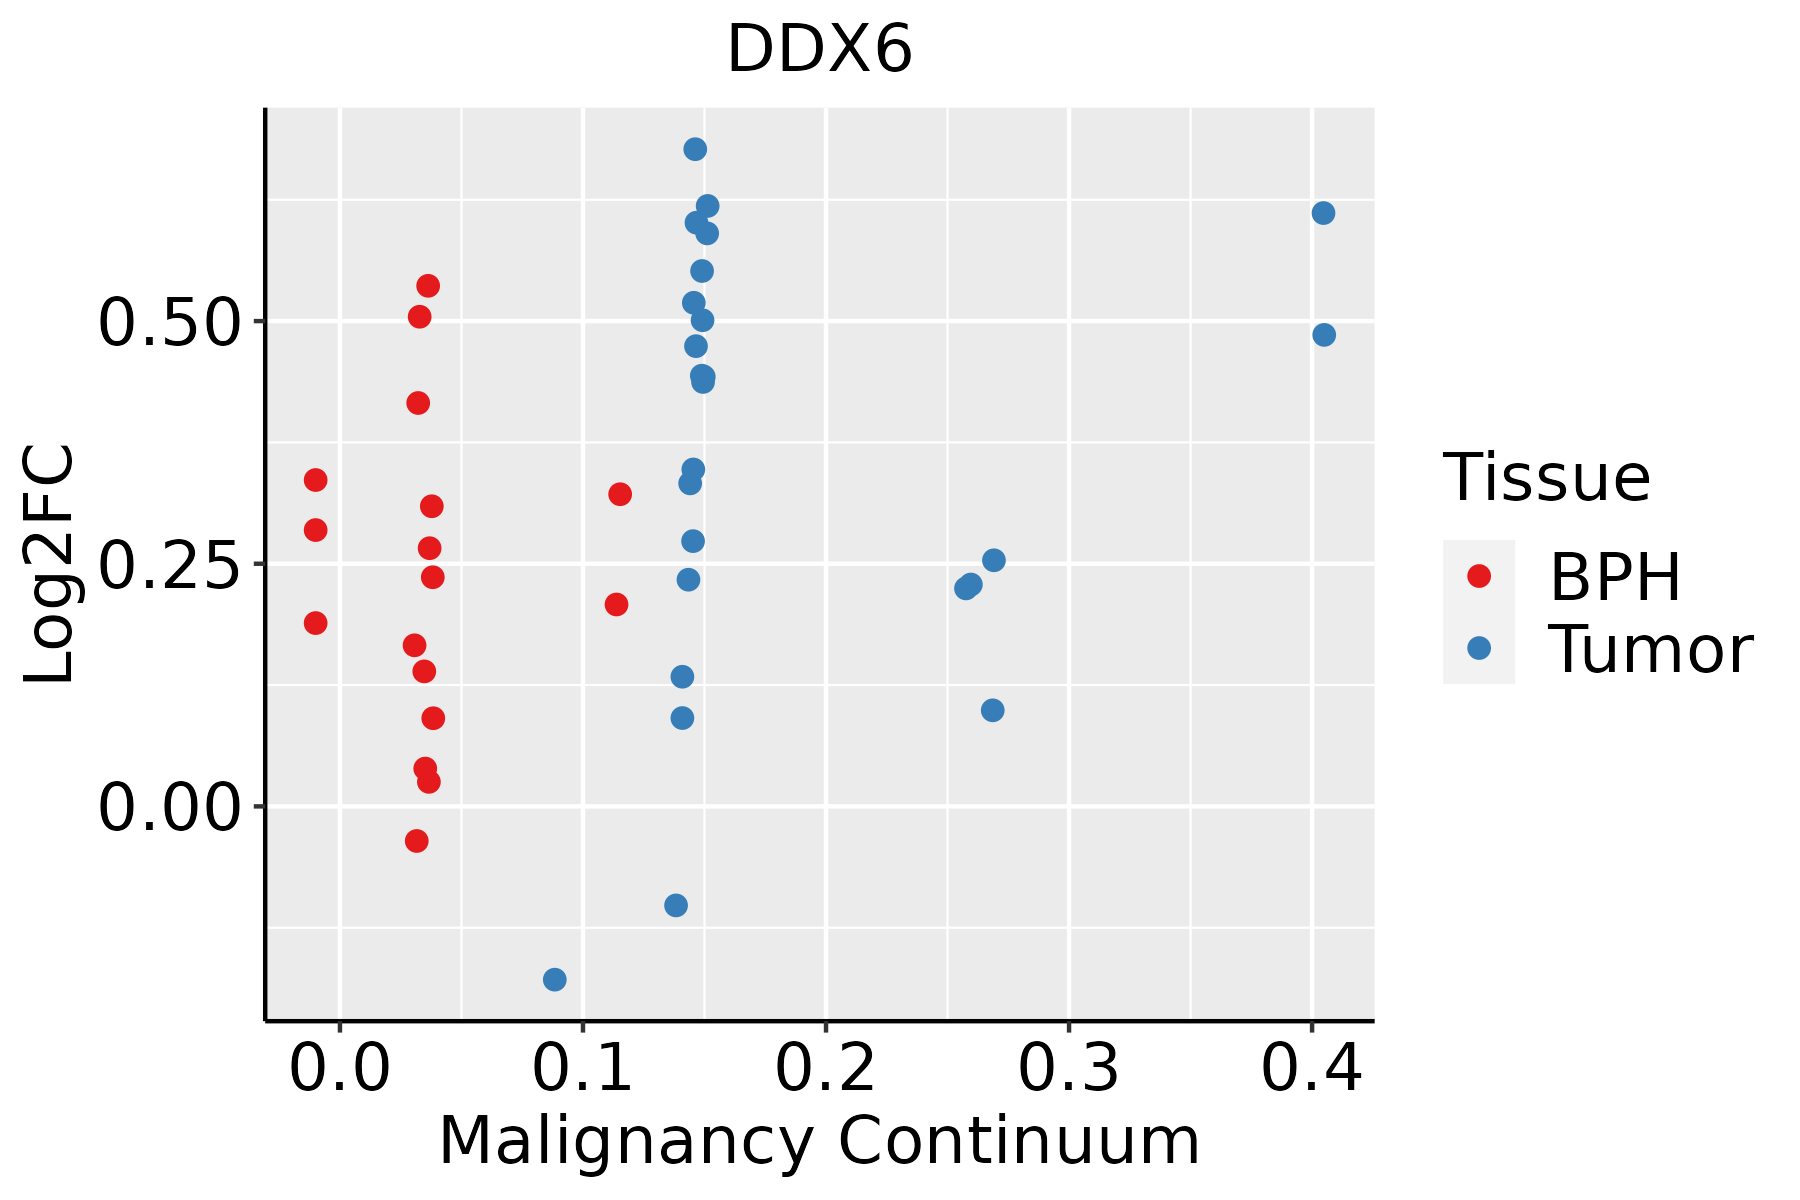 | BPH: Benign Prostatic Hyperplasia |
| Skin | 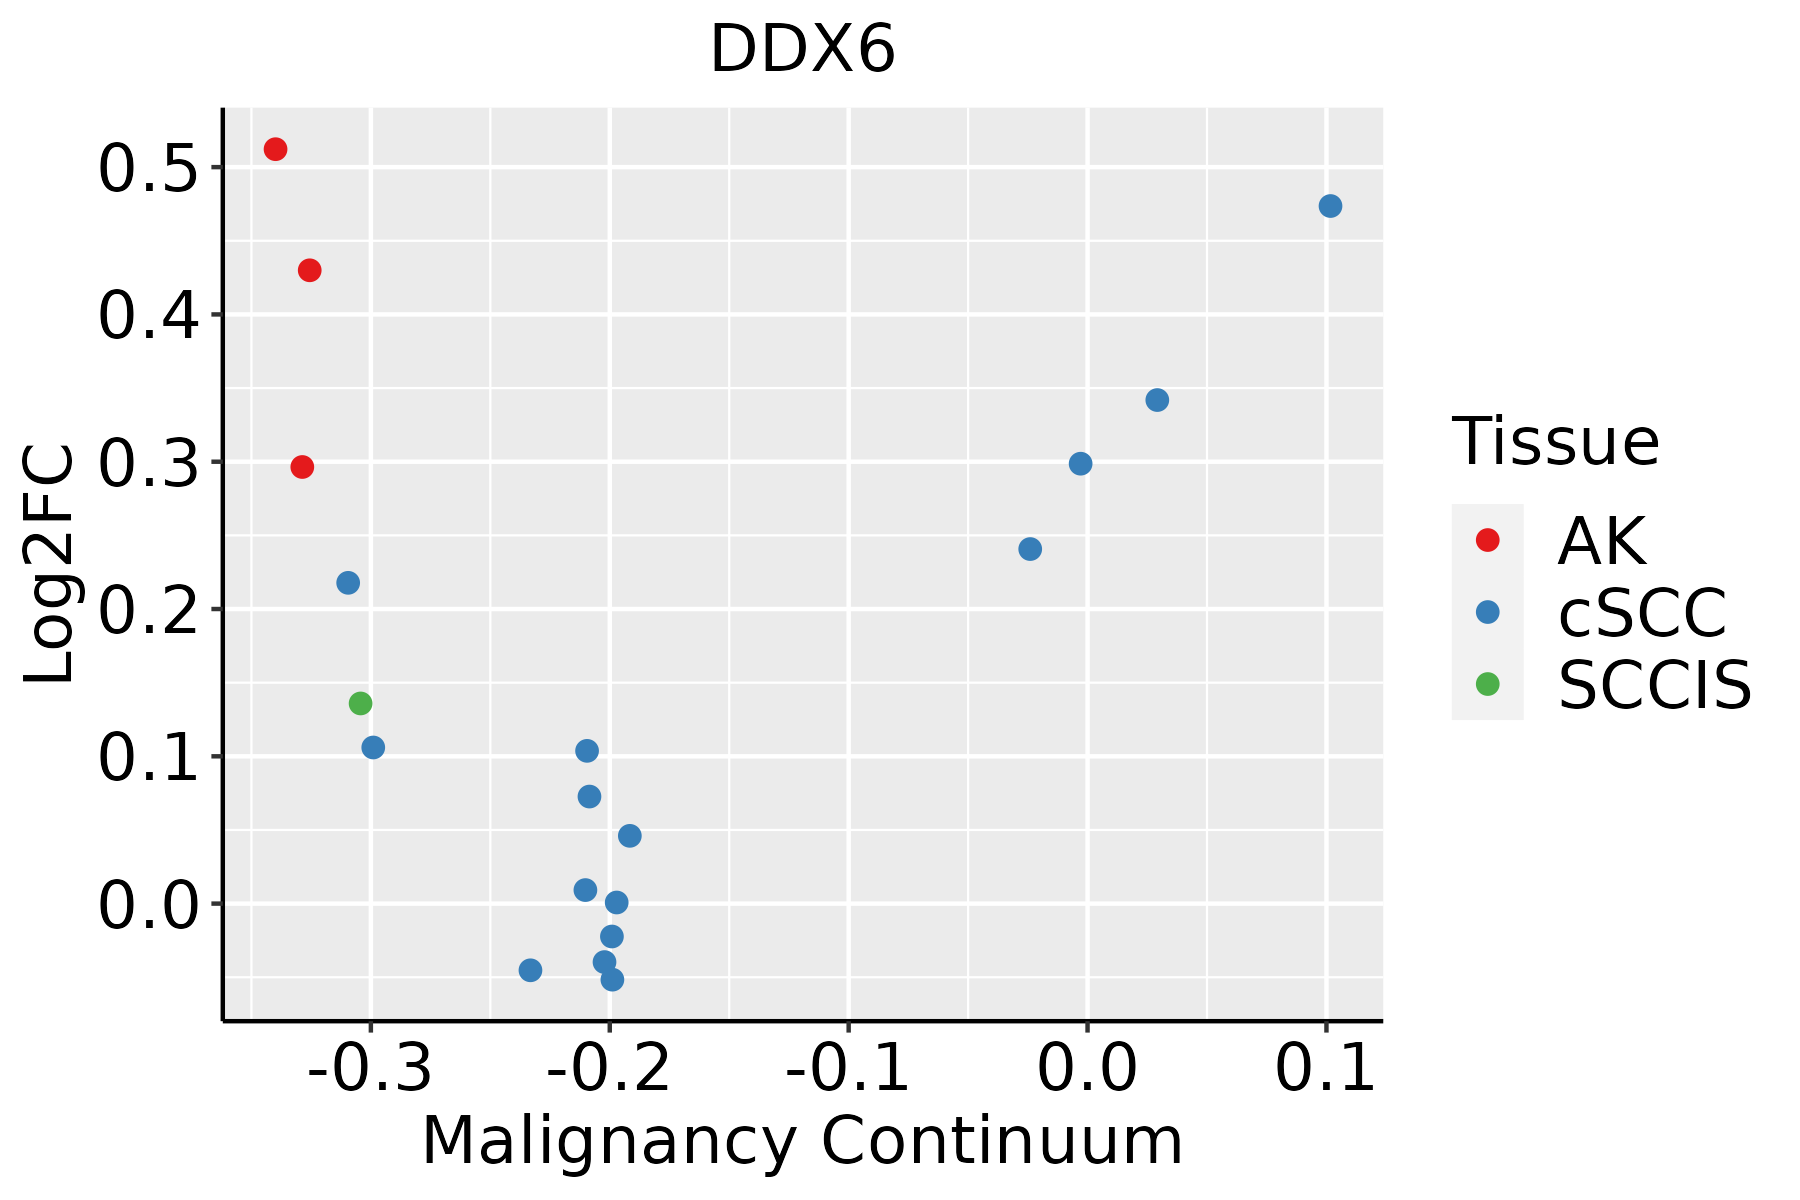 | AK: Actinic keratosis |
| cSCC: Cutaneous squamous cell carcinoma | ||
| SCCIS:squamous cell carcinoma in situ | ||
| Thyroid |  | ATC: Anaplastic thyroid cancer |
| HT: Hashimoto's thyroiditis | ||
| PTC: Papillary thyroid cancer |
| ∗log2FC in expression of this searched gene in stem-like cells from each diseased tissue sample relative to stem-like cells in normal samples in each tissue plotted against the malignancy continuum. Samples are colored based on if they are from different disease stage. |
Top |
Malignant transformation related pathway analysis |
| Find out the enriched GO biological processes and KEGG pathways involved in transition from healthy to precancer to cancer |
| Tissue | Disease Stage | Enriched GO biological Processes |
| Colorectum | AD |  |
| Colorectum | SER |  |
| Colorectum | MSS |  |
| Colorectum | MSI-H |  |
| Colorectum | FAP |  |
| ∗Top 15 enriched GO BP terms are showed in the bar plot of each disease state in each tissue. Each row represents a significant GO biological process which is colored according to the -log10(p.adjust). |
| Page: 1 2 3 4 5 6 7 8 9 |
| GO ID | Tissue | Disease Stage | Description | Gene Ratio | Bg Ratio | pvalue | p.adjust | Count |
| GO:000641727 | Esophagus | HGIN | regulation of translation | 139/2587 | 468/18723 | 1.46e-19 | 7.98e-17 | 139 |
| GO:001603227 | Esophagus | HGIN | viral process | 118/2587 | 415/18723 | 3.01e-15 | 6.22e-13 | 118 |
| GO:001905827 | Esophagus | HGIN | viral life cycle | 93/2587 | 317/18723 | 3.66e-13 | 5.63e-11 | 93 |
| GO:00198277 | Esophagus | HGIN | stem cell population maintenance | 39/2587 | 131/18723 | 1.63e-06 | 6.14e-05 | 39 |
| GO:00342496 | Esophagus | HGIN | negative regulation of cellular amide metabolic process | 66/2587 | 273/18723 | 2.74e-06 | 9.60e-05 | 66 |
| GO:00987278 | Esophagus | HGIN | maintenance of cell number | 39/2587 | 134/18723 | 3.02e-06 | 1.03e-04 | 39 |
| GO:00171486 | Esophagus | HGIN | negative regulation of translation | 59/2587 | 245/18723 | 1.03e-05 | 2.96e-04 | 59 |
| GO:00190687 | Esophagus | HGIN | virion assembly | 13/2587 | 35/18723 | 4.89e-04 | 7.14e-03 | 13 |
| GO:00340638 | Esophagus | HGIN | stress granule assembly | 10/2587 | 26/18723 | 1.60e-03 | 1.79e-02 | 10 |
| GO:003396210 | Esophagus | HGIN | P-body assembly | 8/2587 | 21/18723 | 5.00e-03 | 4.19e-02 | 8 |
| GO:0016032111 | Esophagus | ESCC | viral process | 301/8552 | 415/18723 | 3.34e-29 | 1.32e-26 | 301 |
| GO:0019058111 | Esophagus | ESCC | viral life cycle | 226/8552 | 317/18723 | 1.17e-20 | 1.76e-18 | 226 |
| GO:0006417111 | Esophagus | ESCC | regulation of translation | 304/8552 | 468/18723 | 1.53e-17 | 1.33e-15 | 304 |
| GO:000961518 | Esophagus | ESCC | response to virus | 238/8552 | 367/18723 | 6.65e-14 | 3.32e-12 | 238 |
| GO:00516075 | Esophagus | ESCC | defense response to virus | 171/8552 | 265/18723 | 3.91e-10 | 1.05e-08 | 171 |
| GO:01405465 | Esophagus | ESCC | defense response to symbiont | 171/8552 | 265/18723 | 3.91e-10 | 1.05e-08 | 171 |
| GO:0030522110 | Esophagus | ESCC | intracellular receptor signaling pathway | 170/8552 | 265/18723 | 8.58e-10 | 2.09e-08 | 170 |
| GO:001906815 | Esophagus | ESCC | virion assembly | 31/8552 | 35/18723 | 1.40e-07 | 2.25e-06 | 31 |
| GO:009872714 | Esophagus | ESCC | maintenance of cell number | 90/8552 | 134/18723 | 3.94e-07 | 5.43e-06 | 90 |
| GO:001982714 | Esophagus | ESCC | stem cell population maintenance | 88/8552 | 131/18723 | 5.23e-07 | 6.97e-06 | 88 |
| Page: 1 2 3 4 5 6 7 8 9 10 11 12 13 14 15 16 17 |
| Pathway ID | Tissue | Disease Stage | Description | Gene Ratio | Bg Ratio | pvalue | p.adjust | qvalue | Count |
| hsa0301810 | Esophagus | HGIN | RNA degradation | 27/1383 | 79/8465 | 7.73e-05 | 9.00e-04 | 7.15e-04 | 27 |
| hsa0301815 | Esophagus | HGIN | RNA degradation | 27/1383 | 79/8465 | 7.73e-05 | 9.00e-04 | 7.15e-04 | 27 |
| hsa0301824 | Esophagus | ESCC | RNA degradation | 62/4205 | 79/8465 | 1.18e-07 | 9.39e-07 | 4.81e-07 | 62 |
| hsa0301834 | Esophagus | ESCC | RNA degradation | 62/4205 | 79/8465 | 1.18e-07 | 9.39e-07 | 4.81e-07 | 62 |
| hsa03018 | Liver | Cirrhotic | RNA degradation | 44/2530 | 79/8465 | 1.43e-06 | 1.65e-05 | 1.02e-05 | 44 |
| hsa030181 | Liver | Cirrhotic | RNA degradation | 44/2530 | 79/8465 | 1.43e-06 | 1.65e-05 | 1.02e-05 | 44 |
| hsa030182 | Liver | HCC | RNA degradation | 58/4020 | 79/8465 | 2.29e-06 | 2.19e-05 | 1.22e-05 | 58 |
| hsa030183 | Liver | HCC | RNA degradation | 58/4020 | 79/8465 | 2.29e-06 | 2.19e-05 | 1.22e-05 | 58 |
| hsa030189 | Oral cavity | OSCC | RNA degradation | 59/3704 | 79/8465 | 2.05e-08 | 1.91e-07 | 9.70e-08 | 59 |
| hsa0301814 | Oral cavity | OSCC | RNA degradation | 59/3704 | 79/8465 | 2.05e-08 | 1.91e-07 | 9.70e-08 | 59 |
| hsa0301823 | Oral cavity | LP | RNA degradation | 39/2418 | 79/8465 | 6.98e-05 | 4.38e-04 | 2.83e-04 | 39 |
| hsa0301833 | Oral cavity | LP | RNA degradation | 39/2418 | 79/8465 | 6.98e-05 | 4.38e-04 | 2.83e-04 | 39 |
| hsa0301841 | Oral cavity | EOLP | RNA degradation | 22/1218 | 79/8465 | 1.33e-03 | 4.80e-03 | 2.83e-03 | 22 |
| hsa0301851 | Oral cavity | EOLP | RNA degradation | 22/1218 | 79/8465 | 1.33e-03 | 4.80e-03 | 2.83e-03 | 22 |
| hsa0301861 | Oral cavity | NEOLP | RNA degradation | 18/1112 | 79/8465 | 1.25e-02 | 4.06e-02 | 2.56e-02 | 18 |
| hsa0301871 | Oral cavity | NEOLP | RNA degradation | 18/1112 | 79/8465 | 1.25e-02 | 4.06e-02 | 2.56e-02 | 18 |
| hsa030188 | Prostate | BPH | RNA degradation | 29/1718 | 79/8465 | 5.17e-04 | 2.67e-03 | 1.65e-03 | 29 |
| hsa0301813 | Prostate | BPH | RNA degradation | 29/1718 | 79/8465 | 5.17e-04 | 2.67e-03 | 1.65e-03 | 29 |
| hsa0301822 | Prostate | Tumor | RNA degradation | 30/1791 | 79/8465 | 4.48e-04 | 2.35e-03 | 1.46e-03 | 30 |
| hsa0301832 | Prostate | Tumor | RNA degradation | 30/1791 | 79/8465 | 4.48e-04 | 2.35e-03 | 1.46e-03 | 30 |
| Page: 1 |
Top |
Cell-cell communication analysis |
| Identification of potential cell-cell interactions between two cell types and their ligand-receptor pairs for different disease states |
| Ligand | Receptor | LRpair | Pathway | Tissue | Disease Stage |
| Page: 1 |
Top |
Single-cell gene regulatory network inference analysis |
| Find out the significant the regulons (TFs) and the target genes of each regulon across cell types for different disease states |
| TF | Cell Type | Tissue | Disease Stage | Target Gene | RSS | Regulon Activity |
| ∗The dot plots of a searched regulon are shown for all cell subpopulations in each disease state of each tissue based on the regulon specific score inferred using pySCENIC and by calculating the average expression. |
| Page: 1 |
Top |
Somatic mutation of malignant transformation related genes |
| Annotation of somatic variants for genes involved in malignant transformation |
| Hugo Symbol | Variant Class | Variant Classification | dbSNP RS | HGVSc | HGVSp | HGVSp Short | SWISSPROT | BIOTYPE | SIFT | PolyPhen | Tumor Sample Barcode | Tissue | Histology | Sex | Age | Stage | Therapy Types | Drugs | Outcome |
| DDX6 | SNV | Missense_Mutation | c.602N>C | p.Gly201Ala | p.G201A | P26196 | protein_coding | deleterious(0) | possibly_damaging(0.824) | TCGA-A2-A0CL-01 | Breast | breast invasive carcinoma | Female | <65 | III/IV | Chemotherapy | cytoxan | SD | |
| DDX6 | SNV | Missense_Mutation | c.1104N>C | p.Met368Ile | p.M368I | P26196 | protein_coding | deleterious(0) | probably_damaging(0.997) | TCGA-D8-A1JA-01 | Breast | breast invasive carcinoma | Female | <65 | III/IV | Chemotherapy | adriamycin | PD | |
| DDX6 | SNV | Missense_Mutation | c.952N>A | p.Glu318Lys | p.E318K | P26196 | protein_coding | deleterious(0.04) | possibly_damaging(0.665) | TCGA-D8-A1XJ-01 | Breast | breast invasive carcinoma | Female | >=65 | III/IV | Hormone Therapy | tamoxiphen | SD | |
| DDX6 | SNV | Missense_Mutation | c.1198A>T | p.Ile400Leu | p.I400L | P26196 | protein_coding | deleterious(0) | possibly_damaging(0.847) | TCGA-D8-A1XV-01 | Breast | breast invasive carcinoma | Female | >=65 | I/II | Unknown | Unknown | SD | |
| DDX6 | insertion | Frame_Shift_Ins | novel | c.38_39dupGT | p.Leu14ValfsTer9 | p.L14Vfs*9 | P26196 | protein_coding | TCGA-A7-A26F-01 | Breast | breast invasive carcinoma | Female | <65 | I/II | Chemotherapy | taxotere | SD | ||
| DDX6 | insertion | Frame_Shift_Ins | novel | c.42_43insAGGCAGGTAGATCACGAGGTCAAAAGTTTGAGGC | p.Ser15ArgfsTer50 | p.S15Rfs*50 | P26196 | protein_coding | TCGA-A8-A09X-01 | Breast | breast invasive carcinoma | Female | <65 | III/IV | Unknown | Unknown | SD | ||
| DDX6 | insertion | Frame_Shift_Ins | novel | c.962_963insCTTTAGAAGACTTACTCTGGCACTCATAC | p.Lys321AsnfsTer24 | p.K321Nfs*24 | P26196 | protein_coding | TCGA-AO-A03T-01 | Breast | breast invasive carcinoma | Female | <65 | I/II | Chemotherapy | cyclophosphamide | SD | ||
| DDX6 | SNV | Missense_Mutation | novel | c.220N>G | p.Lys74Glu | p.K74E | P26196 | protein_coding | tolerated(0.46) | benign(0.003) | TCGA-2W-A8YY-01 | Cervix | cervical & endocervical cancer | Female | <65 | I/II | Chemotherapy | cisplatin | CR |
| DDX6 | insertion | Frame_Shift_Ins | novel | c.1036_1037insTAGAA | p.Arg346LeufsTer7 | p.R346Lfs*7 | P26196 | protein_coding | TCGA-DS-A1OA-01 | Cervix | cervical & endocervical cancer | Female | >=65 | I/II | Chemotherapy | carboplatin | PD | ||
| DDX6 | insertion | Nonsense_Mutation | novel | c.1035_1036insGGAGAATGA | p.Gln345_Arg346insGlyGluTer | p.Q345_R346insGE* | P26196 | protein_coding | TCGA-DS-A1OA-01 | Cervix | cervical & endocervical cancer | Female | >=65 | I/II | Chemotherapy | carboplatin | PD |
| Page: 1 2 3 4 5 |
Top |
Related drugs of malignant transformation related genes |
| Identification of chemicals and drugs interact with genes involved in malignant transfromation |
| (DGIdb 4.0) |
| Entrez ID | Symbol | Category | Interaction Types | Drug Claim Name | Drug Name | PMIDs |
| Page: 1 |

Copyright 2023-Present -The University of Texas Health Science Center at Houston |