
|
|||||
|
 | |
| |
| |
| |
| |
| |
|
Gene: CSNK1E |
Gene summary for CSNK1E |
| Gene information | Species | Human | Gene symbol | CSNK1E | Gene ID | 1454 |
| Gene name | casein kinase 1 epsilon | |
| Gene Alias | CKIe | |
| Cytomap | 22q13.1 | |
| Gene Type | protein-coding | GO ID | GO:0006139 | UniProtAcc | P49674 |
Top |
Malignant transformation analysis |
| Identification of the aberrant gene expression in precancerous and cancerous lesions by comparing the gene expression of stem-like cells in diseased tissues with normal stem cells |
| Entrez ID | Symbol | Replicates | Species | Organ | Tissue | Adj P-value | Log2FC | Malignancy |
| 1454 | CSNK1E | GSM5252133_BPH389PrSF | Human | Prostate | BPH | 4.01e-05 | 1.26e+00 | -0.2027 |
| 1454 | CSNK1E | GSM5252134_BPH511PrG_Fcol_3GEX | Human | Prostate | BPH | 3.37e-06 | 3.83e-01 | -0.1433 |
| 1454 | CSNK1E | GSM5252135_BPH511PrPUr_Fcol_3GEX | Human | Prostate | BPH | 2.74e-19 | 8.76e-01 | -0.1833 |
| 1454 | CSNK1E | GSM5252137_BPH556PrGA2_Fcol | Human | Prostate | BPH | 6.41e-06 | 5.89e-01 | -0.23 |
| 1454 | CSNK1E | 047563_1562-all-cells | Human | Prostate | BPH | 1.87e-08 | -1.40e-01 | 0.0791 |
| 1454 | CSNK1E | 048752_1579-all-cells | Human | Prostate | BPH | 4.33e-03 | 1.97e-01 | 0.1008 |
| 1454 | CSNK1E | 052097_1595-all-cells | Human | Prostate | BPH | 6.18e-04 | 2.28e-01 | 0.0972 |
| 1454 | CSNK1E | Dong_P1 | Human | Prostate | Tumor | 7.75e-28 | -6.79e-02 | 0.035 |
| 1454 | CSNK1E | Dong_P3 | Human | Prostate | Tumor | 4.24e-10 | -1.10e-01 | 0.0278 |
| 1454 | CSNK1E | Dong_P4 | Human | Prostate | Tumor | 2.66e-05 | -8.49e-02 | 0.0292 |
| 1454 | CSNK1E | Dong_P5 | Human | Prostate | Tumor | 9.56e-24 | -2.60e-01 | 0.053 |
| 1454 | CSNK1E | Dong_P6 | Human | Prostate | Tumor | 4.64e-02 | -4.19e-01 | 0.0371 |
| 1454 | CSNK1E | GSM5353227_PA_PR5199-193K_Pool_1_2_3_S55_L002 | Human | Prostate | Tumor | 2.75e-04 | -2.68e-01 | 0.1602 |
| 1454 | CSNK1E | GSM5353240_PA_PR5254_T1_S15_L001 | Human | Prostate | Tumor | 2.36e-03 | -3.93e-02 | 0.1575 |
| 1454 | CSNK1E | GSM5353243_PA_PR5261_T1_S23_L002 | Human | Prostate | Tumor | 3.20e-09 | -1.52e-01 | 0.1545 |
| 1454 | CSNK1E | GSM5353244_PA_PR5261_T2_S24_L002 | Human | Prostate | Tumor | 3.10e-04 | -8.96e-02 | 0.1569 |
| 1454 | CSNK1E | GSM5353247_PA_PR5269_3_S27_L002 | Human | Prostate | Tumor | 1.22e-03 | 1.95e-01 | 0.1532 |
| 1454 | CSNK1E | P4_S8_cSCC | Human | Skin | cSCC | 1.15e-03 | 1.10e-01 | -0.3095 |
| 1454 | CSNK1E | P1_cSCC | Human | Skin | cSCC | 3.74e-10 | 6.29e-01 | 0.0292 |
| 1454 | CSNK1E | P2_cSCC | Human | Skin | cSCC | 3.19e-02 | 2.54e-01 | -0.024 |
| Page: 1 2 3 4 5 6 7 8 9 |
| Tissue | Expression Dynamics | Abbreviation |
| Cervix | 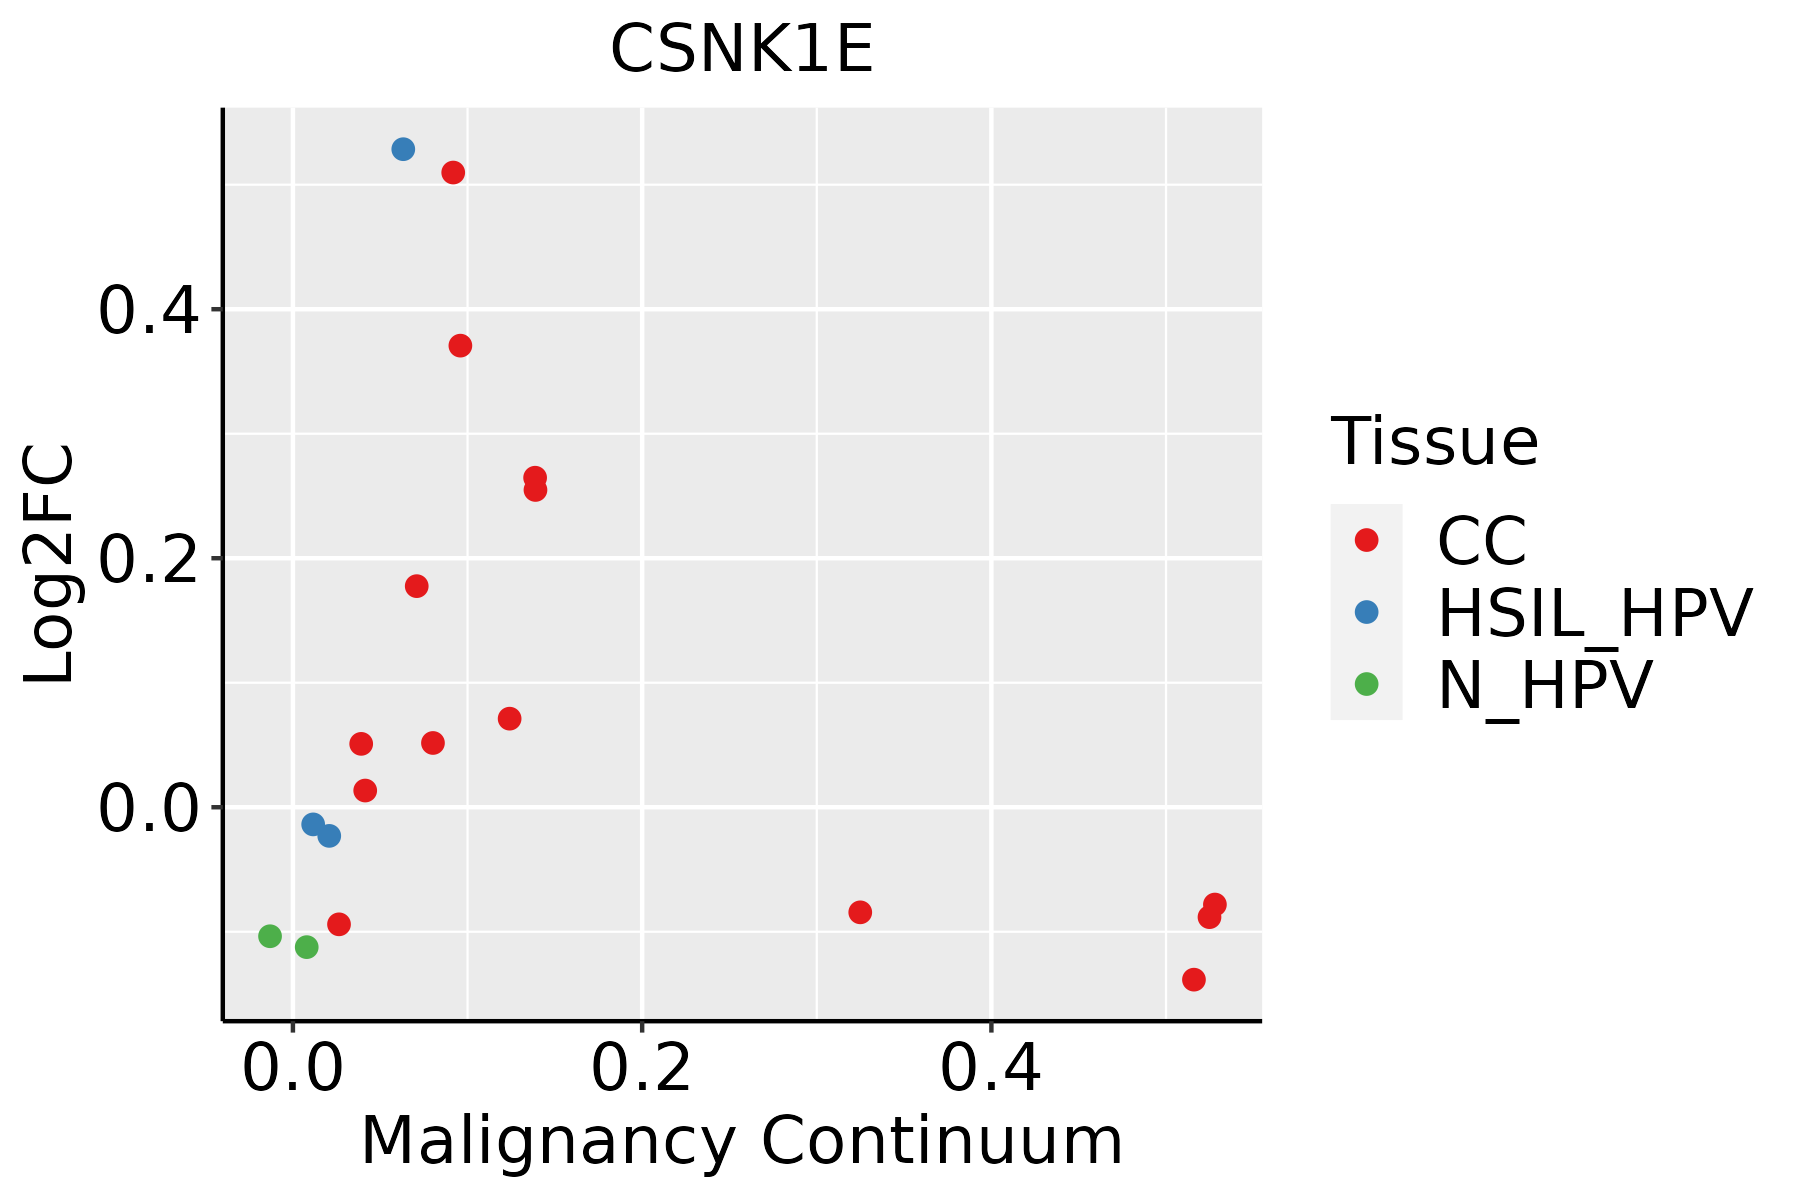 | CC: Cervix cancer |
| HSIL_HPV: HPV-infected high-grade squamous intraepithelial lesions | ||
| N_HPV: HPV-infected normal cervix | ||
| Colorectum (GSE201348) |  | FAP: Familial adenomatous polyposis |
| CRC: Colorectal cancer | ||
| Colorectum (HTA11) |  | AD: Adenomas |
| SER: Sessile serrated lesions | ||
| MSI-H: Microsatellite-high colorectal cancer | ||
| MSS: Microsatellite stable colorectal cancer | ||
| Esophagus | 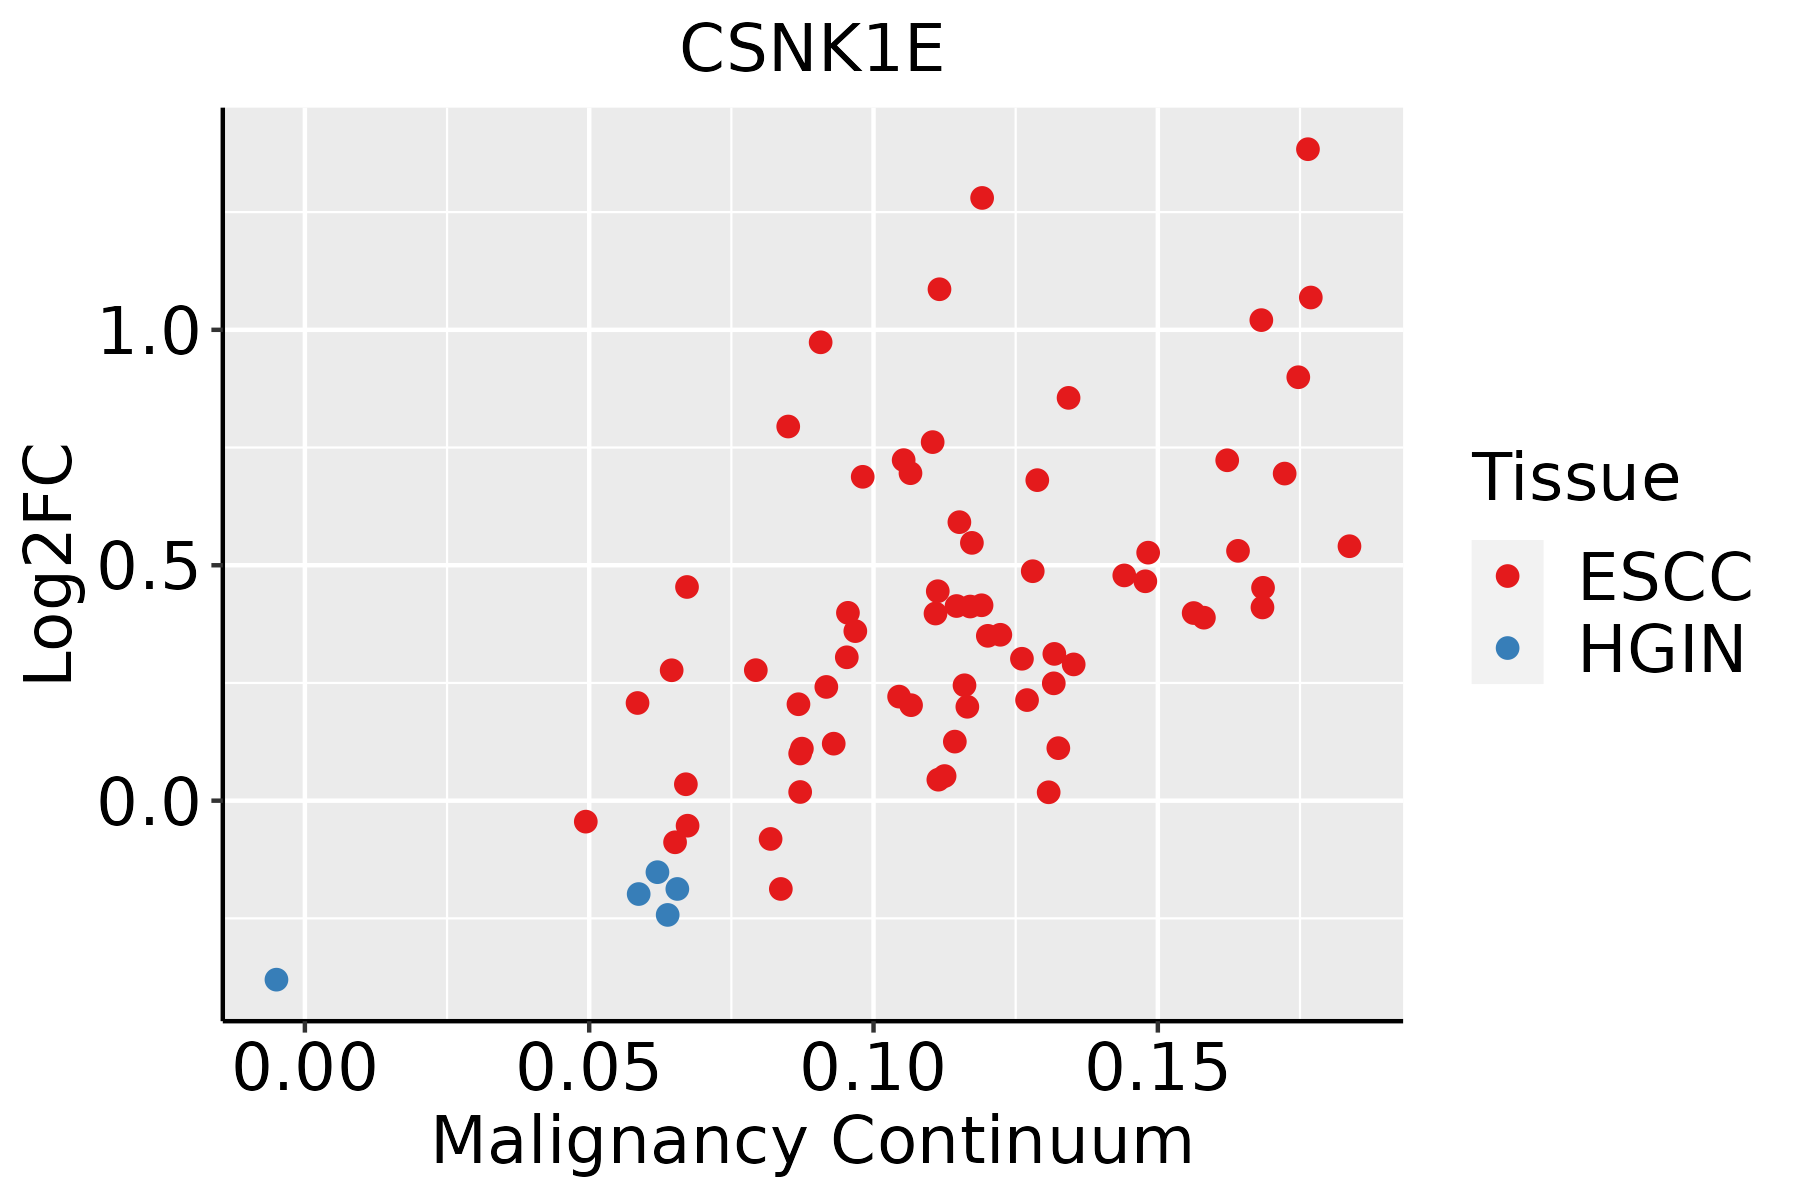 | ESCC: Esophageal squamous cell carcinoma |
| HGIN: High-grade intraepithelial neoplasias | ||
| LGIN: Low-grade intraepithelial neoplasias | ||
| Liver | 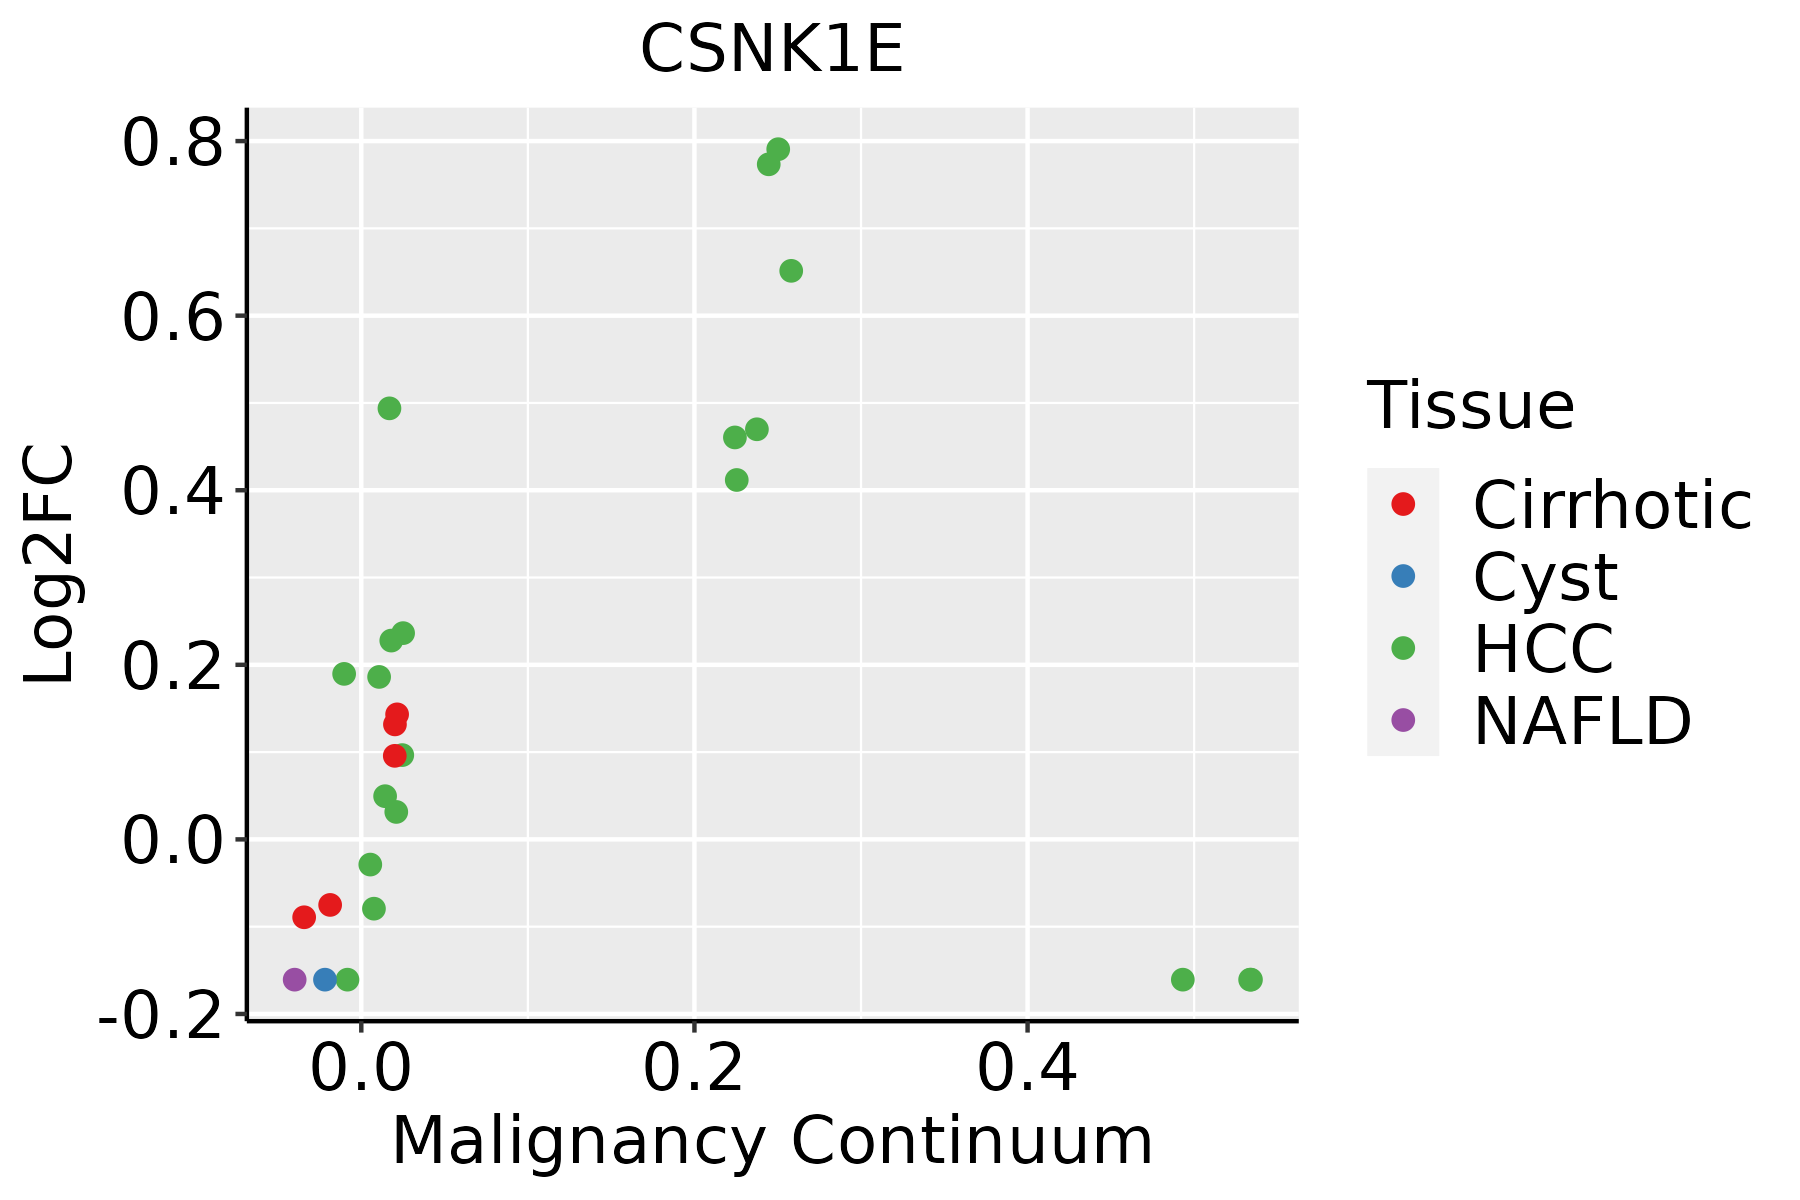 | HCC: Hepatocellular carcinoma |
| NAFLD: Non-alcoholic fatty liver disease | ||
| Oral Cavity |  | EOLP: Erosive Oral lichen planus |
| LP: leukoplakia | ||
| NEOLP: Non-erosive oral lichen planus | ||
| OSCC: Oral squamous cell carcinoma | ||
| Prostate |  | BPH: Benign Prostatic Hyperplasia |
| Skin | 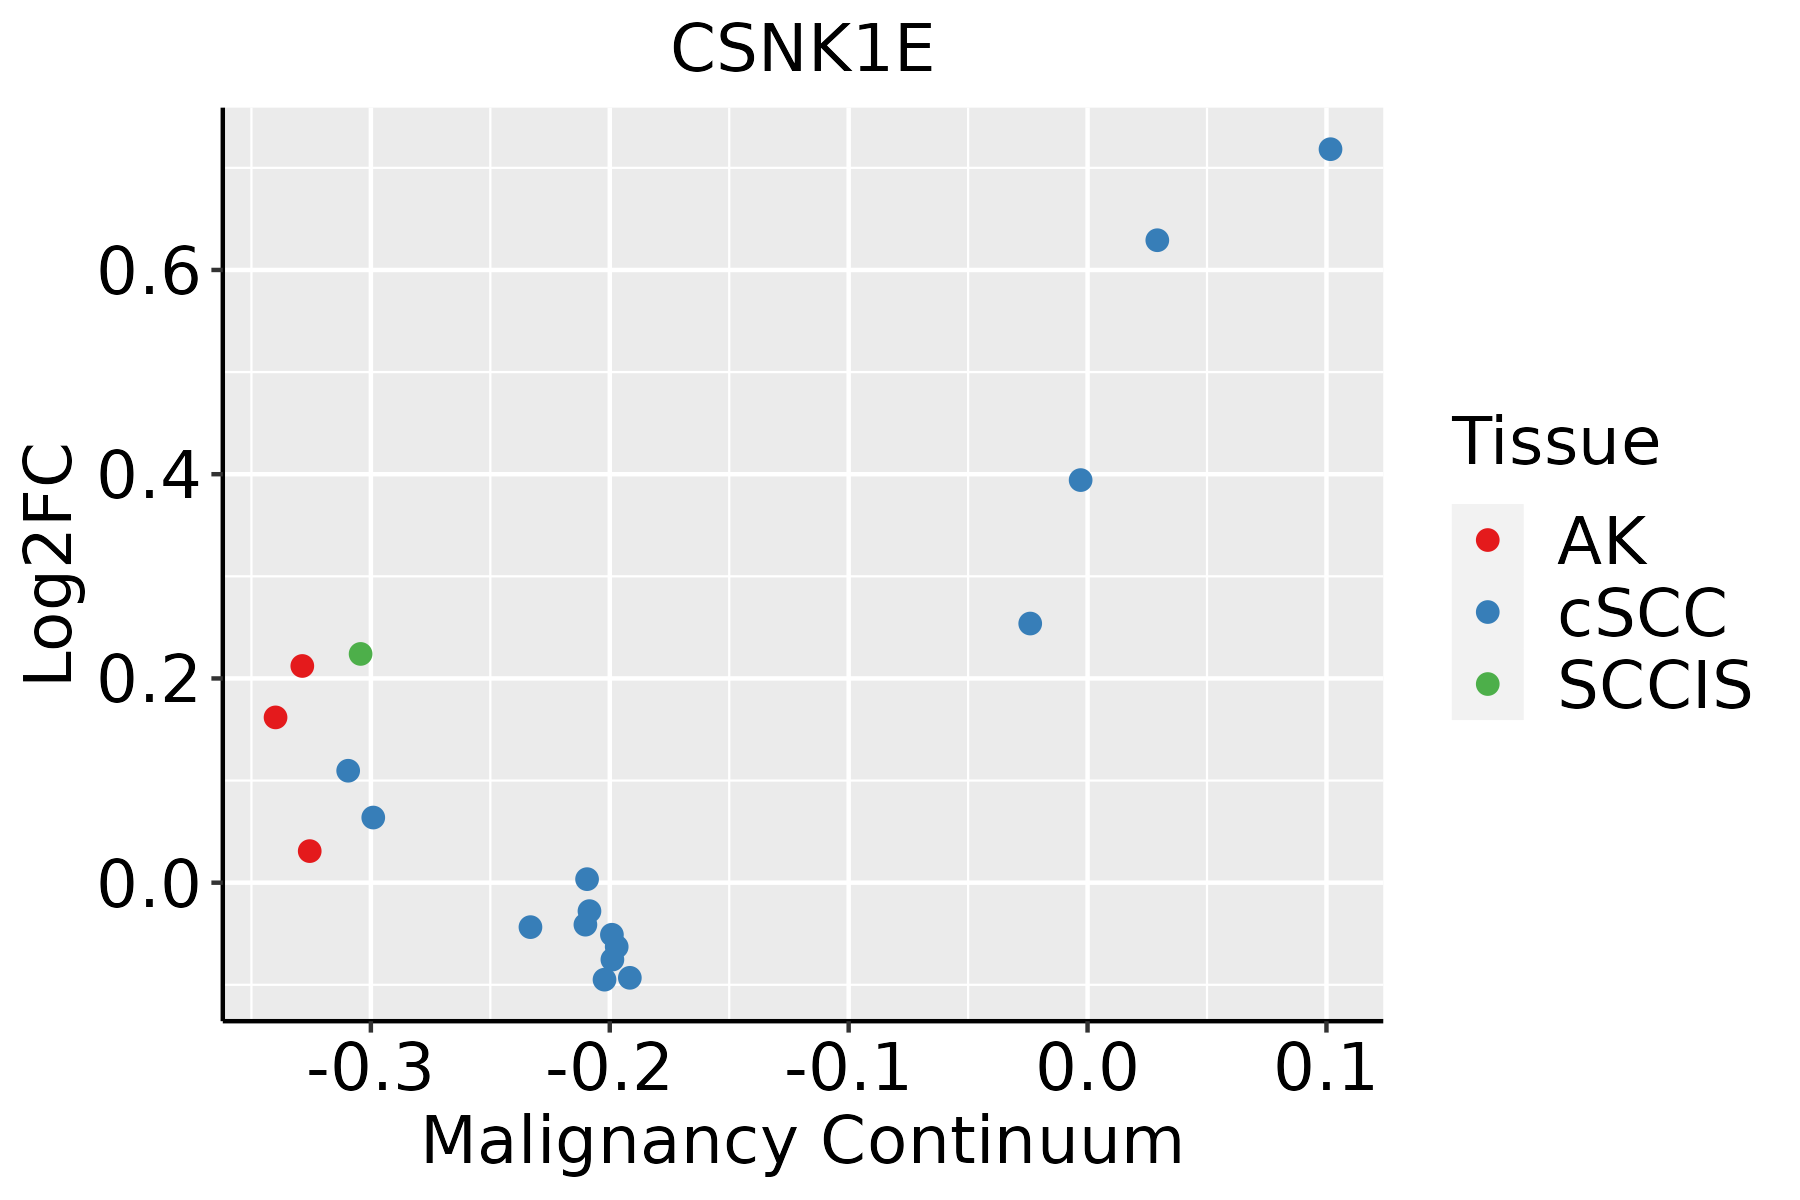 | AK: Actinic keratosis |
| cSCC: Cutaneous squamous cell carcinoma | ||
| SCCIS:squamous cell carcinoma in situ | ||
| Thyroid | 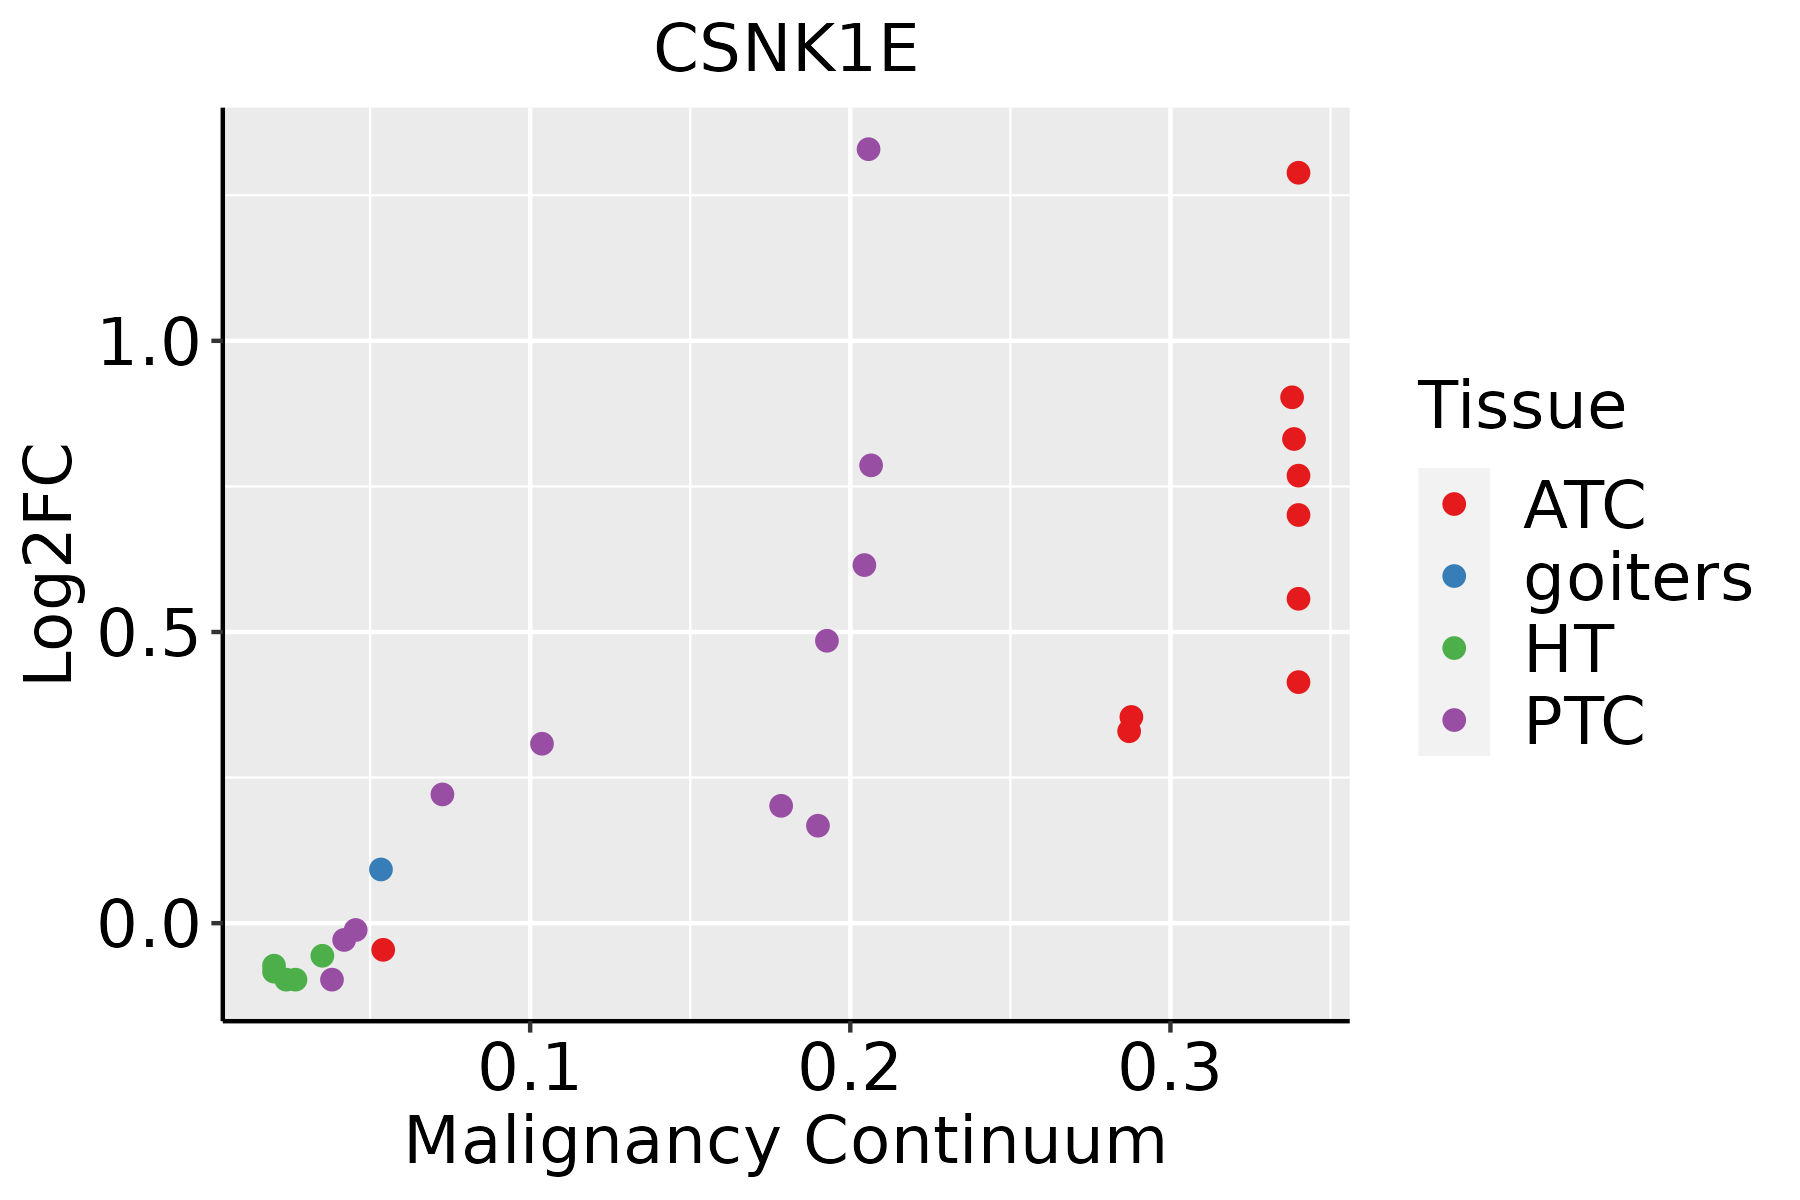 | ATC: Anaplastic thyroid cancer |
| HT: Hashimoto's thyroiditis | ||
| PTC: Papillary thyroid cancer |
| ∗log2FC in expression of this searched gene in stem-like cells from each diseased tissue sample relative to stem-like cells in normal samples in each tissue plotted against the malignancy continuum. Samples are colored based on if they are from different disease stage. |
Top |
Malignant transformation related pathway analysis |
| Find out the enriched GO biological processes and KEGG pathways involved in transition from healthy to precancer to cancer |
| Tissue | Disease Stage | Enriched GO biological Processes |
| Colorectum | AD |  |
| Colorectum | SER |  |
| Colorectum | MSS |  |
| Colorectum | MSI-H |  |
| Colorectum | FAP |  |
| ∗Top 15 enriched GO BP terms are showed in the bar plot of each disease state in each tissue. Each row represents a significant GO biological process which is colored according to the -log10(p.adjust). |
| Page: 1 2 3 4 5 6 7 8 9 |
| GO ID | Tissue | Disease Stage | Description | Gene Ratio | Bg Ratio | pvalue | p.adjust | Count |
| GO:004217610 | Cervix | CC | regulation of protein catabolic process | 104/2311 | 391/18723 | 9.39e-15 | 9.36e-12 | 104 |
| GO:004586210 | Cervix | CC | positive regulation of proteolysis | 95/2311 | 372/18723 | 1.84e-12 | 6.86e-10 | 95 |
| GO:190336210 | Cervix | CC | regulation of cellular protein catabolic process | 72/2311 | 255/18723 | 5.98e-12 | 2.10e-09 | 72 |
| GO:004573210 | Cervix | CC | positive regulation of protein catabolic process | 65/2311 | 231/18723 | 7.44e-11 | 1.39e-08 | 65 |
| GO:001049810 | Cervix | CC | proteasomal protein catabolic process | 111/2311 | 490/18723 | 8.98e-11 | 1.58e-08 | 111 |
| GO:000989610 | Cervix | CC | positive regulation of catabolic process | 109/2311 | 492/18723 | 5.26e-10 | 6.99e-08 | 109 |
| GO:190305010 | Cervix | CC | regulation of proteolysis involved in cellular protein catabolic process | 60/2311 | 221/18723 | 1.82e-09 | 1.98e-07 | 60 |
| GO:00160557 | Cervix | CC | Wnt signaling pathway | 98/2311 | 444/18723 | 4.82e-09 | 4.65e-07 | 98 |
| GO:01987387 | Cervix | CC | cell-cell signaling by wnt | 98/2311 | 446/18723 | 6.16e-09 | 5.58e-07 | 98 |
| GO:200005810 | Cervix | CC | regulation of ubiquitin-dependent protein catabolic process | 47/2311 | 164/18723 | 1.63e-08 | 1.25e-06 | 47 |
| GO:004316110 | Cervix | CC | proteasome-mediated ubiquitin-dependent protein catabolic process | 91/2311 | 412/18723 | 1.65e-08 | 1.25e-06 | 91 |
| GO:00301117 | Cervix | CC | regulation of Wnt signaling pathway | 76/2311 | 328/18723 | 3.05e-08 | 2.08e-06 | 76 |
| GO:003133110 | Cervix | CC | positive regulation of cellular catabolic process | 91/2311 | 427/18723 | 9.64e-08 | 5.25e-06 | 91 |
| GO:005109810 | Cervix | CC | regulation of binding | 80/2311 | 363/18723 | 1.32e-07 | 6.42e-06 | 80 |
| GO:190336410 | Cervix | CC | positive regulation of cellular protein catabolic process | 43/2311 | 155/18723 | 1.80e-07 | 8.28e-06 | 43 |
| GO:006113610 | Cervix | CC | regulation of proteasomal protein catabolic process | 48/2311 | 187/18723 | 4.63e-07 | 1.77e-05 | 48 |
| GO:003243410 | Cervix | CC | regulation of proteasomal ubiquitin-dependent protein catabolic process | 38/2311 | 134/18723 | 4.99e-07 | 1.88e-05 | 38 |
| GO:00608287 | Cervix | CC | regulation of canonical Wnt signaling pathway | 58/2311 | 253/18723 | 1.83e-06 | 5.89e-05 | 58 |
| GO:00600707 | Cervix | CC | canonical Wnt signaling pathway | 66/2311 | 303/18723 | 2.47e-06 | 7.35e-05 | 66 |
| GO:00485118 | Cervix | CC | rhythmic process | 65/2311 | 298/18723 | 2.79e-06 | 8.04e-05 | 65 |
| Page: 1 2 3 4 5 6 7 8 9 10 11 12 13 14 15 16 17 18 19 20 21 22 23 24 25 26 27 |
| Pathway ID | Tissue | Disease Stage | Description | Gene Ratio | Bg Ratio | pvalue | p.adjust | qvalue | Count |
| hsa043908 | Cervix | CC | Hippo signaling pathway | 40/1267 | 157/8465 | 3.64e-04 | 1.82e-03 | 1.07e-03 | 40 |
| hsa0439013 | Cervix | CC | Hippo signaling pathway | 40/1267 | 157/8465 | 3.64e-04 | 1.82e-03 | 1.07e-03 | 40 |
| hsa0502224 | Cervix | HSIL_HPV | Pathways of neurodegeneration - multiple diseases | 46/459 | 476/8465 | 8.10e-05 | 1.08e-03 | 8.72e-04 | 46 |
| hsa0501024 | Cervix | HSIL_HPV | Alzheimer disease | 38/459 | 384/8465 | 2.13e-04 | 2.31e-03 | 1.86e-03 | 38 |
| hsa0502234 | Cervix | HSIL_HPV | Pathways of neurodegeneration - multiple diseases | 46/459 | 476/8465 | 8.10e-05 | 1.08e-03 | 8.72e-04 | 46 |
| hsa0501034 | Cervix | HSIL_HPV | Alzheimer disease | 38/459 | 384/8465 | 2.13e-04 | 2.31e-03 | 1.86e-03 | 38 |
| hsa05010 | Colorectum | AD | Alzheimer disease | 174/2092 | 384/8465 | 1.82e-19 | 9.26e-18 | 5.91e-18 | 174 |
| hsa05022 | Colorectum | AD | Pathways of neurodegeneration - multiple diseases | 201/2092 | 476/8465 | 4.54e-18 | 1.27e-16 | 8.09e-17 | 201 |
| hsa04310 | Colorectum | AD | Wnt signaling pathway | 56/2092 | 171/8465 | 1.03e-02 | 3.93e-02 | 2.51e-02 | 56 |
| hsa050101 | Colorectum | AD | Alzheimer disease | 174/2092 | 384/8465 | 1.82e-19 | 9.26e-18 | 5.91e-18 | 174 |
| hsa050221 | Colorectum | AD | Pathways of neurodegeneration - multiple diseases | 201/2092 | 476/8465 | 4.54e-18 | 1.27e-16 | 8.09e-17 | 201 |
| hsa043101 | Colorectum | AD | Wnt signaling pathway | 56/2092 | 171/8465 | 1.03e-02 | 3.93e-02 | 2.51e-02 | 56 |
| hsa050102 | Colorectum | SER | Alzheimer disease | 146/1580 | 384/8465 | 6.52e-20 | 2.40e-18 | 1.75e-18 | 146 |
| hsa050222 | Colorectum | SER | Pathways of neurodegeneration - multiple diseases | 168/1580 | 476/8465 | 6.23e-19 | 2.07e-17 | 1.50e-17 | 168 |
| hsa050103 | Colorectum | SER | Alzheimer disease | 146/1580 | 384/8465 | 6.52e-20 | 2.40e-18 | 1.75e-18 | 146 |
| hsa050223 | Colorectum | SER | Pathways of neurodegeneration - multiple diseases | 168/1580 | 476/8465 | 6.23e-19 | 2.07e-17 | 1.50e-17 | 168 |
| hsa050104 | Colorectum | MSS | Alzheimer disease | 169/1875 | 384/8465 | 1.21e-22 | 1.01e-20 | 6.21e-21 | 169 |
| hsa050224 | Colorectum | MSS | Pathways of neurodegeneration - multiple diseases | 192/1875 | 476/8465 | 2.79e-20 | 1.04e-18 | 6.36e-19 | 192 |
| hsa043102 | Colorectum | MSS | Wnt signaling pathway | 53/1875 | 171/8465 | 4.24e-03 | 1.86e-02 | 1.14e-02 | 53 |
| hsa04390 | Colorectum | MSS | Hippo signaling pathway | 48/1875 | 157/8465 | 8.32e-03 | 3.10e-02 | 1.90e-02 | 48 |
| Page: 1 2 3 4 5 |
Top |
Cell-cell communication analysis |
| Identification of potential cell-cell interactions between two cell types and their ligand-receptor pairs for different disease states |
| Ligand | Receptor | LRpair | Pathway | Tissue | Disease Stage |
| Page: 1 |
Top |
Single-cell gene regulatory network inference analysis |
| Find out the significant the regulons (TFs) and the target genes of each regulon across cell types for different disease states |
| TF | Cell Type | Tissue | Disease Stage | Target Gene | RSS | Regulon Activity |
| ∗The dot plots of a searched regulon are shown for all cell subpopulations in each disease state of each tissue based on the regulon specific score inferred using pySCENIC and by calculating the average expression. |
| Page: 1 |
Top |
Somatic mutation of malignant transformation related genes |
| Annotation of somatic variants for genes involved in malignant transformation |
| Hugo Symbol | Variant Class | Variant Classification | dbSNP RS | HGVSc | HGVSp | HGVSp Short | SWISSPROT | BIOTYPE | SIFT | PolyPhen | Tumor Sample Barcode | Tissue | Histology | Sex | Age | Stage | Therapy Types | Drugs | Outcome |
| CSNK1E | SNV | Missense_Mutation | novel | c.29G>T | p.Arg10Leu | p.R10L | P49674 | protein_coding | deleterious_low_confidence(0.01) | possibly_damaging(0.82) | TCGA-A7-A4SC-01 | Breast | breast invasive carcinoma | Female | <65 | I/II | Hormone Therapy | tamoxiphen | SD |
| CSNK1E | SNV | Missense_Mutation | c.874N>T | p.Met292Leu | p.M292L | P49674 | protein_coding | tolerated_low_confidence(0.25) | benign(0) | TCGA-AN-A0XU-01 | Breast | breast invasive carcinoma | Female | <65 | I/II | Unknown | Unknown | SD | |
| CSNK1E | SNV | Missense_Mutation | rs771808437 | c.821N>A | p.Arg274His | p.R274H | P49674 | protein_coding | deleterious_low_confidence(0) | probably_damaging(0.972) | TCGA-B6-A0RU-01 | Breast | breast invasive carcinoma | Female | <65 | I/II | Unknown | Unknown | PD |
| CSNK1E | SNV | Missense_Mutation | c.795C>G | p.Asp265Glu | p.D265E | P49674 | protein_coding | deleterious_low_confidence(0.01) | benign(0.043) | TCGA-D8-A1XK-01 | Breast | breast invasive carcinoma | Female | <65 | I/II | Chemotherapy | doxorubicine+cyclophosphamide | SD | |
| CSNK1E | SNV | Missense_Mutation | c.385N>A | p.Val129Ile | p.V129I | P49674 | protein_coding | tolerated_low_confidence(1) | benign(0.007) | TCGA-A6-3809-01 | Colorectum | colon adenocarcinoma | Female | >=65 | I/II | Unknown | Unknown | SD | |
| CSNK1E | SNV | Missense_Mutation | rs749796700 | c.1103N>T | p.Ser368Leu | p.S368L | P49674 | protein_coding | deleterious_low_confidence(0.04) | benign(0.079) | TCGA-AA-3492-01 | Colorectum | colon adenocarcinoma | Female | >=65 | I/II | Unknown | Unknown | SD |
| CSNK1E | SNV | Missense_Mutation | c.799T>G | p.Ser267Ala | p.S267A | P49674 | protein_coding | tolerated_low_confidence(0.27) | benign(0.014) | TCGA-AA-3715-01 | Colorectum | colon adenocarcinoma | Male | >=65 | I/II | Unknown | Unknown | PD | |
| CSNK1E | SNV | Missense_Mutation | c.379N>T | p.Arg127Trp | p.R127W | P49674 | protein_coding | deleterious_low_confidence(0) | probably_damaging(1) | TCGA-AA-3845-01 | Colorectum | colon adenocarcinoma | Female | >=65 | I/II | Unknown | Unknown | PD | |
| CSNK1E | SNV | Missense_Mutation | novel | c.158N>T | p.Ser53Ile | p.S53I | P49674 | protein_coding | deleterious_low_confidence(0) | probably_damaging(0.987) | TCGA-AA-A010-01 | Colorectum | colon adenocarcinoma | Female | <65 | I/II | Chemotherapy | folinic | CR |
| CSNK1E | SNV | Missense_Mutation | c.256N>T | p.Gly86Trp | p.G86W | P49674 | protein_coding | deleterious_low_confidence(0) | probably_damaging(1) | TCGA-AZ-6601-01 | Colorectum | colon adenocarcinoma | Male | >=65 | I/II | Unknown | Unknown | PD |
| Page: 1 2 3 4 5 6 |
Top |
Related drugs of malignant transformation related genes |
| Identification of chemicals and drugs interact with genes involved in malignant transfromation |
| (DGIdb 4.0) |
| Entrez ID | Symbol | Category | Interaction Types | Drug Claim Name | Drug Name | PMIDs |
| 1454 | CSNK1E | SERINE THREONINE KINASE, KINASE, ENZYME, DRUGGABLE GENOME, DNA REPAIR | inhibitor | 310264697 | UMBRALISIB | |
| 1454 | CSNK1E | SERINE THREONINE KINASE, KINASE, ENZYME, DRUGGABLE GENOME, DNA REPAIR | inhibitor | HTS-466284 | CHEMBL261454 | 19035792 |
| 1454 | CSNK1E | SERINE THREONINE KINASE, KINASE, ENZYME, DRUGGABLE GENOME, DNA REPAIR | inhibitor | 328083473 | CHEMBL1951415 | |
| 1454 | CSNK1E | SERINE THREONINE KINASE, KINASE, ENZYME, DRUGGABLE GENOME, DNA REPAIR | heroin | DIACETYLMORPHINE | ||
| 1454 | CSNK1E | SERINE THREONINE KINASE, KINASE, ENZYME, DRUGGABLE GENOME, DNA REPAIR | inhibitor | 249565730 | CHEMBL2069623 | |
| 1454 | CSNK1E | SERINE THREONINE KINASE, KINASE, ENZYME, DRUGGABLE GENOME, DNA REPAIR | SB-202190 | SB-202190 | 22951114 | |
| 1454 | CSNK1E | SERINE THREONINE KINASE, KINASE, ENZYME, DRUGGABLE GENOME, DNA REPAIR | inhibitor | 178102608 | IC261 |
| Page: 1 |

Copyright 2023-Present -The University of Texas Health Science Center at Houston |