Schematic overview of the cellular and molecular mechanisms involved in the cancer progression, including the proposed cellular and molecular mechanisms in cancer cells trajectory. AT1: alveolar type 1 cells; AT2: alveolar type 2 cells; AAH: atypical adenomatous hyperplasia; AIS: adenocarcinoma in situ; MIA: minimally invasive adenocarcinoma; IA: invasive adenocarcinoma; EMT: epithelial-mesenchymal transition

Home

Download

Statistics

Help

Contact

Center for Computational Systems Medicine
leaf

Gene summary

leaf

Malignant transformation analysis

leaf

Malignant transformation related pathway analysis

leaf

Cell-cell communication analysis

leaf

Single-cell gene regulatory network inference analysis

leaf

Somatic mutation of malignant transformation related genes

leaf

Related drugs of malignant transformation related genes

Gene: COL4A3BP

Gene summary for COL4A3BP

check button Gene summary.

Gene informationSpeciesHuman
Gene symbol

COL4A3BP

Gene ID

10087

Gene nameceramide transporter 1
Gene AliasCERT
Cytomap5q13.3
Gene Typeprotein-coding
GO ID

GO:0000902

UniProtAcc

Q9Y5P4


Top

Malignant transformation analysis

check button Identification of the aberrant gene expression in precancerous and cancerous lesions by comparing the gene expression of stem-like cells in diseased tissues with normal stem cells
check button Malignant transformation involving gene list.
Entrez IDSymbolReplicatesSpeciesOrganTissueAdj P-valueLog2FCMalignancy
10087COL4A3BPSYSMH1HumanOral cavityOSCC5.36e-051.71e-010.1127
10087COL4A3BPSYSMH2HumanOral cavityOSCC5.63e-073.09e-010.2326
10087COL4A3BPSYSMH3HumanOral cavityOSCC2.13e-255.54e-010.2442
10087COL4A3BPSYSMH6HumanOral cavityOSCC1.04e-092.66e-010.1275
10087COL4A3BPDong_P1HumanProstateTumor2.42e-068.10e-020.035
10087COL4A3BPDong_P3HumanProstateTumor7.74e-081.08e-010.0278
10087COL4A3BPDong_P4HumanProstateTumor1.37e-051.67e-010.0292
10087COL4A3BPDong_P5HumanProstateTumor7.51e-151.16e-010.053
10087COL4A3BPP7HumanProstateTumor5.82e-114.08e-01-0.1025
10087COL4A3BPP10HumanProstateTumor3.40e-031.44e-01-0.0902
10087COL4A3BPGSM5353215_PA_AUG_PB_1B_S2HumanProstateTumor4.40e-034.87e-010.1557
10087COL4A3BPGSM5353216_PA_PB1A_Pool_1_3_S50_L002HumanProstateTumor2.22e-035.10e-010.159
10087COL4A3BPGSM5353217_PA_PB1A_Pool_2_S107_L004HumanProstateTumor3.83e-036.09e-010.156
10087COL4A3BPGSM5353218_PA_PB1B_Pool_1_2_S74_L003HumanProstateTumor1.55e-024.09e-010.1479
10087COL4A3BPGSM5353221_PA_PB2A_Pool_1_3_S25_L001HumanProstateTumor3.61e-206.53e-010.1633
10087COL4A3BPGSM5353222_PA_PB2B_Pool_1_3_S52_L002HumanProstateTumor2.73e-185.62e-010.1608
10087COL4A3BPGSM5353223_PA_PB2B_Pool_2_S26_L001HumanProstateTumor7.31e-186.34e-010.1604
10087COL4A3BPGSM5353224_PA_PR5186_Pool_1_2_3_S27_L001HumanProstateTumor2.75e-155.44e-010.1621
10087COL4A3BPGSM5353226_PA_PR5196-2_Pool_1_2_3_S54_L002HumanProstateTumor6.72e-085.75e-010.159
10087COL4A3BPGSM5353227_PA_PR5199-193K_Pool_1_2_3_S55_L002HumanProstateTumor1.73e-084.70e-010.1602
Page: 1 2 3 4 5 6 7 8 9 

check button Transcriptomic changes along malignancy continuum.
TissueExpression DynamicsAbbreviation
Colorectum (GSE201348)The image shows the transcriptomic changes along malignancy continuum.log2FC in expression of this searched gene in stem-like cells from each diseased tissue sample relative to stem-like cells in normal samples in each tissue plotted against the malignancy continuum. Samples are colored based on if they are from different disease stage.FAP: Familial adenomatous polyposis
CRC: Colorectal cancer
Colorectum (HTA11)The image shows the transcriptomic changes along malignancy continuum.log2FC in expression of this searched gene in stem-like cells from each diseased tissue sample relative to stem-like cells in normal samples in each tissue plotted against the malignancy continuum. Samples are colored based on if they are from different disease stage.AD: Adenomas
SER: Sessile serrated lesions
MSI-H: Microsatellite-high colorectal cancer
MSS: Microsatellite stable colorectal cancer
EsophagusThe image shows the transcriptomic changes along malignancy continuum.log2FC in expression of this searched gene in stem-like cells from each diseased tissue sample relative to stem-like cells in normal samples in each tissue plotted against the malignancy continuum. Samples are colored based on if they are from different disease stage.
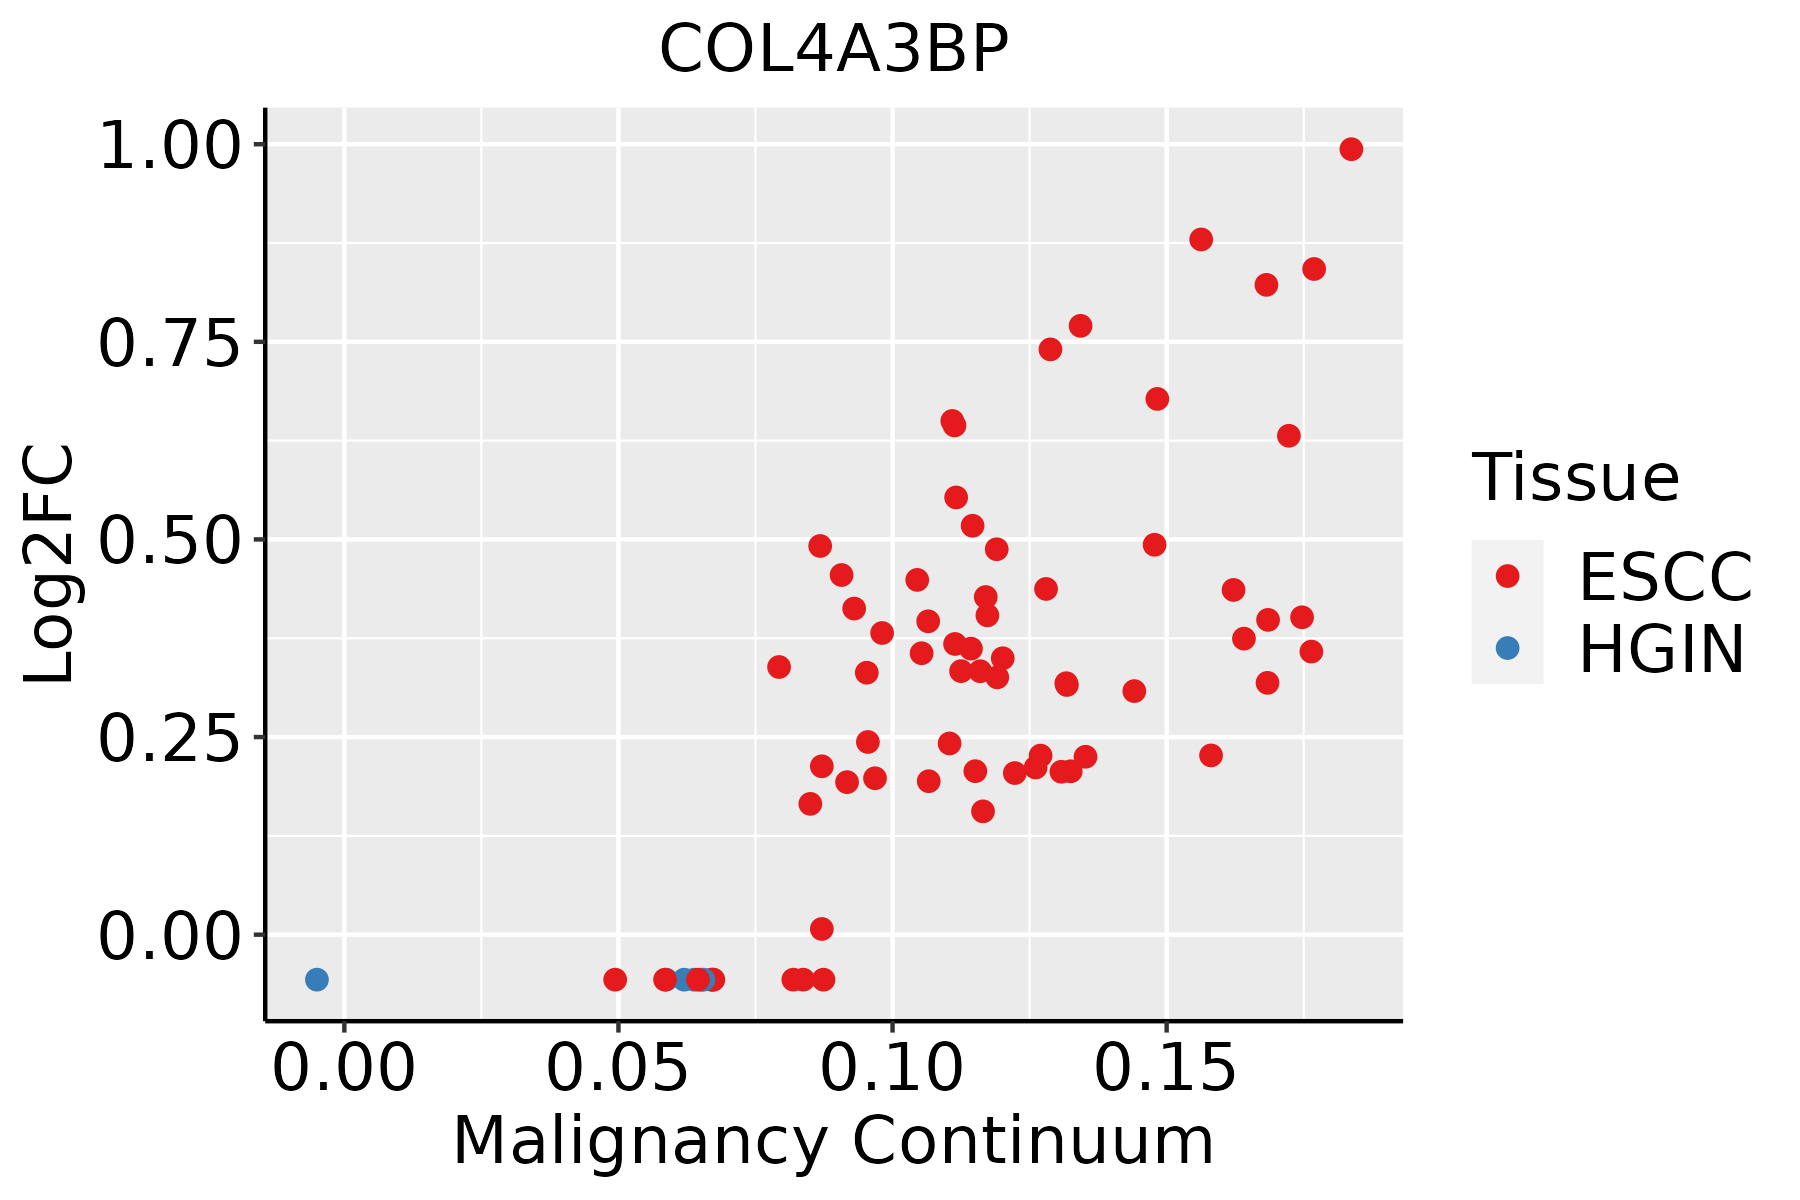
ESCC: Esophageal squamous cell carcinoma
HGIN: High-grade intraepithelial neoplasias
LGIN: Low-grade intraepithelial neoplasias
LiverThe image shows the transcriptomic changes along malignancy continuum.log2FC in expression of this searched gene in stem-like cells from each diseased tissue sample relative to stem-like cells in normal samples in each tissue plotted against the malignancy continuum. Samples are colored based on if they are from different disease stage.
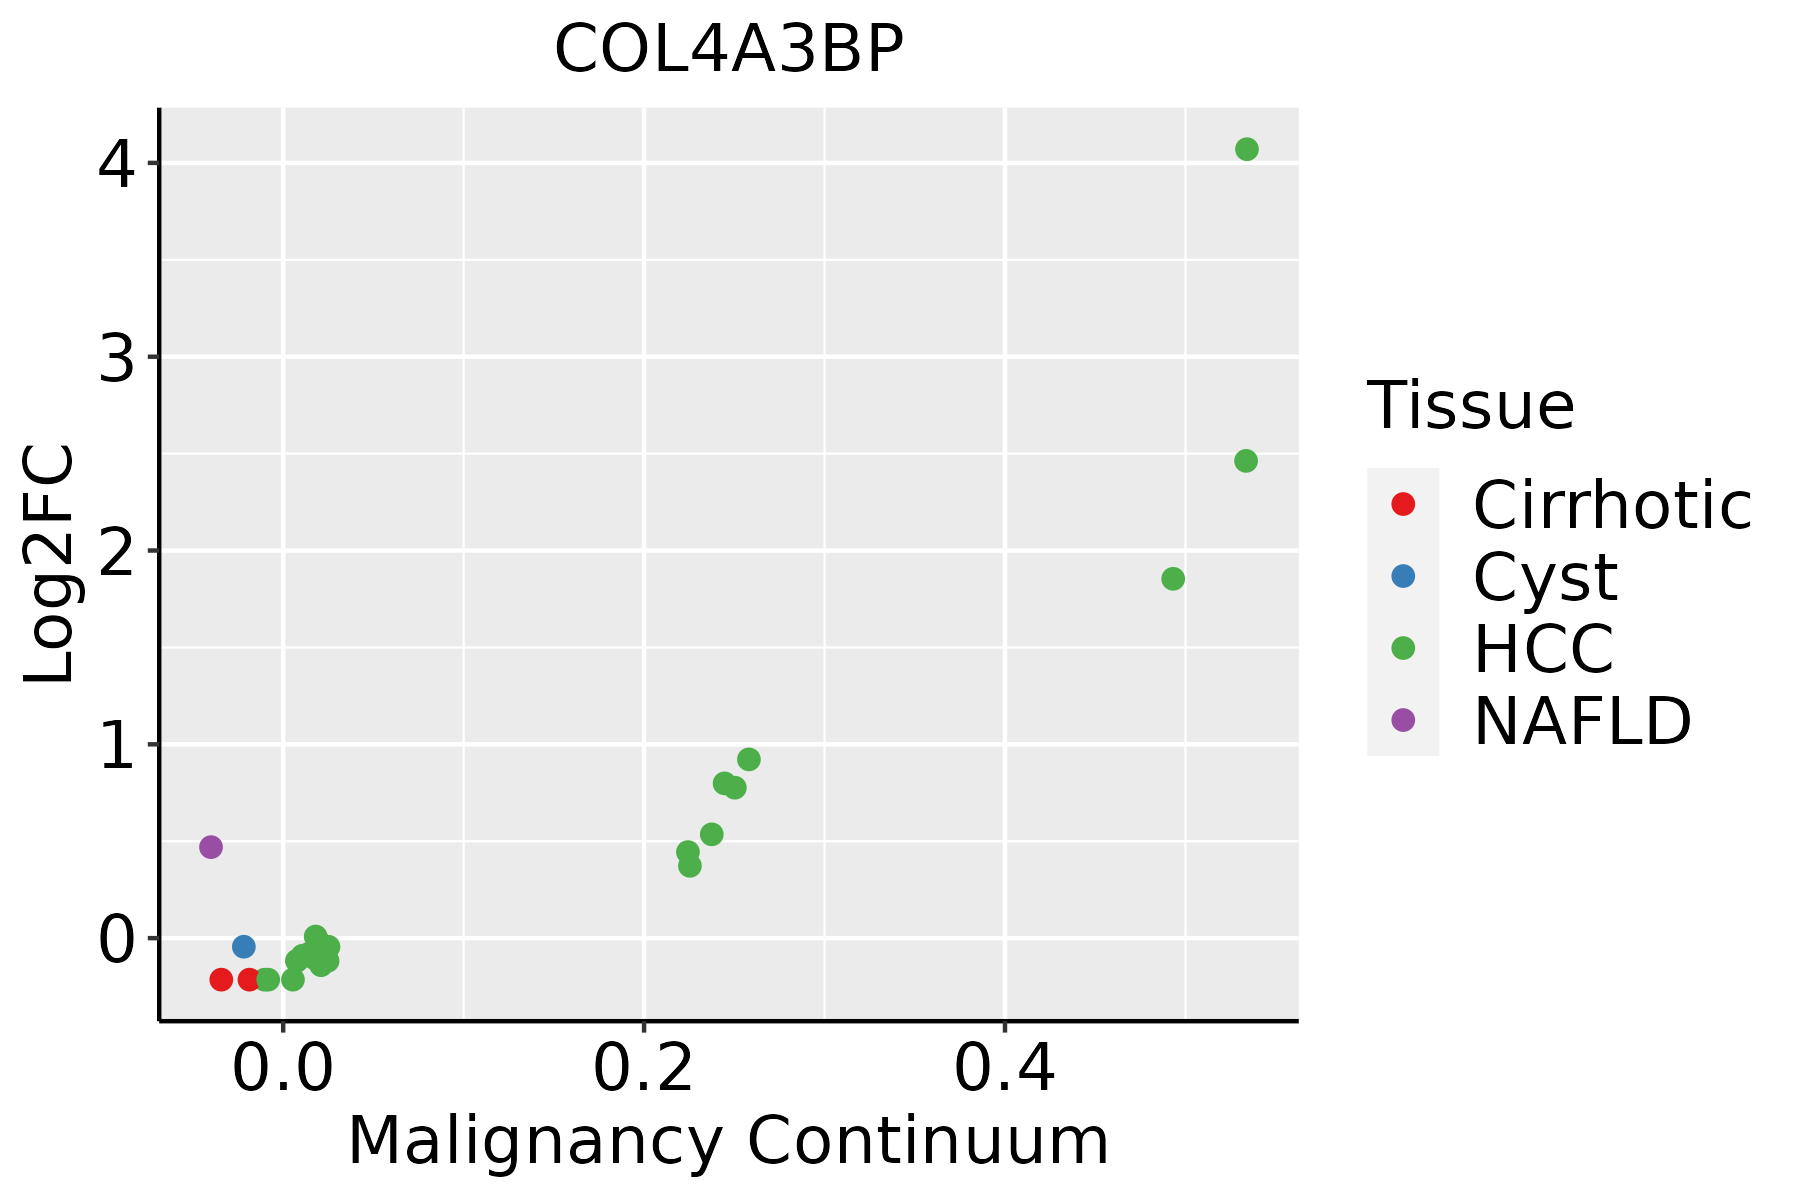
HCC: Hepatocellular carcinoma
NAFLD: Non-alcoholic fatty liver disease
Oral CavityThe image shows the transcriptomic changes along malignancy continuum.log2FC in expression of this searched gene in stem-like cells from each diseased tissue sample relative to stem-like cells in normal samples in each tissue plotted against the malignancy continuum. Samples are colored based on if they are from different disease stage.
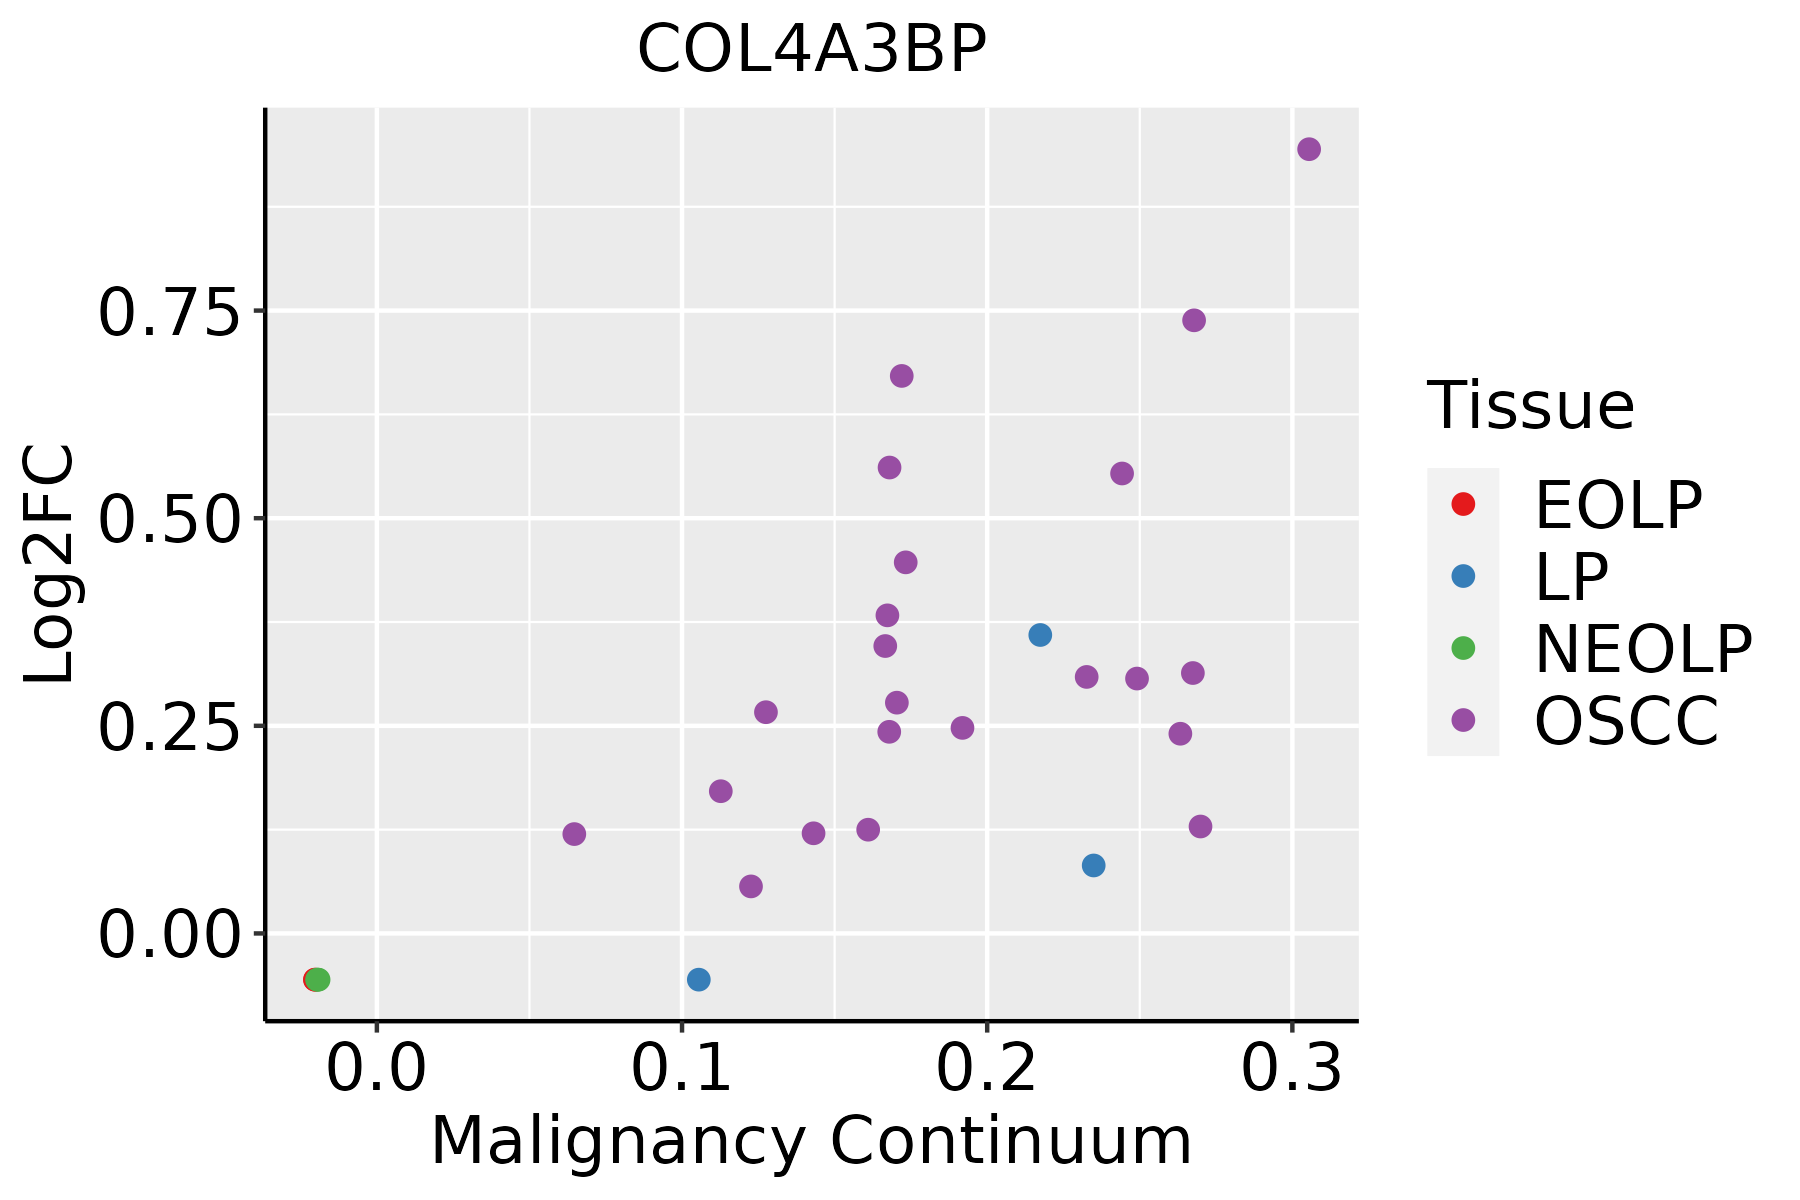
EOLP: Erosive Oral lichen planus
LP: leukoplakia
NEOLP: Non-erosive oral lichen planus
OSCC: Oral squamous cell carcinoma
ProstateThe image shows the transcriptomic changes along malignancy continuum.log2FC in expression of this searched gene in stem-like cells from each diseased tissue sample relative to stem-like cells in normal samples in each tissue plotted against the malignancy continuum. Samples are colored based on if they are from different disease stage.
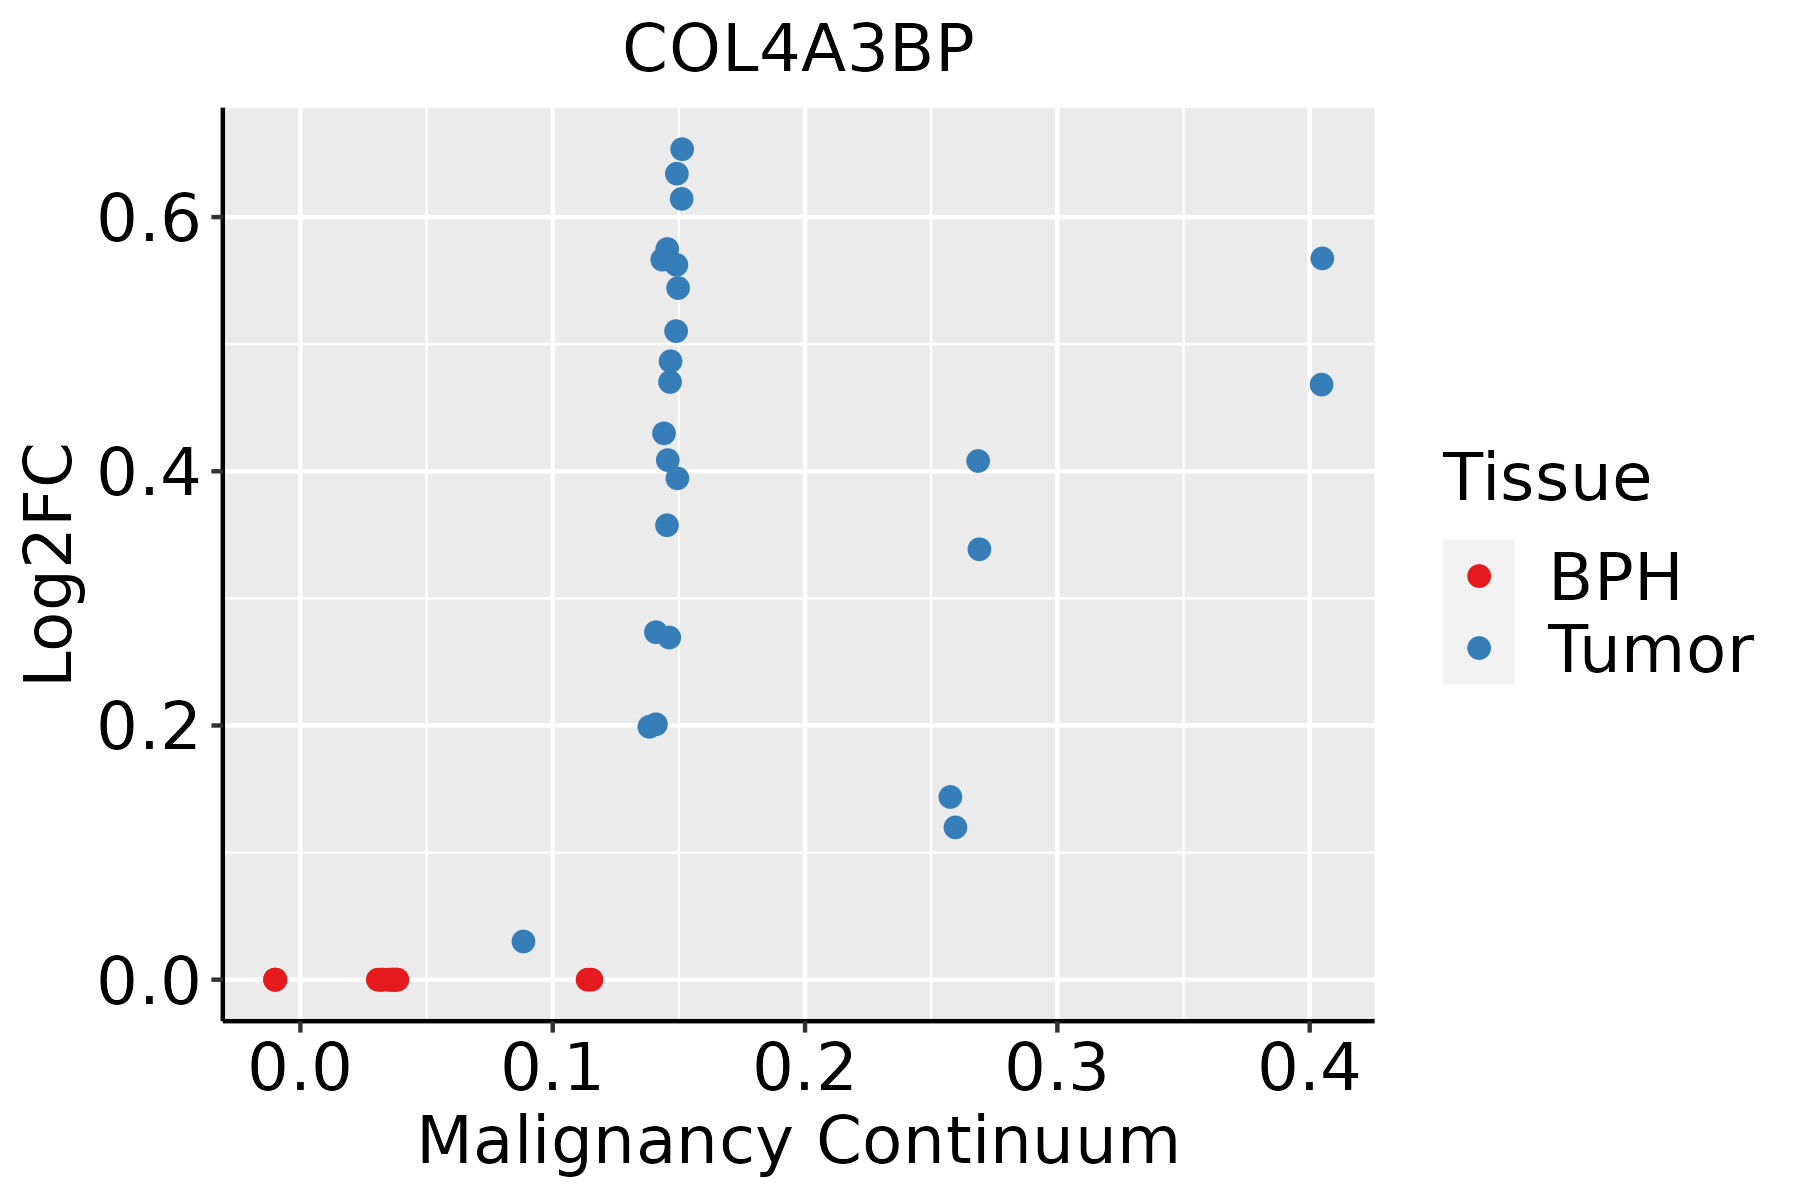
BPH: Benign Prostatic Hyperplasia
ThyroidThe image shows the transcriptomic changes along malignancy continuum.log2FC in expression of this searched gene in stem-like cells from each diseased tissue sample relative to stem-like cells in normal samples in each tissue plotted against the malignancy continuum. Samples are colored based on if they are from different disease stage.ATC: Anaplastic thyroid cancer
HT: Hashimoto's thyroiditis
PTC: Papillary thyroid cancer
∗log2FC in expression of this searched gene in stem-like cells from each diseased tissue sample relative to stem-like cells in normal samples in each tissue plotted against the malignancy continuum. Samples are colored based on if they are from different disease stage.

Top

Malignant transformation related pathway analysis

check buttonFind out the enriched GO biological processes and KEGG pathways involved in transition from healthy to precancer to cancer
check button Figure of enriched GO biological processes.
TissueDisease StageEnriched GO biological Processes
ColorectumADGO analysis - Figure of enriched GO biological processes: Top 15 enriched GO BP terms are showed in the bar plot of each disease state in each tissue. Each row represents a significant GO biological process which is colored according to the -log10(p.adjust).
ColorectumSERGO analysis - Figure of enriched GO biological processes: Top 15 enriched GO BP terms are showed in the bar plot of each disease state in each tissue. Each row represents a significant GO biological process which is colored according to the -log10(p.adjust).
ColorectumMSSGO analysis - Figure of enriched GO biological processes: Top 15 enriched GO BP terms are showed in the bar plot of each disease state in each tissue. Each row represents a significant GO biological process which is colored according to the -log10(p.adjust).
ColorectumMSI-HGO analysis - Figure of enriched GO biological processes: Top 15 enriched GO BP terms are showed in the bar plot of each disease state in each tissue. Each row represents a significant GO biological process which is colored according to the -log10(p.adjust).
ColorectumFAPGO analysis - Figure of enriched GO biological processes: Top 15 enriched GO BP terms are showed in the bar plot of each disease state in each tissue. Each row represents a significant GO biological process which is colored according to the -log10(p.adjust).
∗Top 15 enriched GO BP terms are showed in the bar plot of each disease state in each tissue. Each row represents a significant GO biological process which is colored according to the -log10(p.adjust).
Page: 1 2 3 4 5 6 7 8 9 

check button Enriched GO biological processes.
GO IDTissueDisease StageDescriptionGene RatioBg Ratiopvaluep.adjustCount
Page: 1 

check button Enriched KEGG pathways.
Pathway IDTissueDisease StageDescriptionGene RatioBg Ratiopvaluep.adjustqvalueCount
Page: 1 

Top

Cell-cell communication analysis

check buttonIdentification of potential cell-cell interactions between two cell types and their ligand-receptor pairs for different disease states
LigandReceptorLRpairPathwayTissueDisease Stage
Page: 1 

Top

Single-cell gene regulatory network inference analysis

check buttonFind out the significant the regulons (TFs) and the target genes of each regulon across cell types for different disease states
TFCell TypeTissueDisease StageTarget GeneRSSRegulon Activity
∗The dot plots of a searched regulon are shown for all cell subpopulations in each disease state of each tissue based on the regulon specific score inferred using pySCENIC and by calculating the average expression.
Page: 1 

Top

Somatic mutation of malignant transformation related genes

check buttonAnnotation of somatic variants for genes involved in malignant transformation
Hugo SymbolVariant ClassVariant ClassificationdbSNP RSHGVScHGVSpHGVSp ShortSWISSPROTBIOTYPESIFTPolyPhenTumor Sample BarcodeTissueHistologySexAgeStageTherapy TypesDrugsOutcome
COL4A3BPSNVMissense_Mutationc.1355N>Gp.Asp452Glyp.D452GQ9Y5P4protein_codingdeleterious(0)probably_damaging(0.999)TCGA-A8-A09Z-01Breastbreast invasive carcinomaFemale>=65I/IIUnknownUnknownSD
COL4A3BPSNVMissense_Mutationrs751943626c.2012N>Ap.Arg671Glnp.R671QQ9Y5P4protein_codingtolerated(0.06)possibly_damaging(0.54)TCGA-AN-A046-01Breastbreast invasive carcinomaFemale>=65I/IIUnknownUnknownSD
COL4A3BPSNVMissense_Mutationnovelc.1905N>Tp.Leu635Phep.L635FQ9Y5P4protein_codingdeleterious(0)probably_damaging(0.989)TCGA-S3-AA14-01Breastbreast invasive carcinomaFemale<65I/IIChemotherapyadriamycinCR
COL4A3BPinsertionFrame_Shift_Insnovelc.565_566insAp.Thr189AsnfsTer12p.T189Nfs*12Q9Y5P4protein_codingTCGA-E2-A2P6-01Breastbreast invasive carcinomaFemale>=65I/IIHormone TherapyanastrozoleSD
COL4A3BPdeletionFrame_Shift_Delnovelc.80delNp.Ser27ThrfsTer5p.S27Tfs*5Q9Y5P4protein_codingTCGA-EW-A2FV-01Breastbreast invasive carcinomaFemale<65III/IVChemotherapydocetaxelSD
COL4A3BPSNVMissense_Mutationnovelc.70A>Gp.Thr24Alap.T24AQ9Y5P4protein_codingtolerated_low_confidence(0.27)benign(0)TCGA-2W-A8YY-01Cervixcervical & endocervical cancerFemale<65I/IIChemotherapycisplatinCR
COL4A3BPSNVMissense_Mutationnovelc.1679N>Cp.Arg560Thrp.R560TQ9Y5P4protein_codingdeleterious(0)possibly_damaging(0.841)TCGA-C5-A1MF-01Cervixcervical & endocervical cancerFemale<65I/IIUnknownUnknownSD
COL4A3BPSNVMissense_Mutationc.784G>Tp.Val262Leup.V262LQ9Y5P4protein_codingtolerated(0.66)benign(0.006)TCGA-MY-A5BD-01Cervixcervical & endocervical cancerFemale<65I/IIChemotherapycisplatinCR
COL4A3BPSNVMissense_Mutationnovelc.1840N>Ap.Asp614Asnp.D614NQ9Y5P4protein_codingtolerated(0.13)possibly_damaging(0.479)TCGA-VS-A8QM-01Cervixcervical & endocervical cancerFemale<65I/IIChemotherapycisplatinPD
COL4A3BPdeletionFrame_Shift_Delnovelc.1287delAp.Lys429AsnfsTer16p.K429Nfs*16Q9Y5P4protein_codingTCGA-EA-A410-01Cervixcervical & endocervical cancerFemale<65I/IIUnknownUnknownSD
Page: 1 2 3 4 5 6 7 

Top

Related drugs of malignant transformation related genes

check buttonIdentification of chemicals and drugs interact with genes involved in malignant transfromation
(DGIdb 4.0)
Entrez IDSymbolCategoryInteraction TypesDrug Claim NameDrug NamePMIDs
Page: 1