
|
|||||
|
 | |
| |
| |
| |
| |
| |
|
Gene: BCAM |
Gene summary for BCAM |
| Gene information | Species | Human | Gene symbol | BCAM | Gene ID | 4059 |
| Gene name | basal cell adhesion molecule (Lutheran blood group) | |
| Gene Alias | AU | |
| Cytomap | 19q13.32 | |
| Gene Type | protein-coding | GO ID | GO:0007154 | UniProtAcc | A0A087WXM8 |
Top |
Malignant transformation analysis |
| Identification of the aberrant gene expression in precancerous and cancerous lesions by comparing the gene expression of stem-like cells in diseased tissues with normal stem cells |
| Entrez ID | Symbol | Replicates | Species | Organ | Tissue | Adj P-value | Log2FC | Malignancy |
| 4059 | BCAM | PTC01 | Human | Thyroid | PTC | 1.05e-48 | 1.49e+00 | 0.1899 |
| 4059 | BCAM | PTC03 | Human | Thyroid | PTC | 3.05e-02 | 5.45e-01 | 0.1784 |
| 4059 | BCAM | PTC04 | Human | Thyroid | PTC | 1.33e-18 | 8.68e-01 | 0.1927 |
| 4059 | BCAM | PTC05 | Human | Thyroid | PTC | 4.43e-21 | 1.34e+00 | 0.2065 |
| 4059 | BCAM | PTC06 | Human | Thyroid | PTC | 4.30e-40 | 1.42e+00 | 0.2057 |
| 4059 | BCAM | PTC07 | Human | Thyroid | PTC | 2.47e-73 | 1.73e+00 | 0.2044 |
| 4059 | BCAM | ATC11 | Human | Thyroid | ATC | 4.94e-03 | 4.86e-01 | 0.3386 |
| 4059 | BCAM | ATC12 | Human | Thyroid | ATC | 1.43e-04 | -2.20e-01 | 0.34 |
| 4059 | BCAM | ATC13 | Human | Thyroid | ATC | 3.61e-15 | -1.77e-01 | 0.34 |
| 4059 | BCAM | ATC3 | Human | Thyroid | ATC | 5.38e-03 | 2.81e-01 | 0.338 |
| 4059 | BCAM | ATC4 | Human | Thyroid | ATC | 7.73e-05 | -2.12e-01 | 0.34 |
| 4059 | BCAM | ATC5 | Human | Thyroid | ATC | 8.61e-06 | -1.70e-01 | 0.34 |
| Page: 1 2 3 4 5 6 7 8 |
| Tissue | Expression Dynamics | Abbreviation |
| Breast | 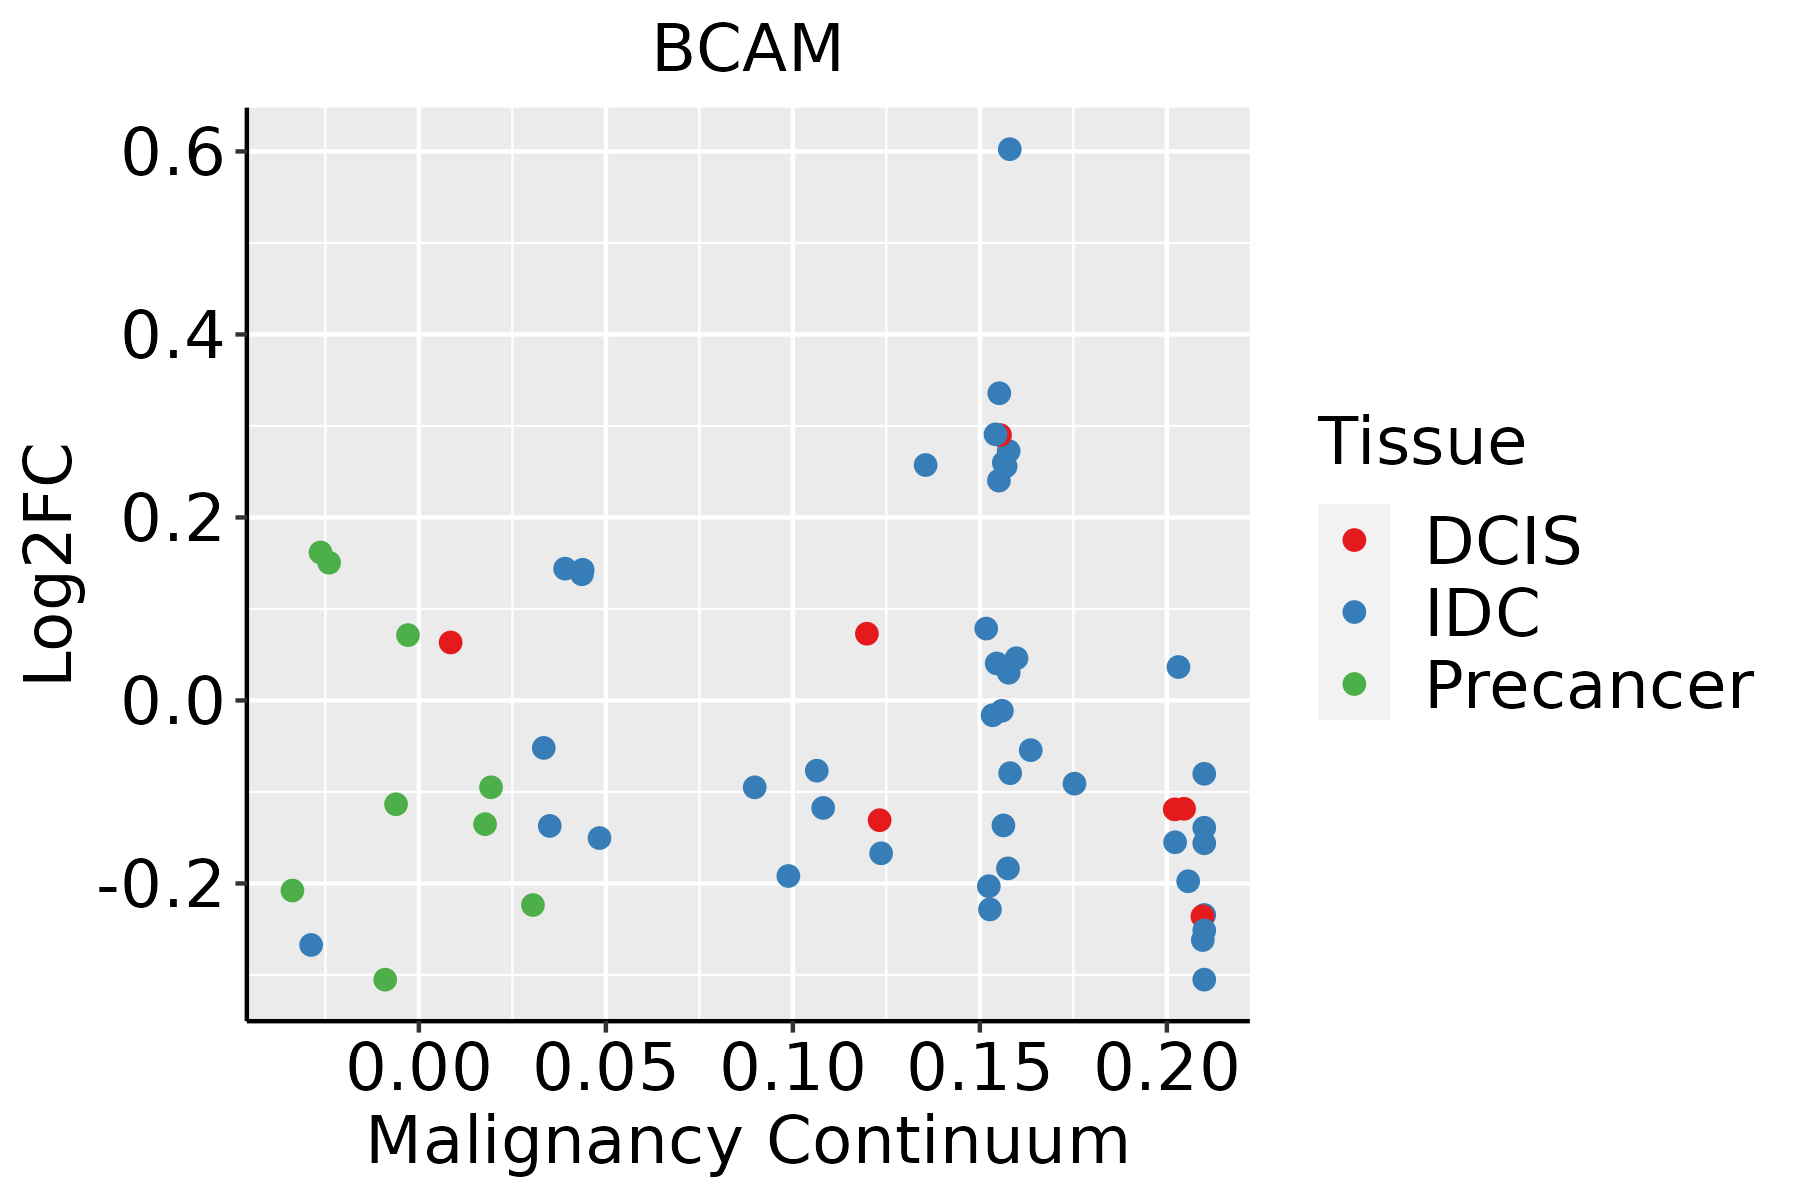 | IDC: Invasive ductal carcinoma |
| DCIS: Ductal carcinoma in situ | ||
| Precancer(BRCA1-mut): Precancerous lesion from BRCA1 mutation carriers | ||
| Esophagus | 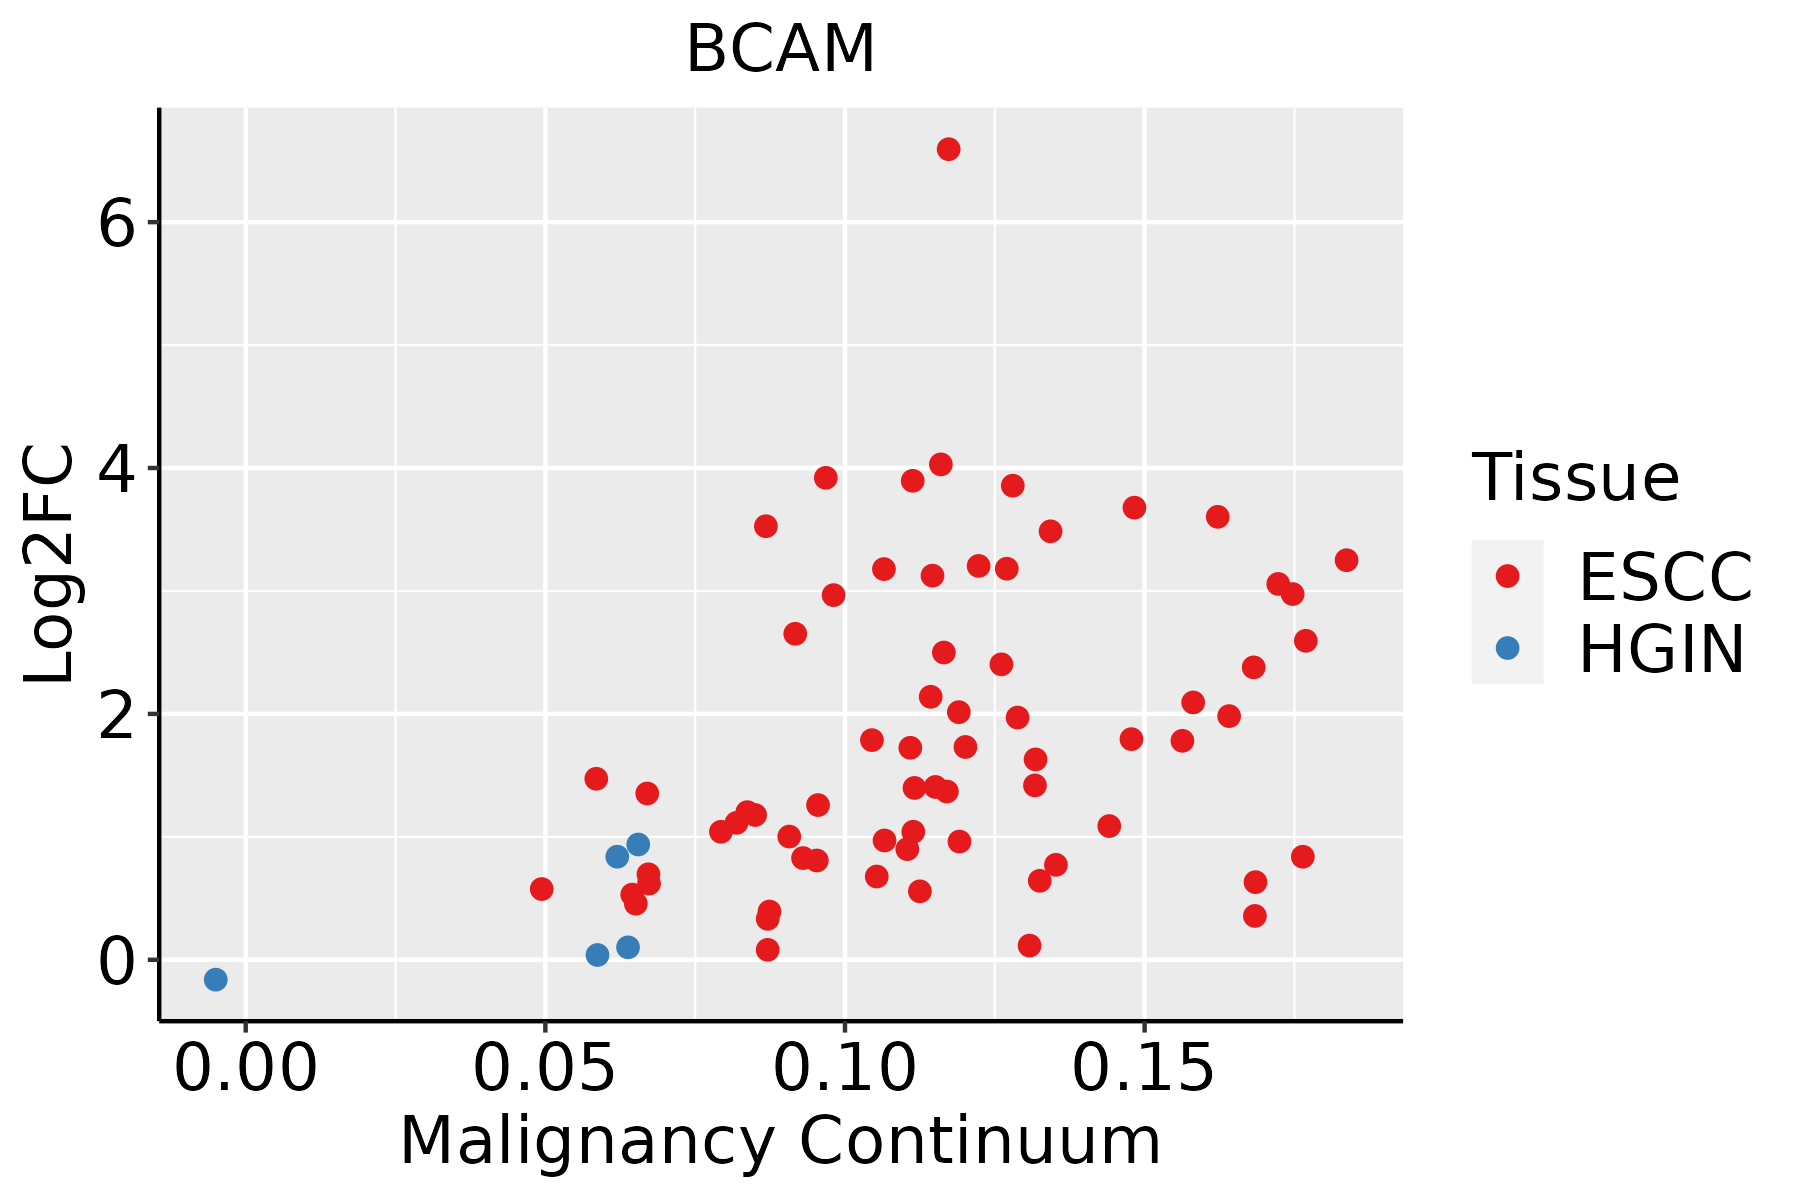 | ESCC: Esophageal squamous cell carcinoma |
| HGIN: High-grade intraepithelial neoplasias | ||
| LGIN: Low-grade intraepithelial neoplasias | ||
| Liver | 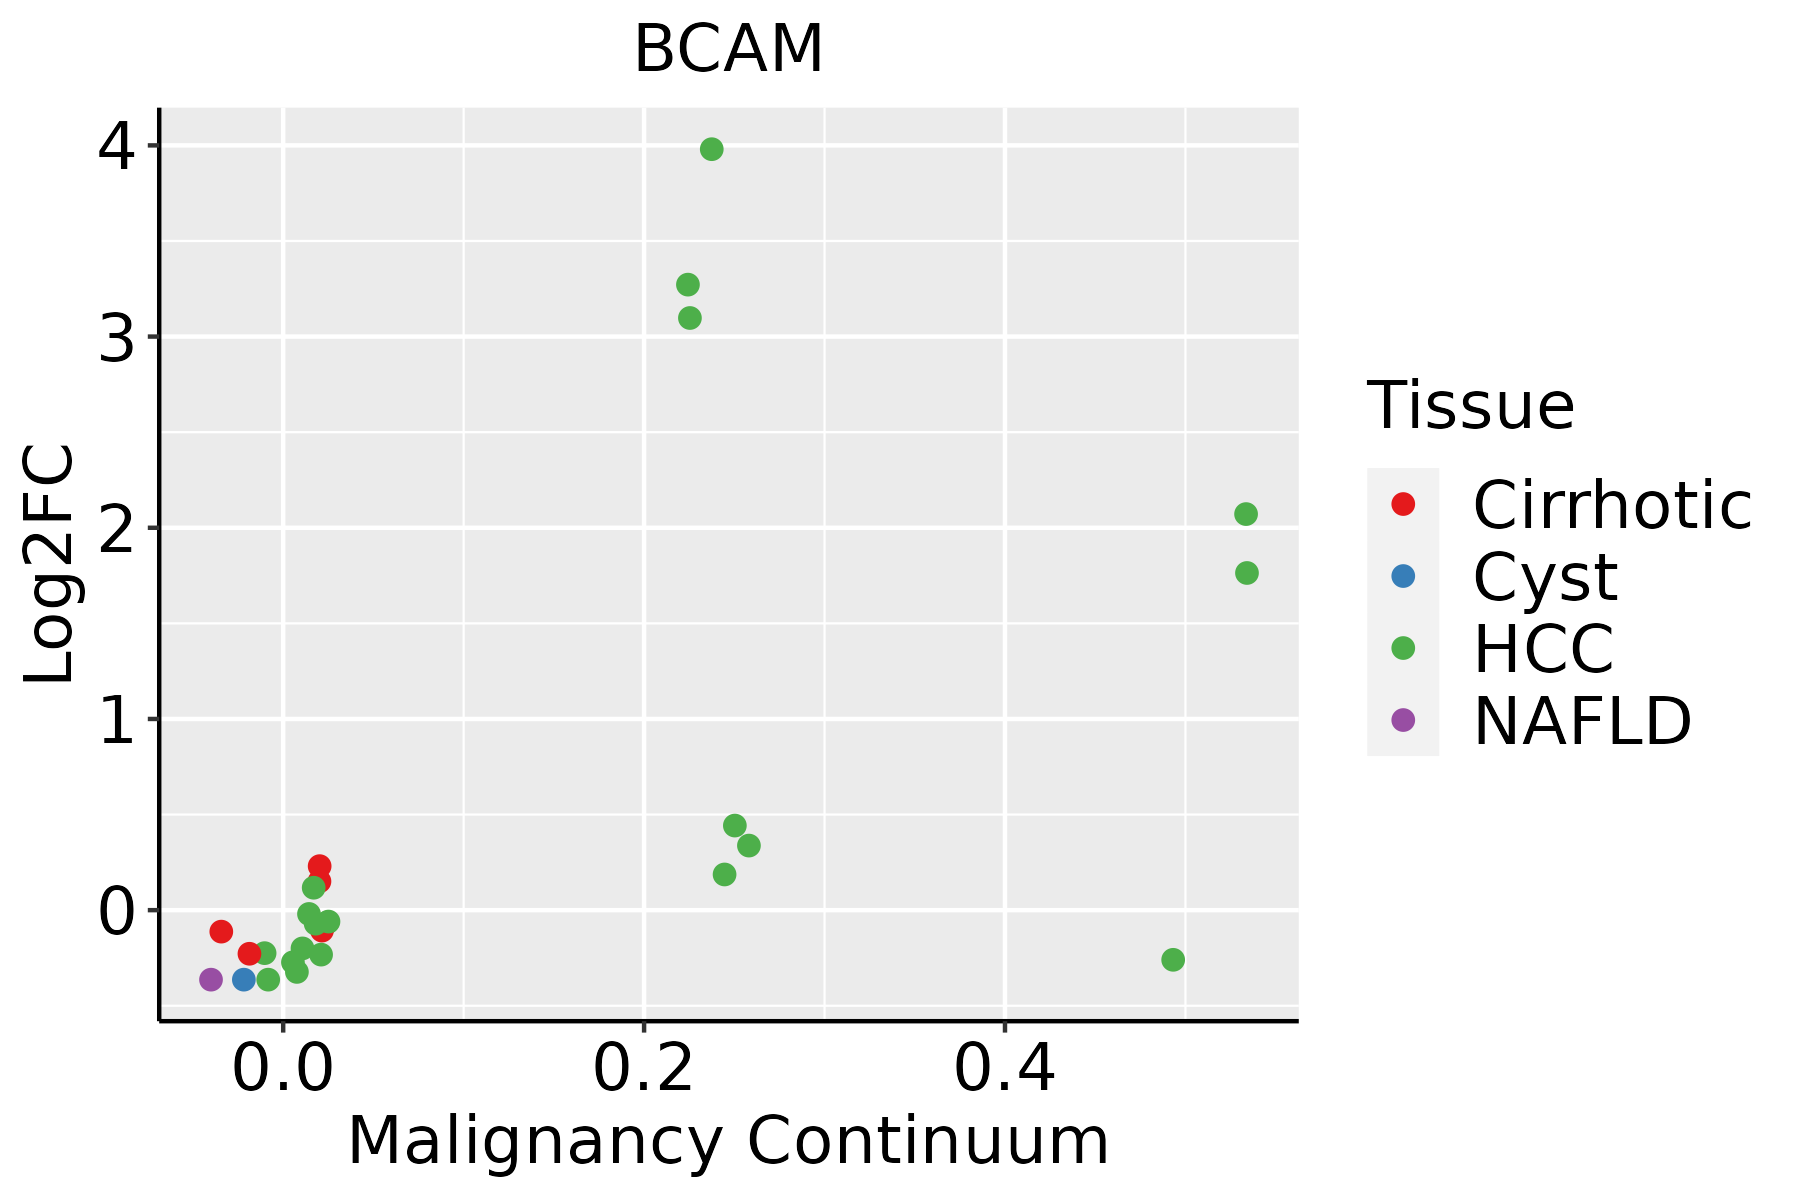 | HCC: Hepatocellular carcinoma |
| NAFLD: Non-alcoholic fatty liver disease | ||
| Lung | 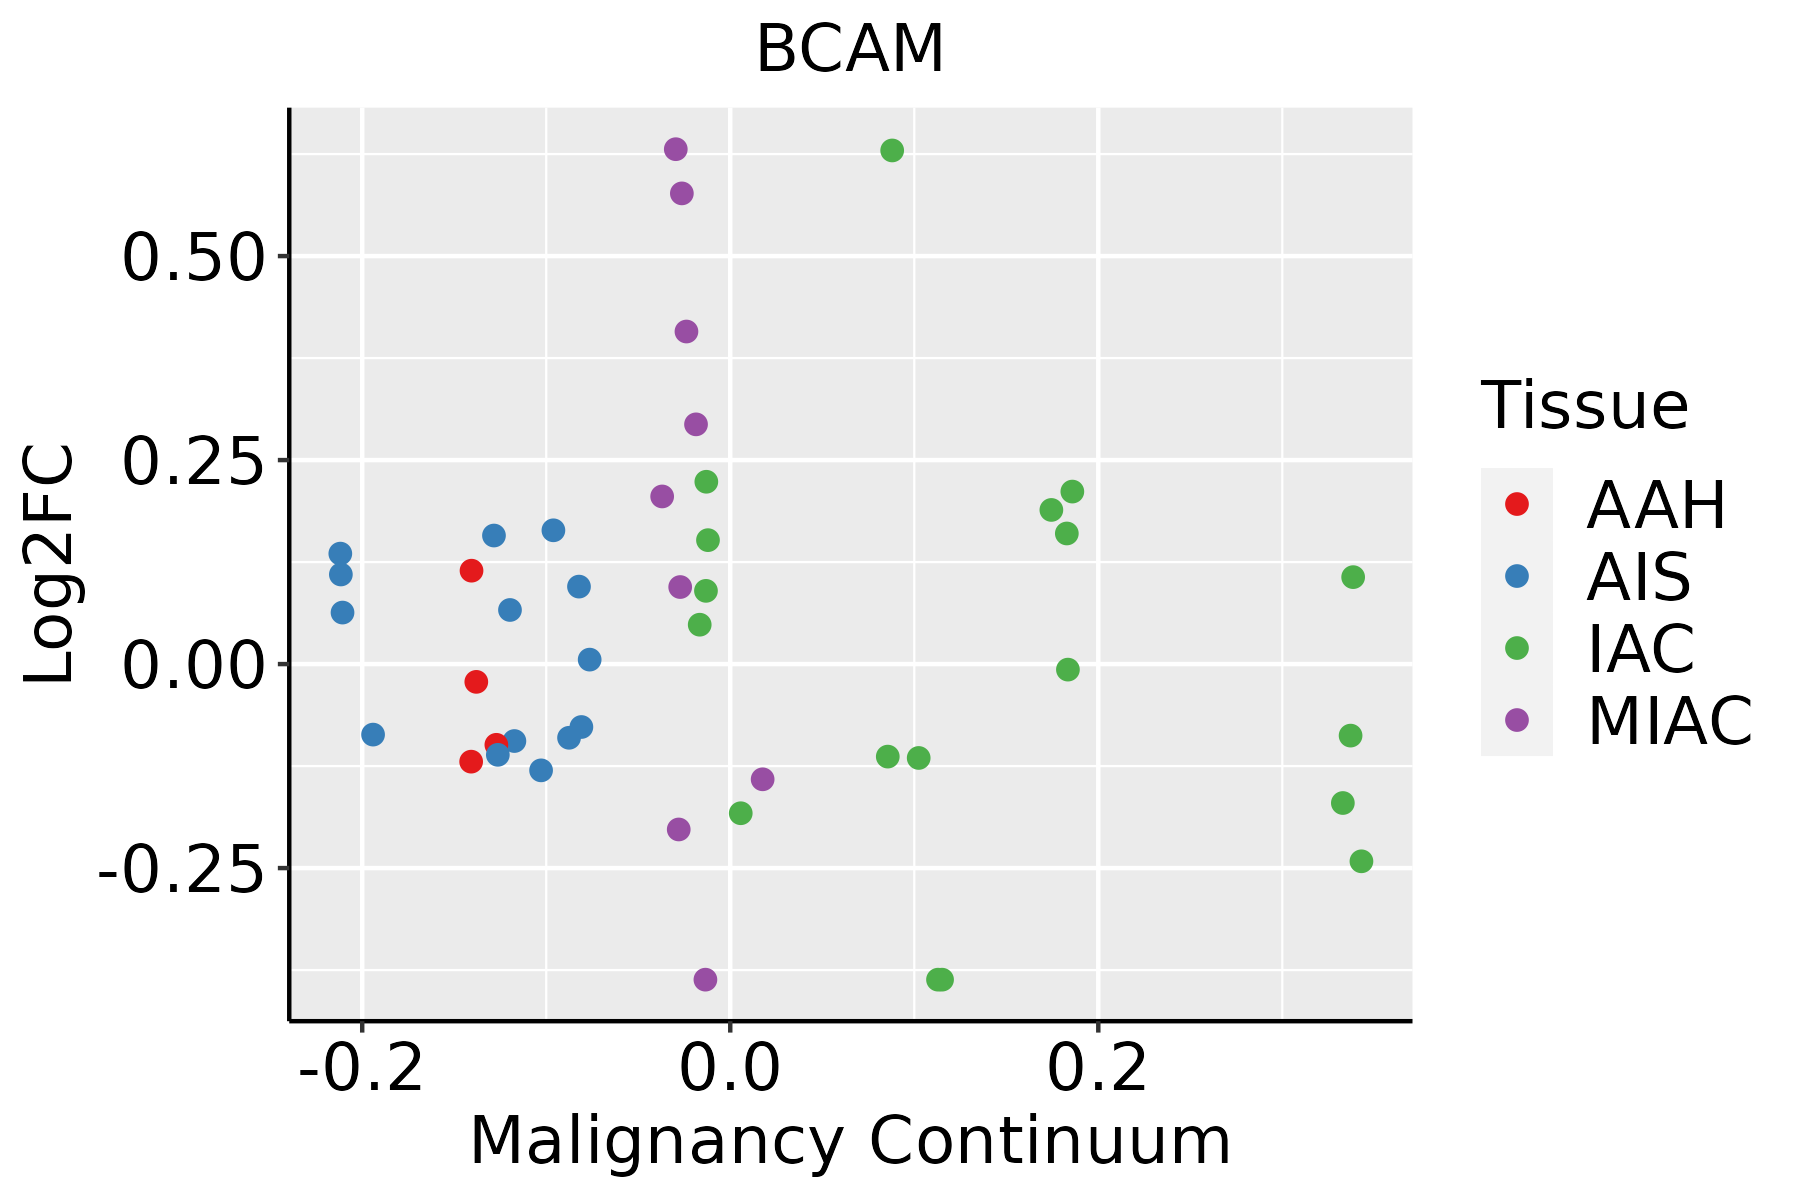 | AAH: Atypical adenomatous hyperplasia |
| AIS: Adenocarcinoma in situ | ||
| IAC: Invasive lung adenocarcinoma | ||
| MIA: Minimally invasive adenocarcinoma | ||
| Oral Cavity | 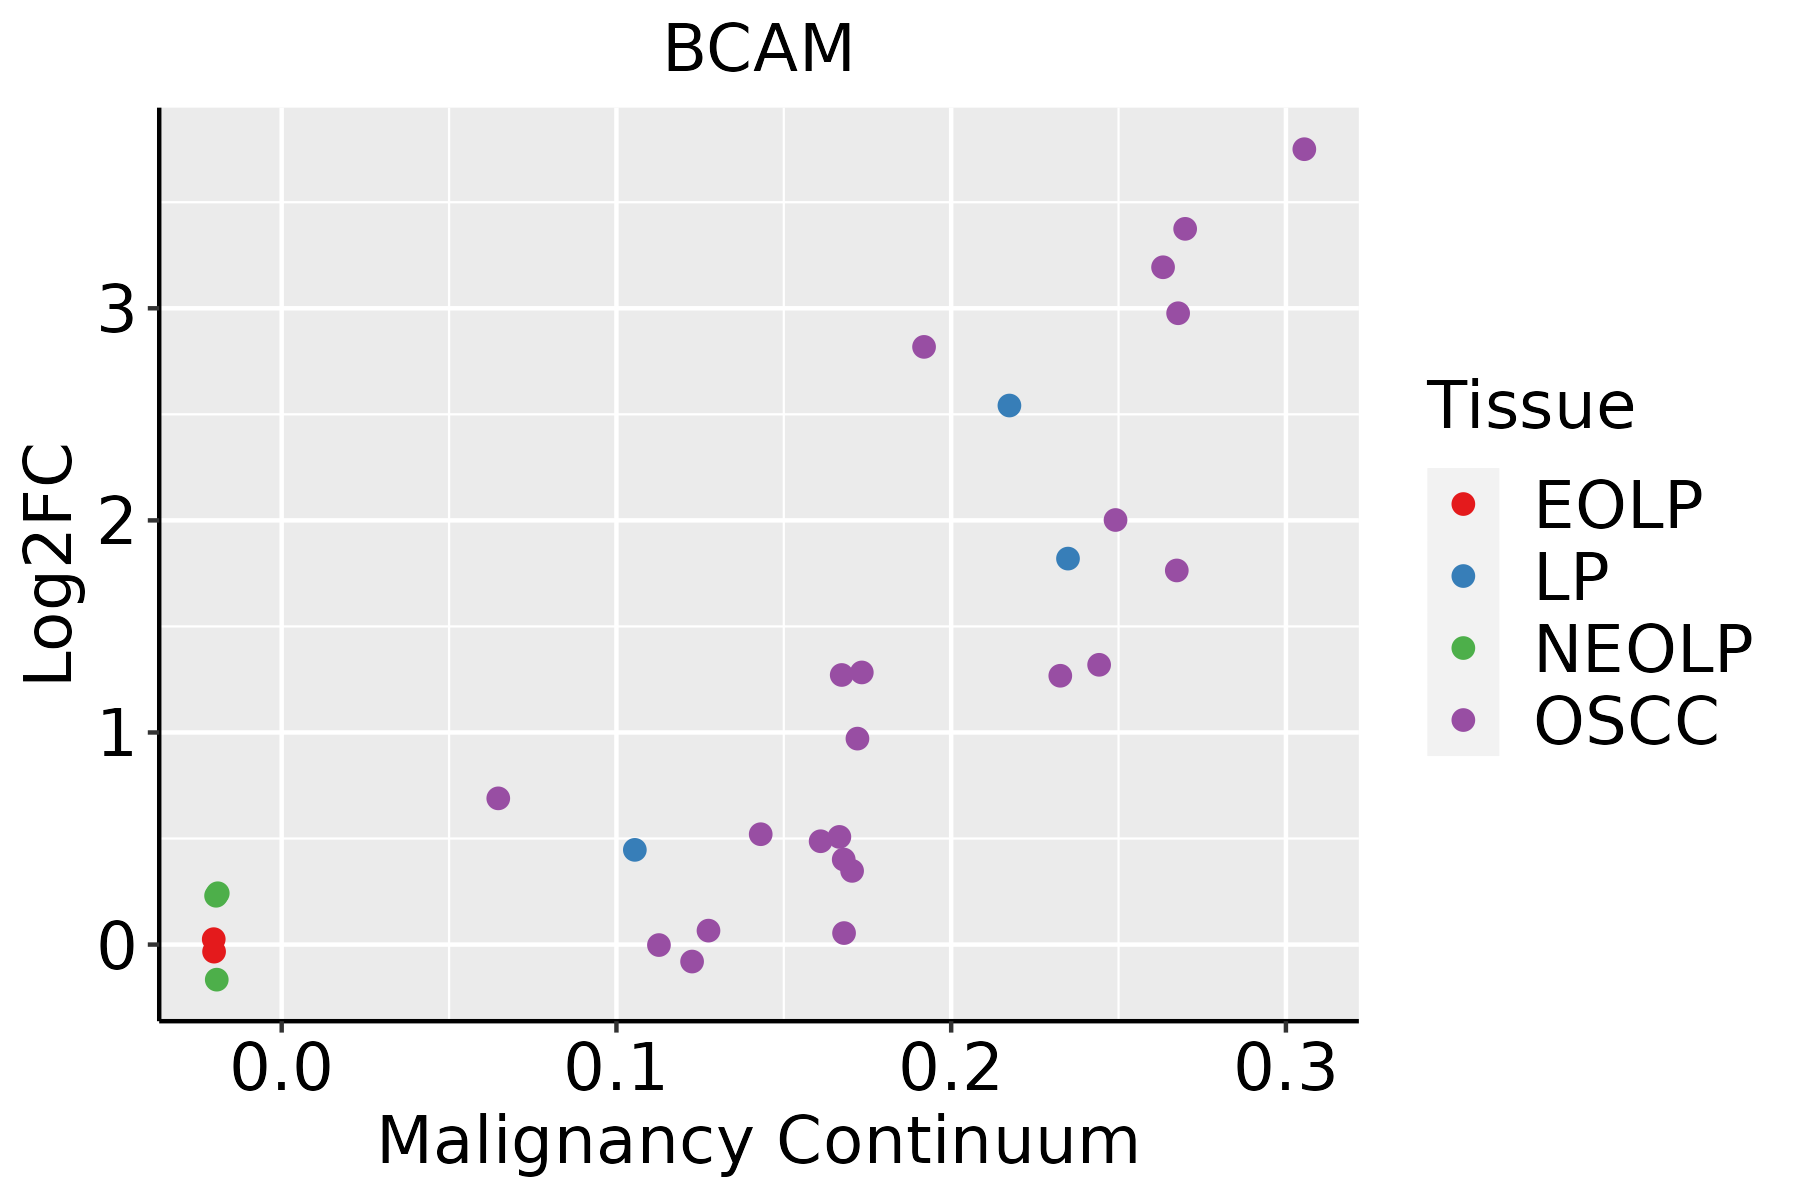 | EOLP: Erosive Oral lichen planus |
| LP: leukoplakia | ||
| NEOLP: Non-erosive oral lichen planus | ||
| OSCC: Oral squamous cell carcinoma | ||
| Prostate | 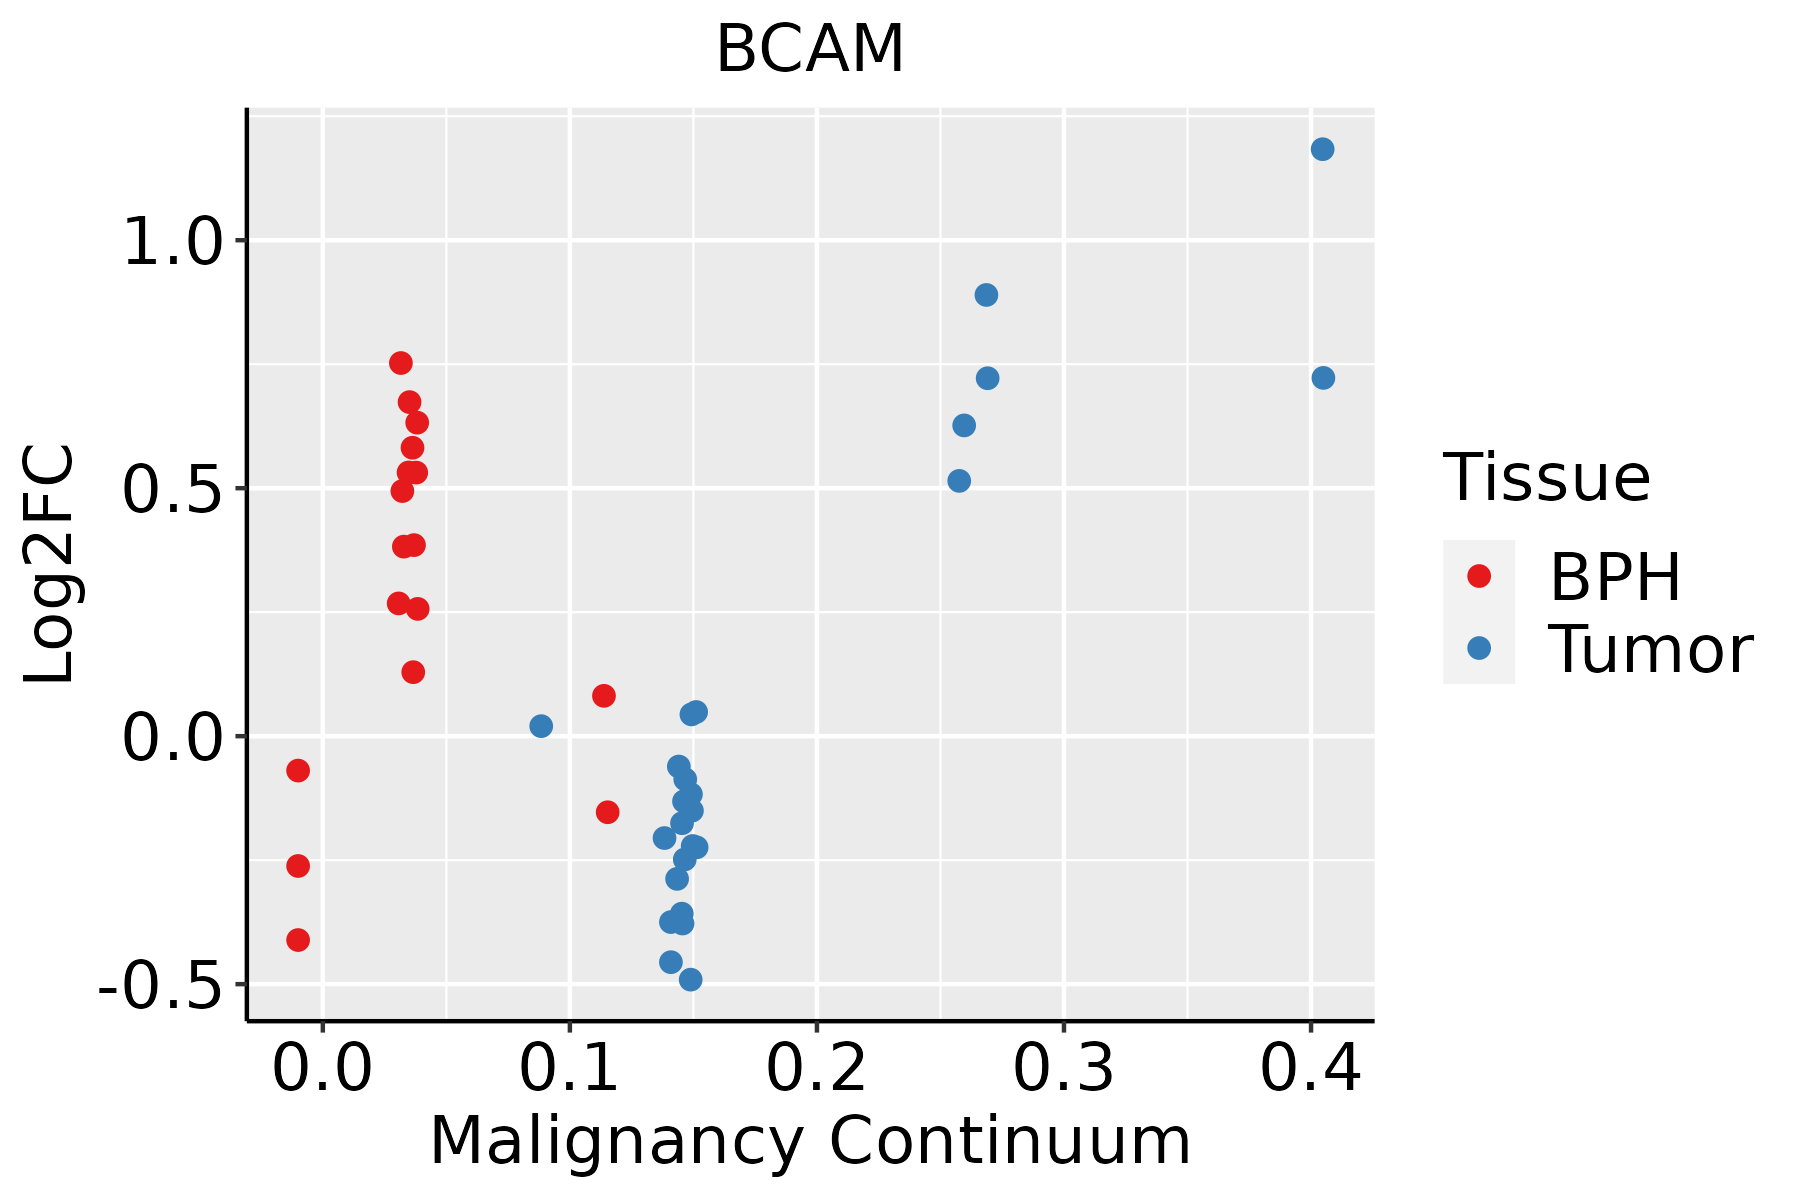 | BPH: Benign Prostatic Hyperplasia |
| Skin | 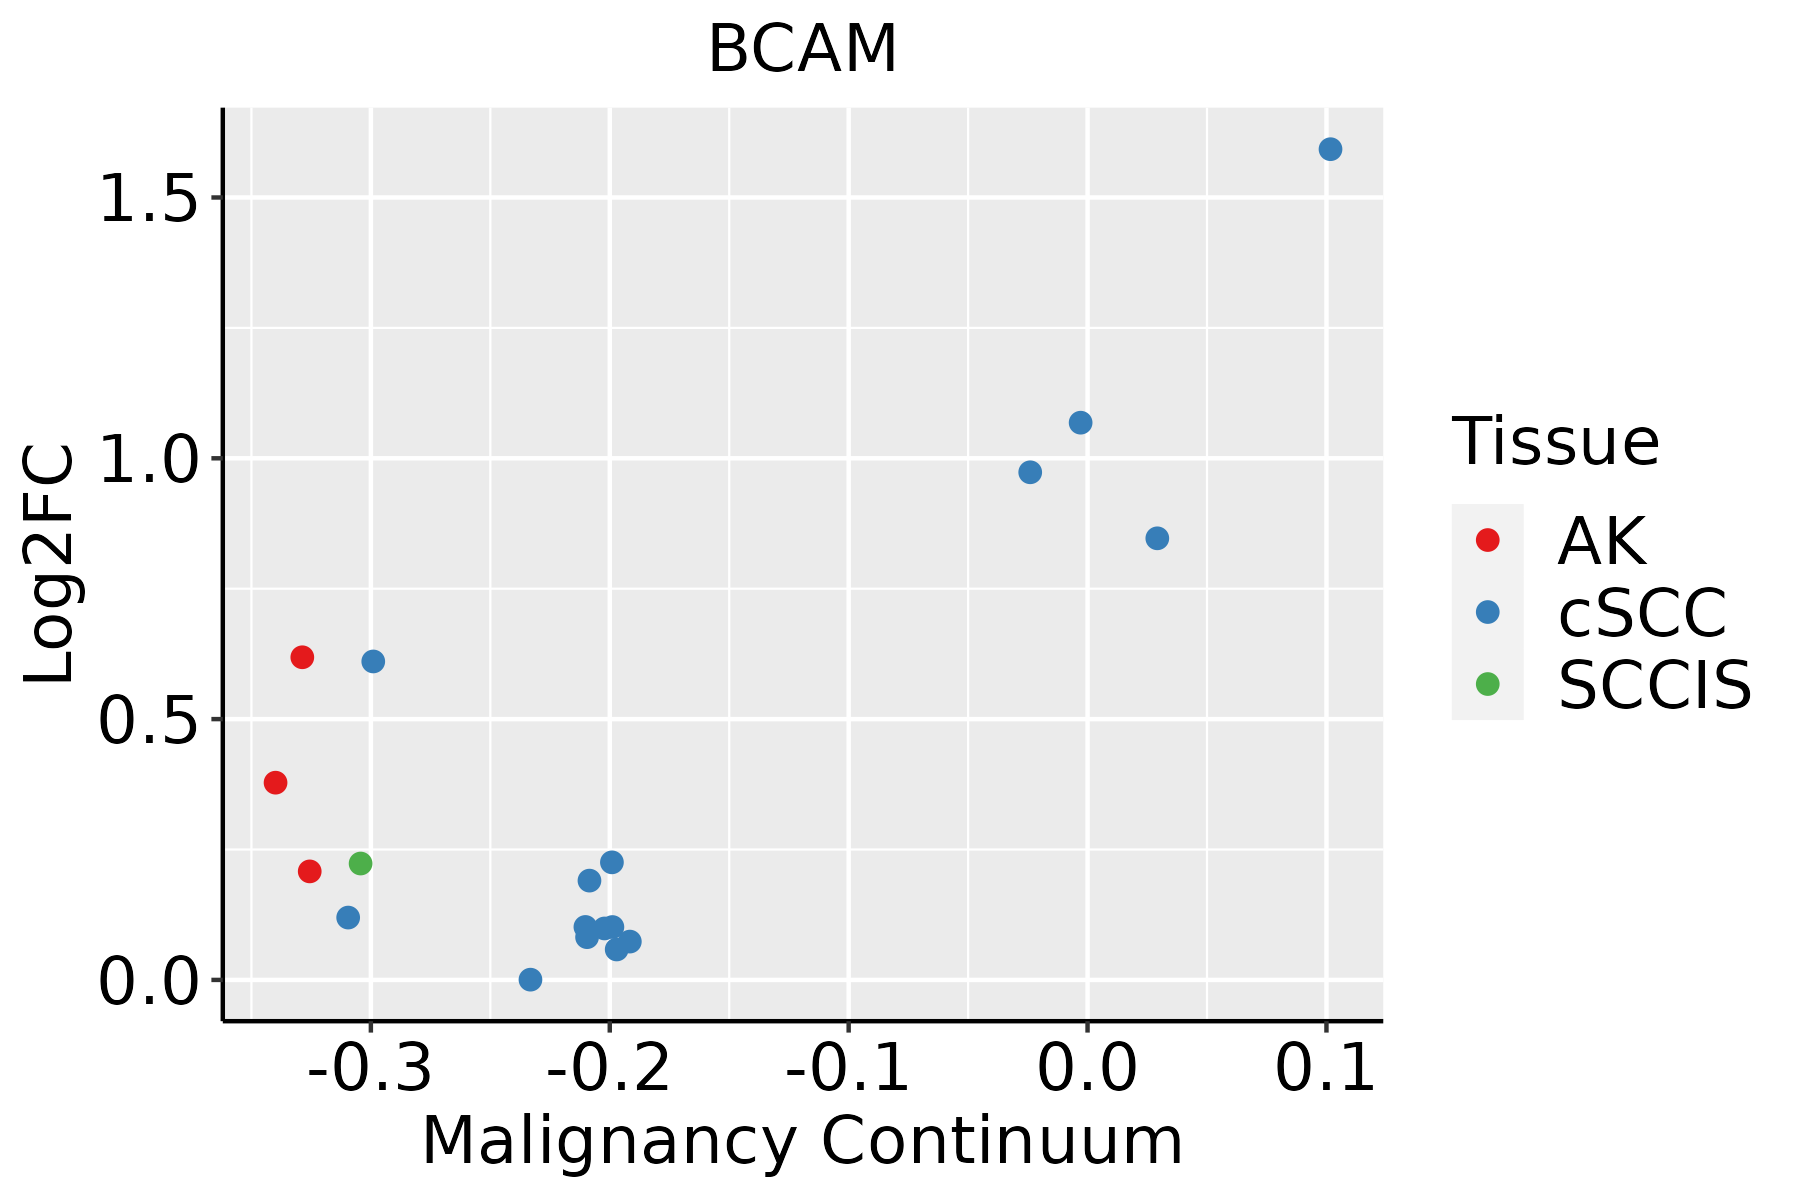 | AK: Actinic keratosis |
| cSCC: Cutaneous squamous cell carcinoma | ||
| SCCIS:squamous cell carcinoma in situ | ||
| Thyroid | 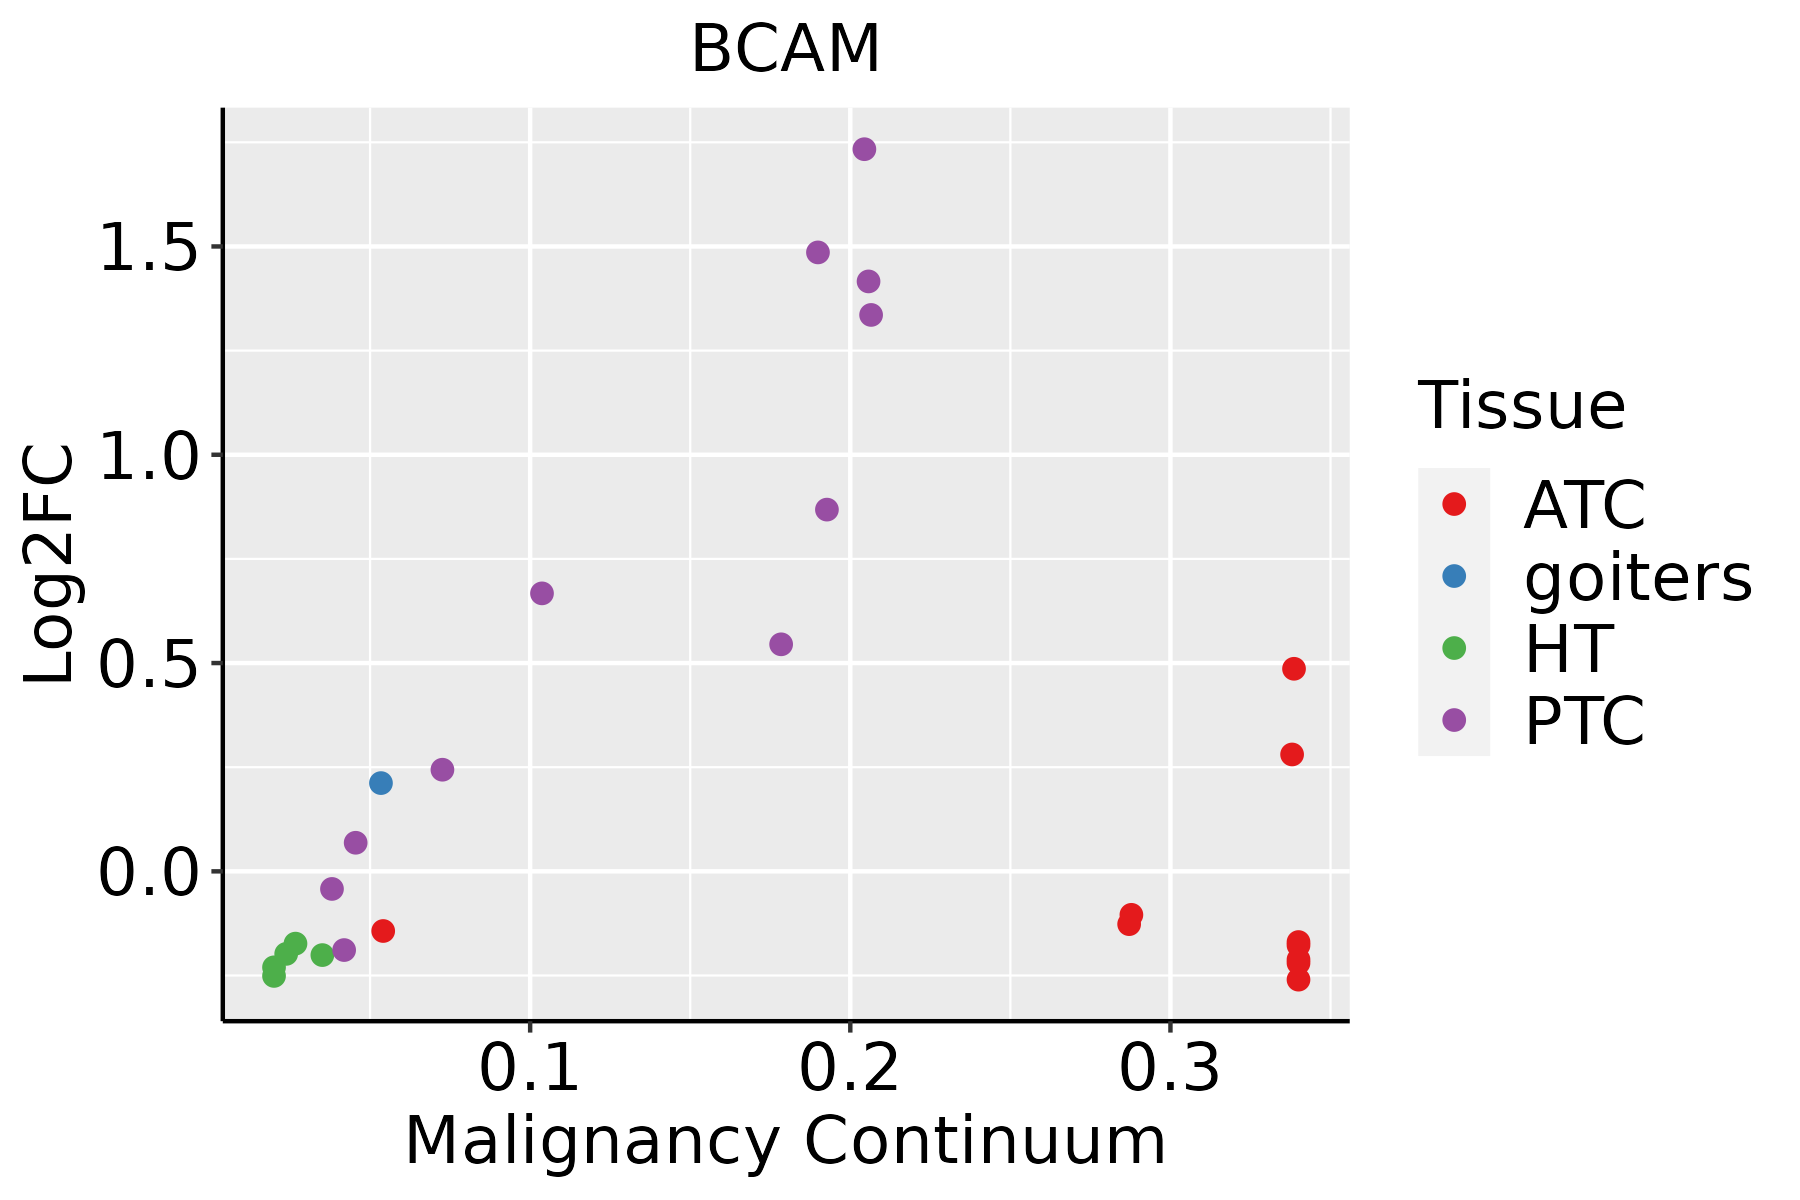 | ATC: Anaplastic thyroid cancer |
| HT: Hashimoto's thyroiditis | ||
| PTC: Papillary thyroid cancer |
| ∗log2FC in expression of this searched gene in stem-like cells from each diseased tissue sample relative to stem-like cells in normal samples in each tissue plotted against the malignancy continuum. Samples are colored based on if they are from different disease stage. |
Top |
Malignant transformation related pathway analysis |
| Find out the enriched GO biological processes and KEGG pathways involved in transition from healthy to precancer to cancer |
| Tissue | Disease Stage | Enriched GO biological Processes |
| Colorectum | AD |  |
| Colorectum | SER |  |
| Colorectum | MSS |  |
| Colorectum | MSI-H |  |
| Colorectum | FAP |  |
| ∗Top 15 enriched GO BP terms are showed in the bar plot of each disease state in each tissue. Each row represents a significant GO biological process which is colored according to the -log10(p.adjust). |
| Page: 1 2 3 4 5 6 7 8 9 |
| GO ID | Tissue | Disease Stage | Description | Gene Ratio | Bg Ratio | pvalue | p.adjust | Count |
| GO:003158919 | Esophagus | ESCC | cell-substrate adhesion | 221/8552 | 363/18723 | 3.06e-09 | 6.62e-08 | 221 |
| GO:000716018 | Esophagus | ESCC | cell-matrix adhesion | 141/8552 | 233/18723 | 3.33e-06 | 3.71e-05 | 141 |
| GO:003158912 | Liver | Cirrhotic | cell-substrate adhesion | 128/4634 | 363/18723 | 4.10e-06 | 6.90e-05 | 128 |
| GO:000716011 | Liver | Cirrhotic | cell-matrix adhesion | 85/4634 | 233/18723 | 4.06e-05 | 4.83e-04 | 85 |
| GO:003158922 | Liver | HCC | cell-substrate adhesion | 188/7958 | 363/18723 | 2.00e-04 | 1.55e-03 | 188 |
| GO:000716021 | Liver | HCC | cell-matrix adhesion | 123/7958 | 233/18723 | 9.34e-04 | 5.47e-03 | 123 |
| GO:00071607 | Lung | IAC | cell-matrix adhesion | 63/2061 | 233/18723 | 7.08e-12 | 4.27e-09 | 63 |
| GO:00315897 | Lung | IAC | cell-substrate adhesion | 85/2061 | 363/18723 | 8.57e-12 | 4.27e-09 | 85 |
| GO:000716012 | Lung | AIS | cell-matrix adhesion | 60/1849 | 233/18723 | 2.19e-12 | 2.55e-09 | 60 |
| GO:003158913 | Lung | AIS | cell-substrate adhesion | 80/1849 | 363/18723 | 3.80e-12 | 3.16e-09 | 80 |
| GO:000716031 | Lung | MIAC | cell-matrix adhesion | 35/967 | 233/18723 | 1.26e-08 | 7.17e-06 | 35 |
| GO:003158931 | Lung | MIAC | cell-substrate adhesion | 44/967 | 363/18723 | 1.30e-07 | 3.56e-05 | 44 |
| GO:003158917 | Oral cavity | OSCC | cell-substrate adhesion | 193/7305 | 363/18723 | 2.48e-08 | 4.82e-07 | 193 |
| GO:000716016 | Oral cavity | OSCC | cell-matrix adhesion | 125/7305 | 233/18723 | 3.76e-06 | 4.45e-05 | 125 |
| GO:003158918 | Oral cavity | LP | cell-substrate adhesion | 111/4623 | 363/18723 | 5.94e-03 | 3.53e-02 | 111 |
| GO:003158910 | Prostate | BPH | cell-substrate adhesion | 110/3107 | 363/18723 | 4.64e-11 | 2.96e-09 | 110 |
| GO:000716010 | Prostate | BPH | cell-matrix adhesion | 72/3107 | 233/18723 | 4.17e-08 | 1.16e-06 | 72 |
| GO:003158916 | Prostate | Tumor | cell-substrate adhesion | 109/3246 | 363/18723 | 1.41e-09 | 6.71e-08 | 109 |
| GO:000716015 | Prostate | Tumor | cell-matrix adhesion | 71/3246 | 233/18723 | 5.40e-07 | 1.16e-05 | 71 |
| GO:003158920 | Skin | AK | cell-substrate adhesion | 74/1910 | 363/18723 | 4.40e-09 | 3.30e-07 | 74 |
| Page: 1 2 |
| Pathway ID | Tissue | Disease Stage | Description | Gene Ratio | Bg Ratio | pvalue | p.adjust | qvalue | Count |
| Page: 1 |
Top |
Cell-cell communication analysis |
| Identification of potential cell-cell interactions between two cell types and their ligand-receptor pairs for different disease states |
| Ligand | Receptor | LRpair | Pathway | Tissue | Disease Stage |
| Page: 1 |
Top |
Single-cell gene regulatory network inference analysis |
| Find out the significant the regulons (TFs) and the target genes of each regulon across cell types for different disease states |
| TF | Cell Type | Tissue | Disease Stage | Target Gene | RSS | Regulon Activity |
| ∗The dot plots of a searched regulon are shown for all cell subpopulations in each disease state of each tissue based on the regulon specific score inferred using pySCENIC and by calculating the average expression. |
| Page: 1 |
Top |
Somatic mutation of malignant transformation related genes |
| Annotation of somatic variants for genes involved in malignant transformation |
| Hugo Symbol | Variant Class | Variant Classification | dbSNP RS | HGVSc | HGVSp | HGVSp Short | SWISSPROT | BIOTYPE | SIFT | PolyPhen | Tumor Sample Barcode | Tissue | Histology | Sex | Age | Stage | Therapy Types | Drugs | Outcome |
| BCAM | SNV | Missense_Mutation | rs777617369 | c.529N>A | p.Gly177Arg | p.G177R | P50895 | protein_coding | deleterious(0) | probably_damaging(0.997) | TCGA-2W-A8YY-01 | Cervix | cervical & endocervical cancer | Female | <65 | I/II | Chemotherapy | cisplatin | CR |
| BCAM | SNV | Missense_Mutation | c.1750N>C | p.Glu584Gln | p.E584Q | P50895 | protein_coding | deleterious(0.02) | probably_damaging(0.986) | TCGA-MU-A51Y-01 | Cervix | cervical & endocervical cancer | Female | <65 | I/II | Unknown | Unknown | SD | |
| BCAM | SNV | Missense_Mutation | c.593T>C | p.Met198Thr | p.M198T | P50895 | protein_coding | tolerated(0.31) | benign(0.015) | TCGA-AA-3811-01 | Colorectum | colon adenocarcinoma | Female | >=65 | III/IV | Unknown | Unknown | PD | |
| BCAM | SNV | Missense_Mutation | rs140735488 | c.1595G>A | p.Arg532His | p.R532H | P50895 | protein_coding | tolerated(0.2) | benign(0) | TCGA-AA-3947-01 | Colorectum | colon adenocarcinoma | Female | <65 | I/II | Unknown | Unknown | SD |
| BCAM | SNV | Missense_Mutation | rs766822712 | c.1358N>T | p.Ala453Val | p.A453V | P50895 | protein_coding | tolerated(0.09) | benign(0.012) | TCGA-AD-6889-01 | Colorectum | colon adenocarcinoma | Male | >=65 | I/II | Chemotherapy | xeloda | PD |
| BCAM | SNV | Missense_Mutation | rs569668745 | c.1402G>A | p.Glu468Lys | p.E468K | P50895 | protein_coding | tolerated(0.17) | benign(0.355) | TCGA-CA-6717-01 | Colorectum | colon adenocarcinoma | Male | <65 | I/II | Chemotherapy | oxaliplatin | CR |
| BCAM | SNV | Missense_Mutation | c.815N>A | p.Gly272Asp | p.G272D | P50895 | protein_coding | tolerated(0.62) | benign(0.27) | TCGA-DM-A1HB-01 | Colorectum | colon adenocarcinoma | Male | >=65 | III/IV | Unknown | Unknown | SD | |
| BCAM | SNV | Missense_Mutation | rs778465310 | c.427N>A | p.Val143Met | p.V143M | P50895 | protein_coding | deleterious(0.03) | benign(0.293) | TCGA-QG-A5Z2-01 | Colorectum | colon adenocarcinoma | Male | <65 | I/II | Unknown | Unknown | SD |
| BCAM | SNV | Missense_Mutation | rs768582759 | c.905N>T | p.Thr302Met | p.T302M | P50895 | protein_coding | tolerated(0.2) | benign(0.058) | TCGA-AG-3726-01 | Colorectum | rectum adenocarcinoma | Female | <65 | I/II | Unknown | Unknown | SD |
| BCAM | SNV | Missense_Mutation | novel | c.895N>T | p.Pro299Ser | p.P299S | P50895 | protein_coding | deleterious(0) | possibly_damaging(0.874) | TCGA-AG-A02N-01 | Colorectum | rectum adenocarcinoma | Male | >=65 | I/II | Chemotherapy | folinic | CR |
| Page: 1 2 3 4 5 6 |
Top |
Related drugs of malignant transformation related genes |
| Identification of chemicals and drugs interact with genes involved in malignant transfromation |
| (DGIdb 4.0) |
| Entrez ID | Symbol | Category | Interaction Types | Drug Claim Name | Drug Name | PMIDs |
| Page: 1 |

Copyright 2023-Present -The University of Texas Health Science Center at Houston |