
|
|||||
|
 | |
| |
| |
| |
| |
| |
|
Gene: ADIRF |
Gene summary for ADIRF |
| Gene information | Species | Human | Gene symbol | ADIRF | Gene ID | 10974 |
| Gene name | adipogenesis regulatory factor | |
| Gene Alias | AFRO | |
| Cytomap | 10q23.2 | |
| Gene Type | protein-coding | GO ID | GO:0006139 | UniProtAcc | Q15847 |
Top |
Malignant transformation analysis |
| Identification of the aberrant gene expression in precancerous and cancerous lesions by comparing the gene expression of stem-like cells in diseased tissues with normal stem cells |
| Entrez ID | Symbol | Replicates | Species | Organ | Tissue | Adj P-value | Log2FC | Malignancy |
| 10974 | ADIRF | NEOLP-1 | Human | Oral cavity | NEOLP | 2.53e-08 | -2.98e-01 | -0.0194 |
| 10974 | ADIRF | SYSMH1 | Human | Oral cavity | OSCC | 1.10e-05 | 6.66e-01 | 0.1127 |
| 10974 | ADIRF | SYSMH2 | Human | Oral cavity | OSCC | 6.02e-04 | 1.10e+00 | 0.2326 |
| 10974 | ADIRF | SYSMH3 | Human | Oral cavity | OSCC | 2.04e-14 | 1.48e+00 | 0.2442 |
| 10974 | ADIRF | SYSMH6 | Human | Oral cavity | OSCC | 8.46e-08 | 1.03e+00 | 0.1275 |
| 10974 | ADIRF | GSM5252130_BPH340PrGF_Via | Human | Prostate | BPH | 2.08e-05 | 9.49e-01 | -0.1972 |
| 10974 | ADIRF | GSM5252133_BPH389PrSF | Human | Prostate | BPH | 1.53e-02 | 6.88e-01 | -0.2027 |
| 10974 | ADIRF | GSM5252135_BPH511PrPUr_Fcol_3GEX | Human | Prostate | BPH | 1.30e-20 | 1.57e+00 | -0.1833 |
| 10974 | ADIRF | 047563_1562-all-cells | Human | Prostate | BPH | 1.60e-07 | 1.21e-01 | 0.0791 |
| 10974 | ADIRF | Dong_P1 | Human | Prostate | Tumor | 3.34e-64 | 1.07e+00 | 0.035 |
| 10974 | ADIRF | Dong_P3 | Human | Prostate | Tumor | 1.82e-24 | 5.53e-01 | 0.0278 |
| 10974 | ADIRF | Dong_P4 | Human | Prostate | Tumor | 1.24e-09 | 6.94e-01 | 0.0292 |
| 10974 | ADIRF | GSM5353243_PA_PR5261_T1_S23_L002 | Human | Prostate | Tumor | 6.24e-05 | -3.78e-01 | 0.1545 |
| 10974 | ADIRF | GSM5353244_PA_PR5261_T2_S24_L002 | Human | Prostate | Tumor | 1.10e-05 | -4.29e-01 | 0.1569 |
| 10974 | ADIRF | P1_S1_AK | Human | Skin | AK | 1.84e-45 | -1.20e+00 | -0.3399 |
| 10974 | ADIRF | P2_S3_AK | Human | Skin | AK | 1.88e-45 | -1.20e+00 | -0.3287 |
| 10974 | ADIRF | P2_S4_SCCIS | Human | Skin | SCCIS | 1.01e-40 | -1.13e+00 | -0.3043 |
| 10974 | ADIRF | P3_S6_AK | Human | Skin | AK | 3.46e-49 | -1.24e+00 | -0.3256 |
| 10974 | ADIRF | P4_S8_cSCC | Human | Skin | cSCC | 7.36e-26 | -9.29e-01 | -0.3095 |
| 10974 | ADIRF | P5_S10_cSCC | Human | Skin | cSCC | 1.59e-37 | -7.92e-01 | -0.299 |
| Page: 1 2 3 4 5 6 7 8 9 10 11 12 |
| Tissue | Expression Dynamics | Abbreviation |
| Breast | 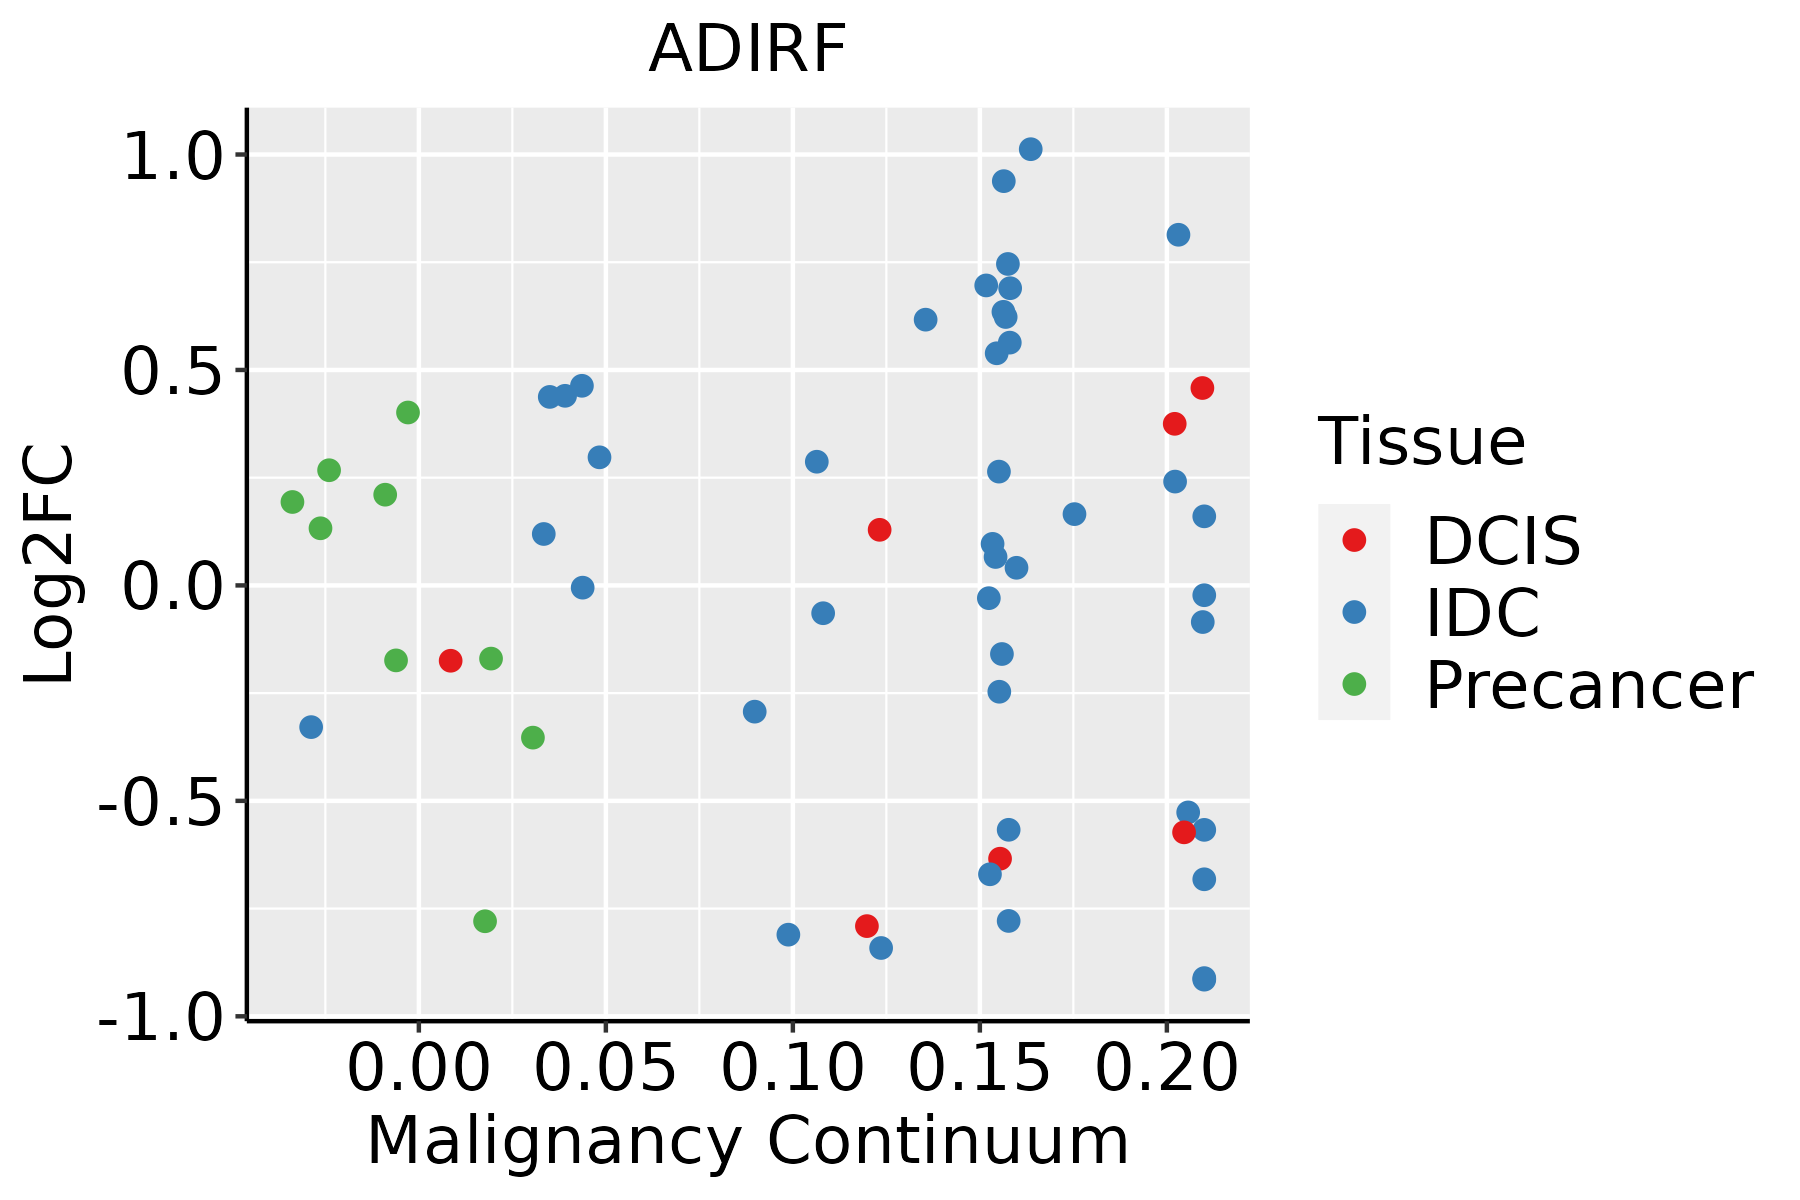 | IDC: Invasive ductal carcinoma |
| DCIS: Ductal carcinoma in situ | ||
| Precancer(BRCA1-mut): Precancerous lesion from BRCA1 mutation carriers | ||
| Cervix | 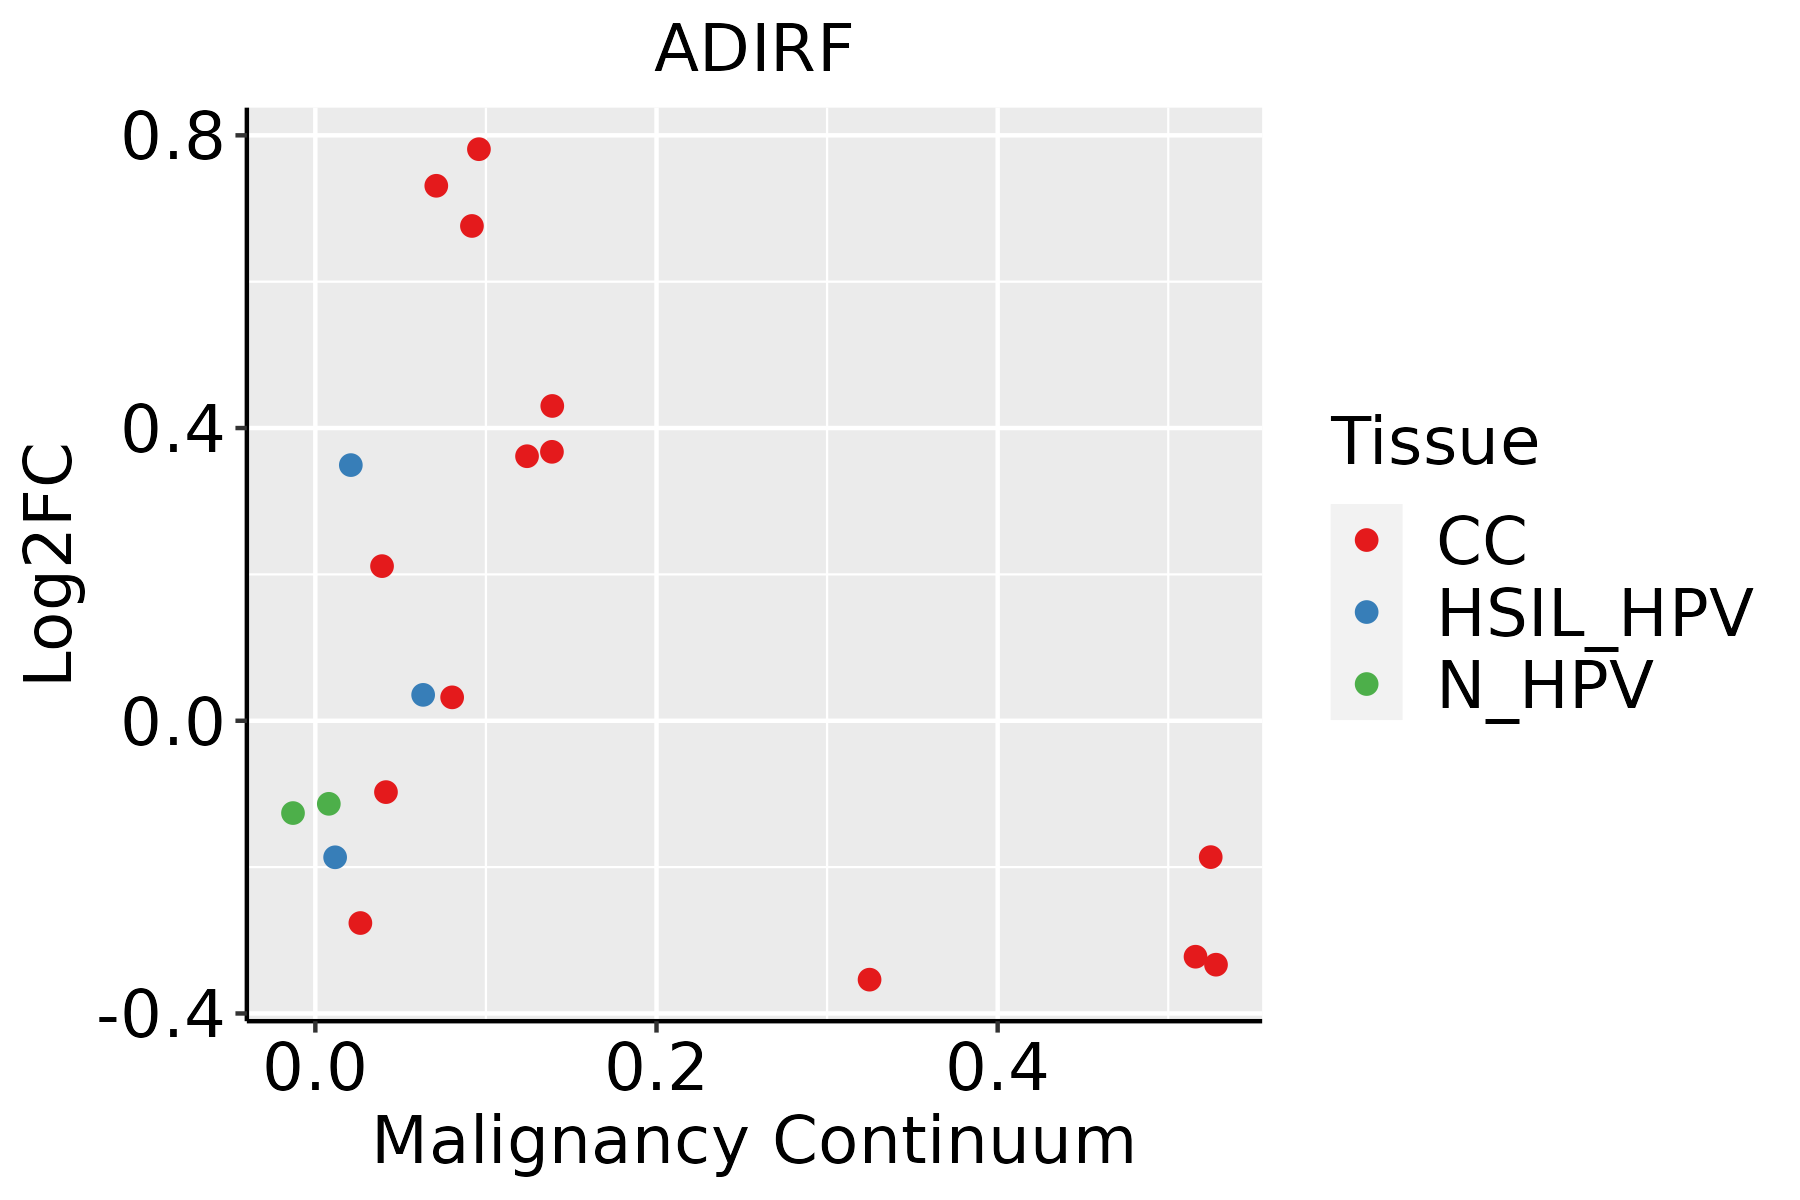 | CC: Cervix cancer |
| HSIL_HPV: HPV-infected high-grade squamous intraepithelial lesions | ||
| N_HPV: HPV-infected normal cervix | ||
| Esophagus | 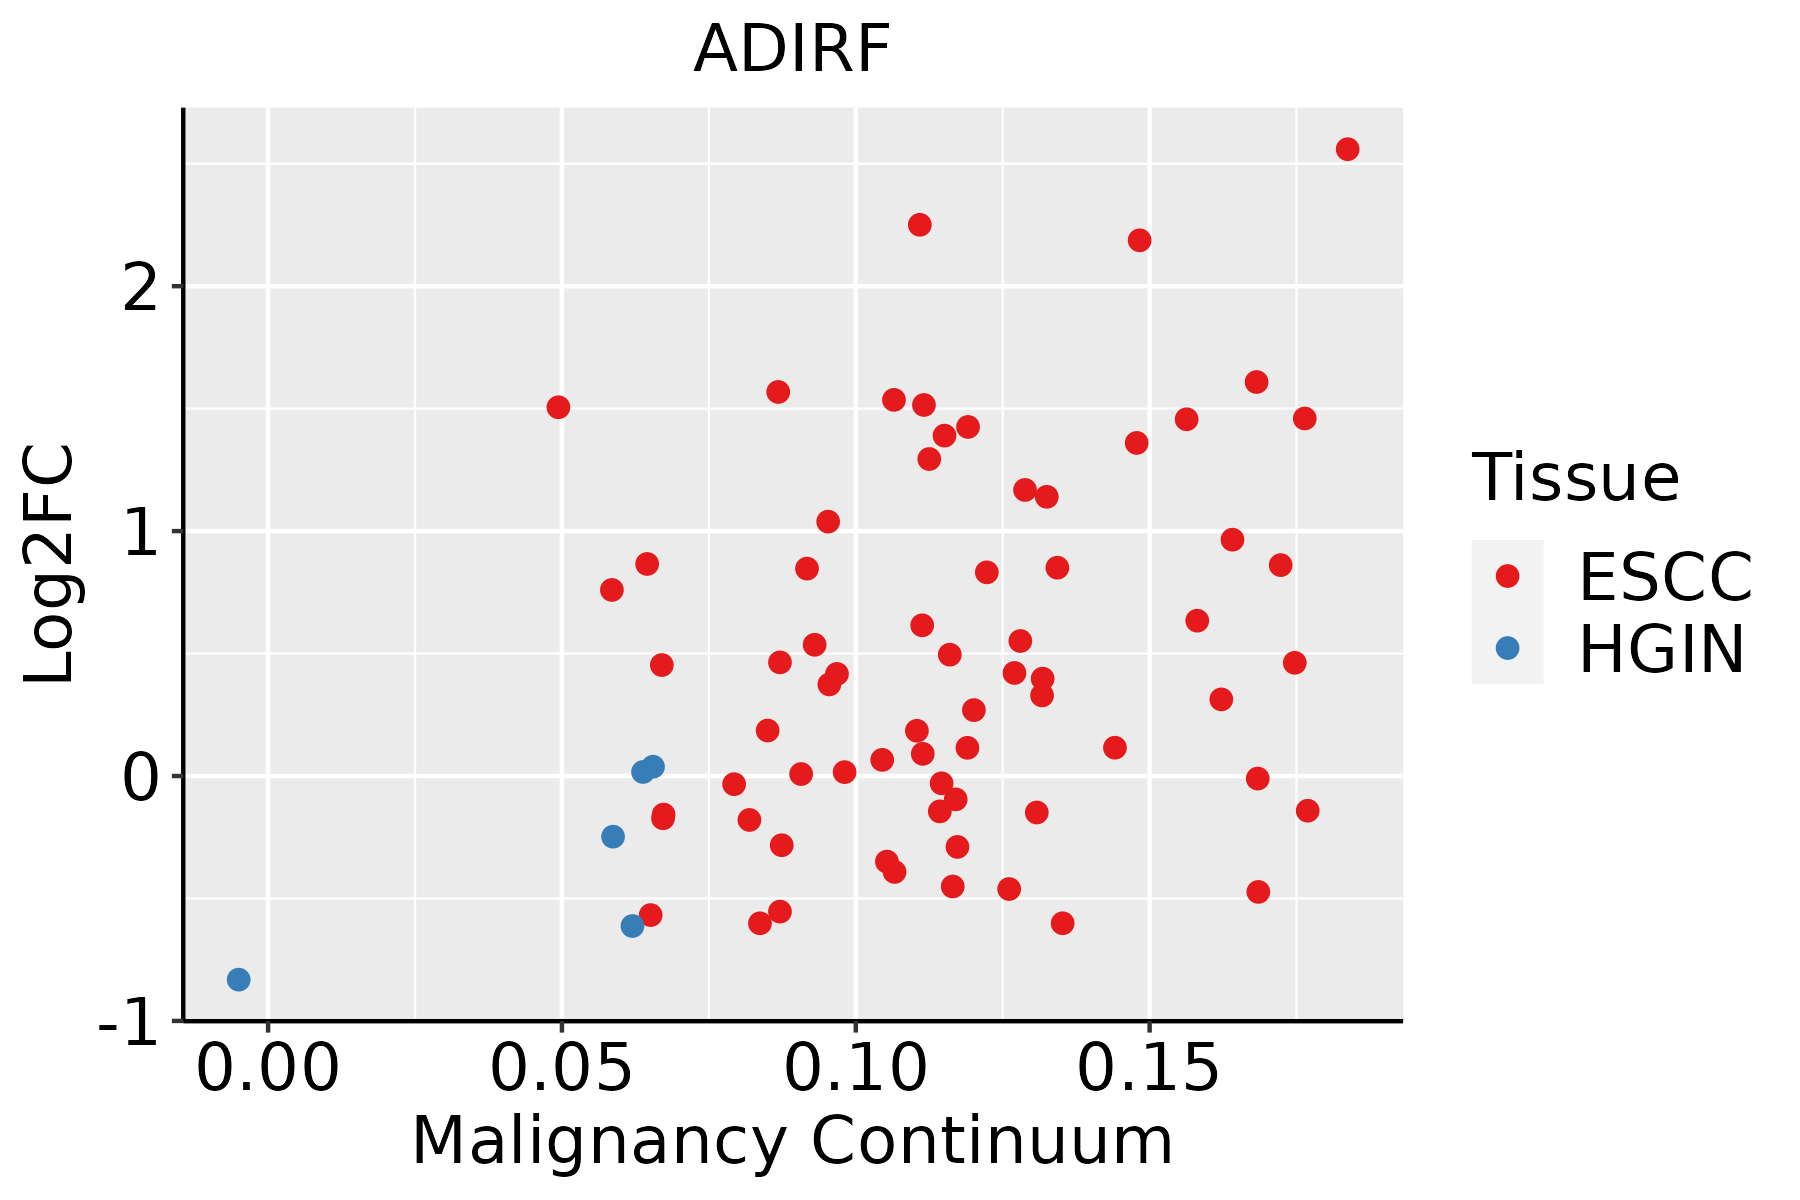 | ESCC: Esophageal squamous cell carcinoma |
| HGIN: High-grade intraepithelial neoplasias | ||
| LGIN: Low-grade intraepithelial neoplasias | ||
| GC |  | CAG: Chronic atrophic gastritis |
| CAG with IM: Chronic atrophic gastritis with intestinal metaplasia | ||
| CSG: Chronic superficial gastritis | ||
| GC: Gastric cancer | ||
| SIM: Severe intestinal metaplasia | ||
| WIM: Wild intestinal metaplasia | ||
| Liver |  | HCC: Hepatocellular carcinoma |
| NAFLD: Non-alcoholic fatty liver disease | ||
| Lung | 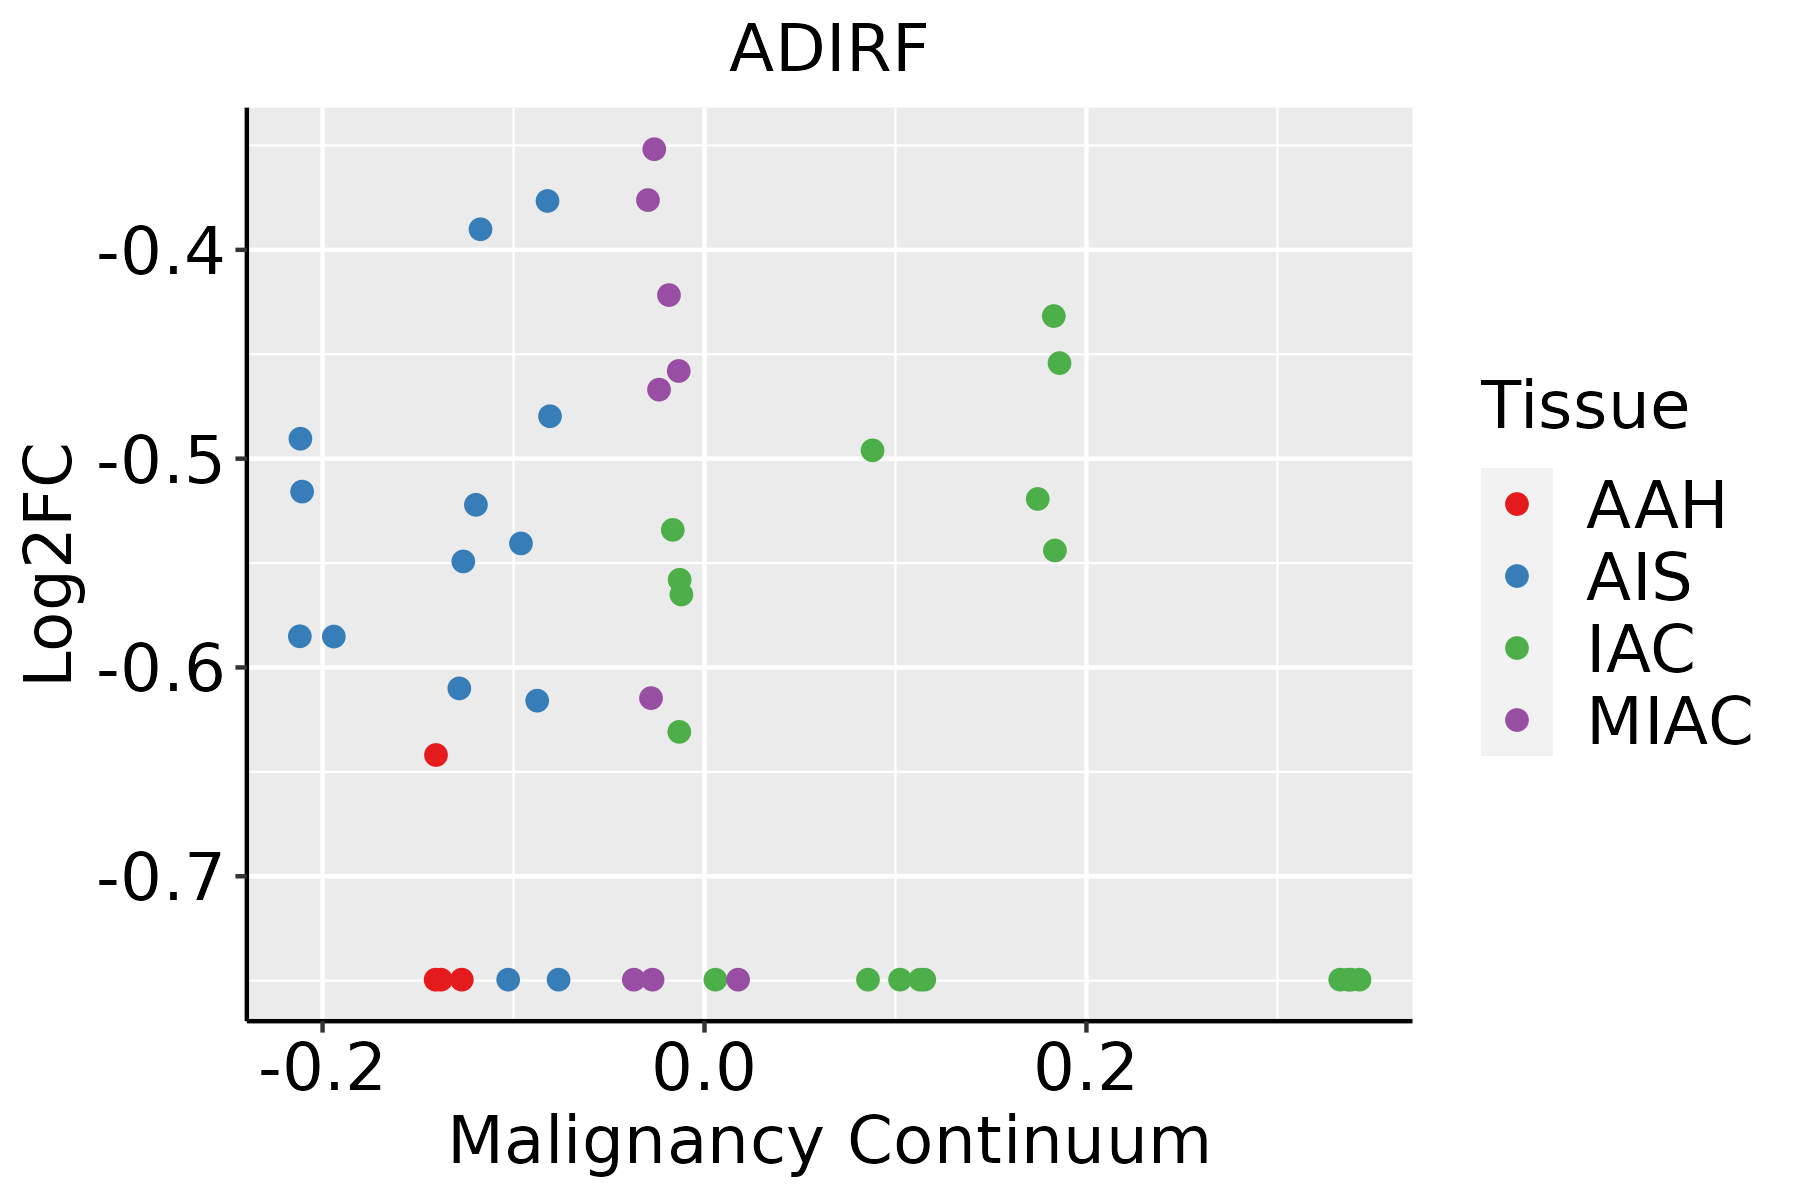 | AAH: Atypical adenomatous hyperplasia |
| AIS: Adenocarcinoma in situ | ||
| IAC: Invasive lung adenocarcinoma | ||
| MIA: Minimally invasive adenocarcinoma | ||
| Oral Cavity | 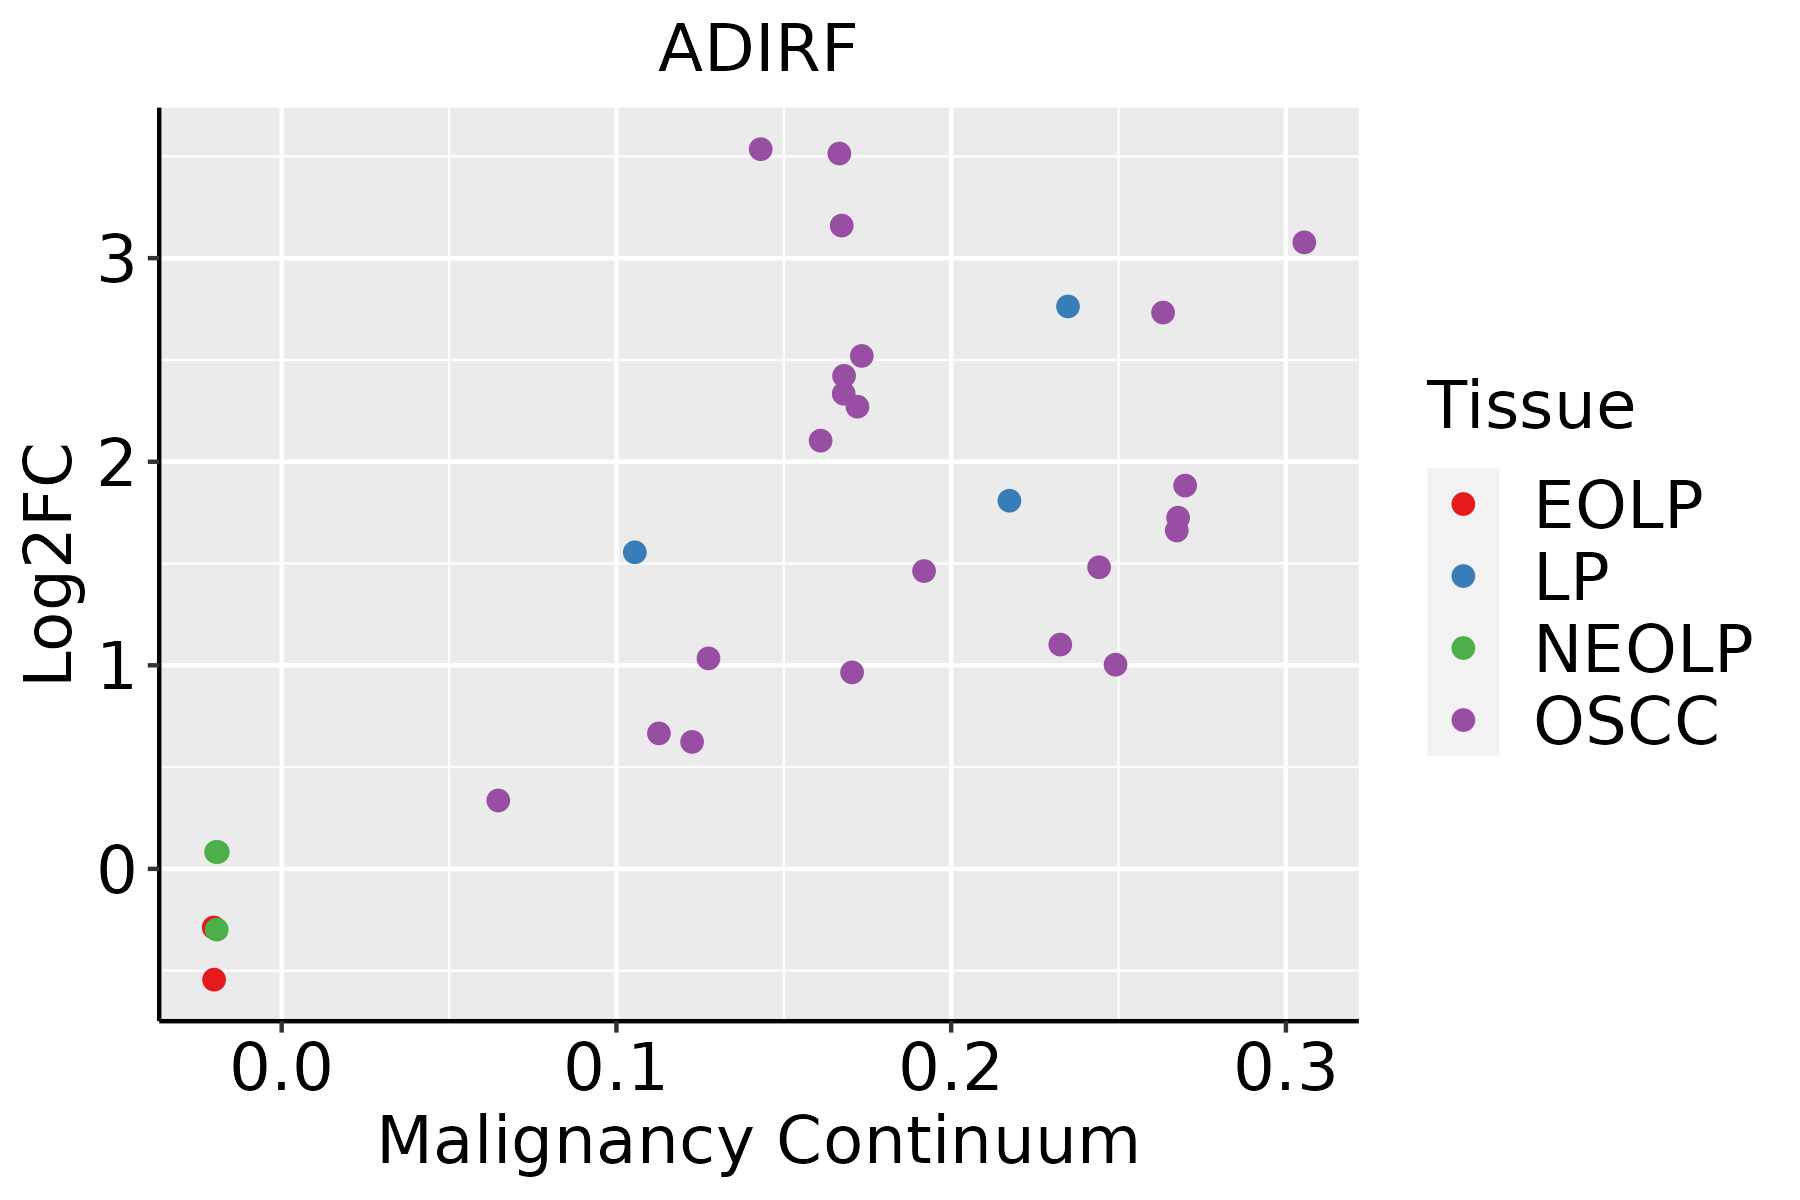 | EOLP: Erosive Oral lichen planus |
| LP: leukoplakia | ||
| NEOLP: Non-erosive oral lichen planus | ||
| OSCC: Oral squamous cell carcinoma | ||
| Prostate |  | BPH: Benign Prostatic Hyperplasia |
| Skin | 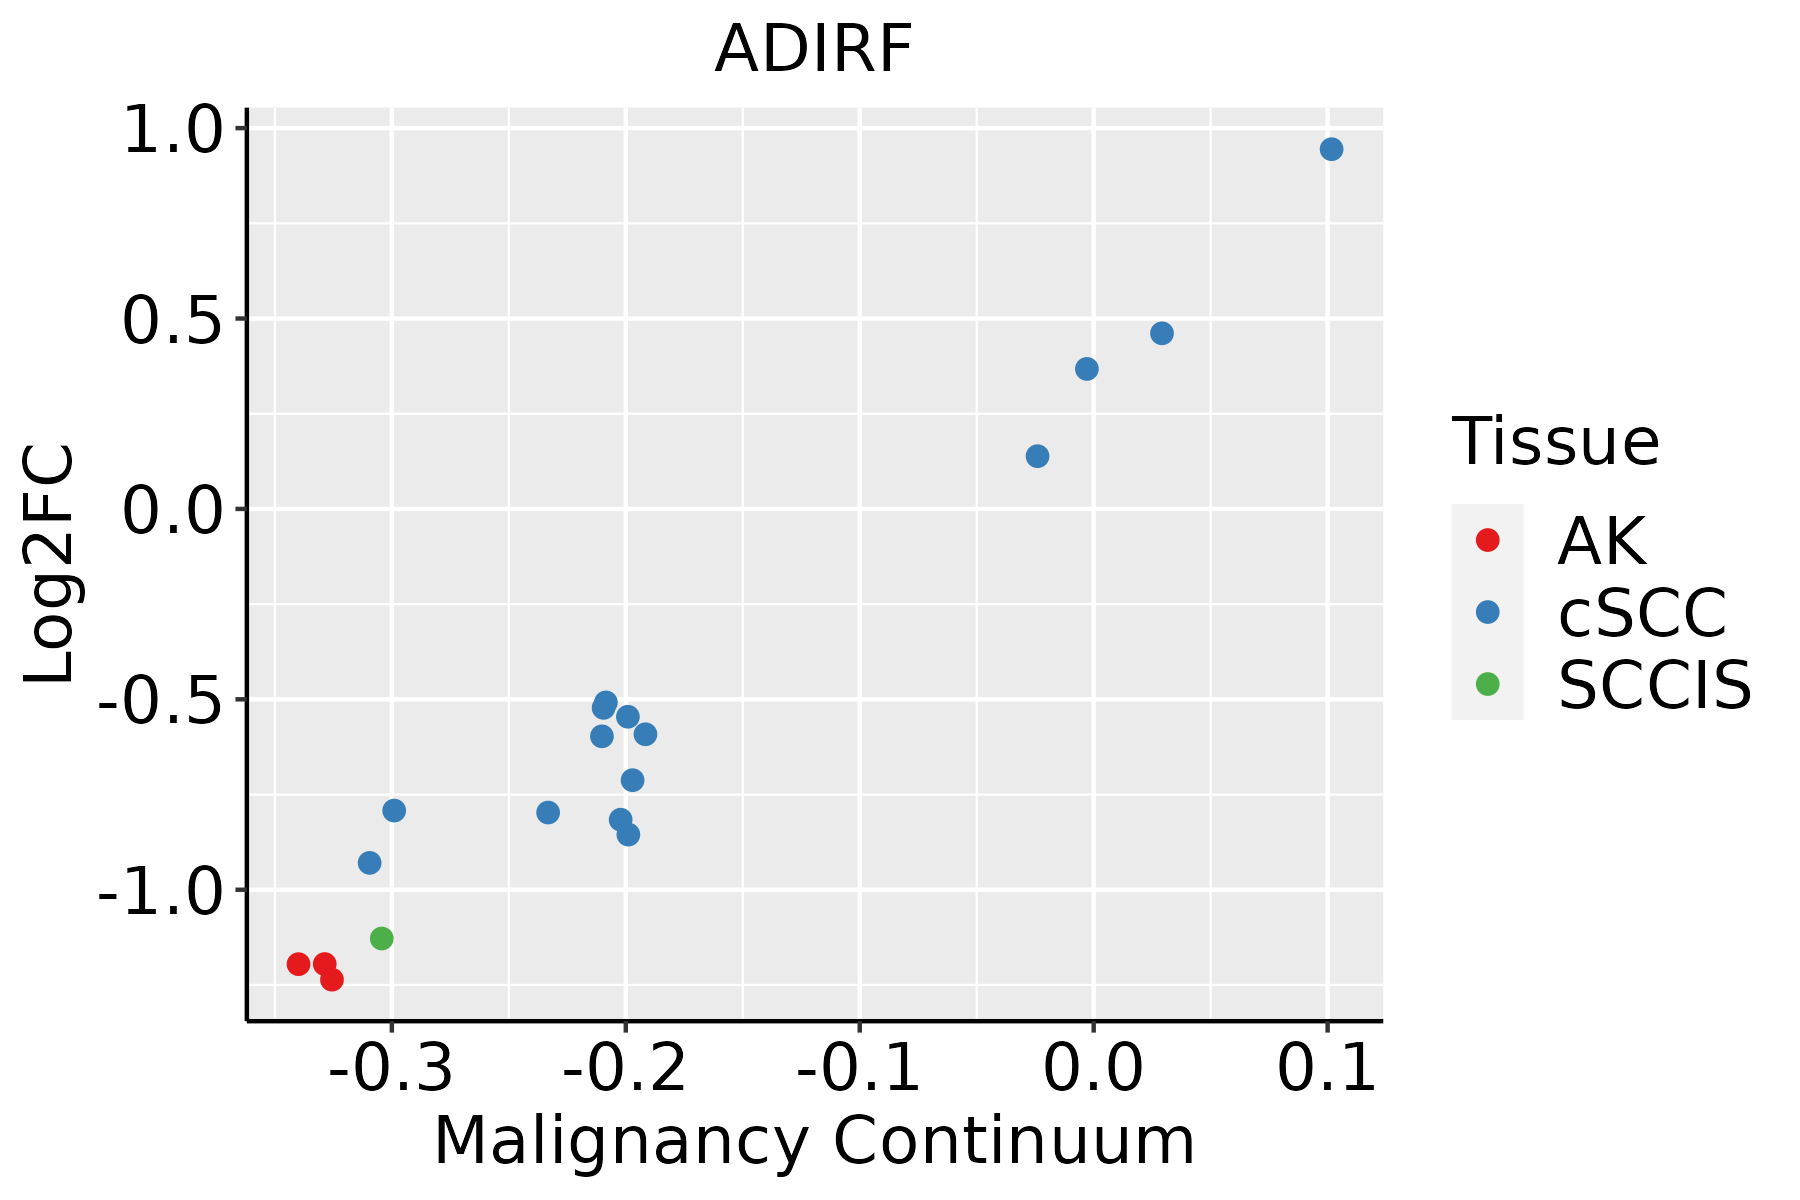 | AK: Actinic keratosis |
| cSCC: Cutaneous squamous cell carcinoma | ||
| SCCIS:squamous cell carcinoma in situ | ||
| Thyroid | 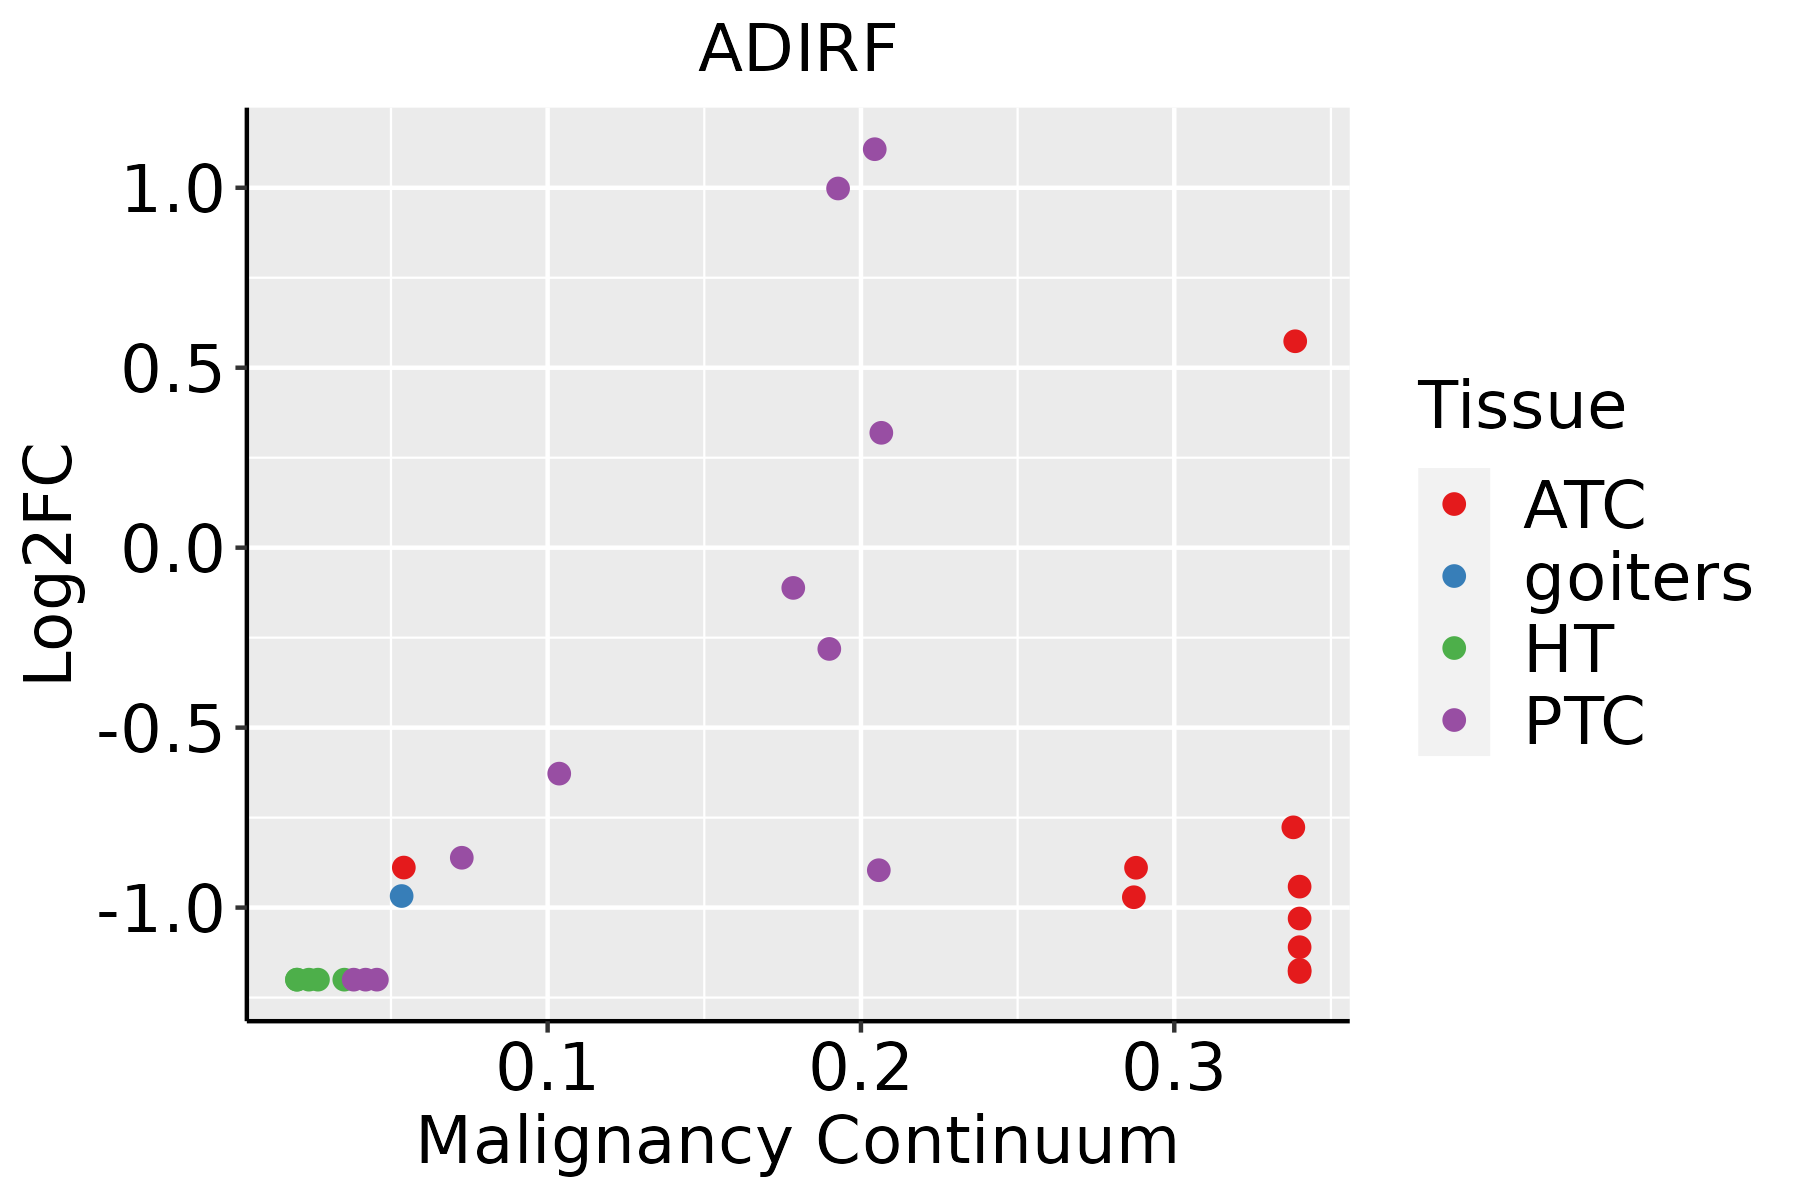 | ATC: Anaplastic thyroid cancer |
| HT: Hashimoto's thyroiditis | ||
| PTC: Papillary thyroid cancer |
| ∗log2FC in expression of this searched gene in stem-like cells from each diseased tissue sample relative to stem-like cells in normal samples in each tissue plotted against the malignancy continuum. Samples are colored based on if they are from different disease stage. |
Top |
Malignant transformation related pathway analysis |
| Find out the enriched GO biological processes and KEGG pathways involved in transition from healthy to precancer to cancer |
| Tissue | Disease Stage | Enriched GO biological Processes |
| Colorectum | AD |  |
| Colorectum | SER |  |
| Colorectum | MSS |  |
| Colorectum | MSI-H |  |
| Colorectum | FAP |  |
| ∗Top 15 enriched GO BP terms are showed in the bar plot of each disease state in each tissue. Each row represents a significant GO biological process which is colored according to the -log10(p.adjust). |
| Page: 1 2 3 4 5 6 7 8 9 |
| GO ID | Tissue | Disease Stage | Description | Gene Ratio | Bg Ratio | pvalue | p.adjust | Count |
| GO:00093148 | Breast | Precancer | response to radiation | 47/1080 | 456/18723 | 8.39e-05 | 1.62e-03 | 47 |
| GO:00712147 | Breast | Precancer | cellular response to abiotic stimulus | 37/1080 | 331/18723 | 9.12e-05 | 1.73e-03 | 37 |
| GO:01040047 | Breast | Precancer | cellular response to environmental stimulus | 37/1080 | 331/18723 | 9.12e-05 | 1.73e-03 | 37 |
| GO:00714785 | Breast | Precancer | cellular response to radiation | 24/1080 | 186/18723 | 1.83e-04 | 2.96e-03 | 24 |
| GO:00094108 | Breast | Precancer | response to xenobiotic stimulus | 45/1080 | 462/18723 | 4.17e-04 | 5.56e-03 | 45 |
| GO:00454444 | Breast | Precancer | fat cell differentiation | 26/1080 | 229/18723 | 7.60e-04 | 9.04e-03 | 26 |
| GO:00456003 | Breast | Precancer | positive regulation of fat cell differentiation | 10/1080 | 66/18723 | 4.34e-03 | 3.39e-02 | 10 |
| GO:000931412 | Breast | IDC | response to radiation | 62/1434 | 456/18723 | 6.91e-06 | 2.10e-04 | 62 |
| GO:000941013 | Breast | IDC | response to xenobiotic stimulus | 62/1434 | 462/18723 | 1.05e-05 | 2.88e-04 | 62 |
| GO:007121413 | Breast | IDC | cellular response to abiotic stimulus | 48/1434 | 331/18723 | 1.37e-05 | 3.53e-04 | 48 |
| GO:010400413 | Breast | IDC | cellular response to environmental stimulus | 48/1434 | 331/18723 | 1.37e-05 | 3.53e-04 | 48 |
| GO:007147813 | Breast | IDC | cellular response to radiation | 29/1434 | 186/18723 | 1.91e-04 | 3.15e-03 | 29 |
| GO:004544412 | Breast | IDC | fat cell differentiation | 30/1434 | 229/18723 | 2.72e-03 | 2.41e-02 | 30 |
| GO:004560011 | Breast | IDC | positive regulation of fat cell differentiation | 12/1434 | 66/18723 | 3.99e-03 | 3.23e-02 | 12 |
| GO:000931422 | Breast | DCIS | response to radiation | 62/1390 | 456/18723 | 2.56e-06 | 8.87e-05 | 62 |
| GO:007121423 | Breast | DCIS | cellular response to abiotic stimulus | 47/1390 | 331/18723 | 1.32e-05 | 3.31e-04 | 47 |
| GO:010400423 | Breast | DCIS | cellular response to environmental stimulus | 47/1390 | 331/18723 | 1.32e-05 | 3.31e-04 | 47 |
| GO:000941023 | Breast | DCIS | response to xenobiotic stimulus | 59/1390 | 462/18723 | 3.00e-05 | 6.61e-04 | 59 |
| GO:007147822 | Breast | DCIS | cellular response to radiation | 29/1390 | 186/18723 | 1.12e-04 | 2.00e-03 | 29 |
| GO:004544421 | Breast | DCIS | fat cell differentiation | 30/1390 | 229/18723 | 1.70e-03 | 1.68e-02 | 30 |
| Page: 1 2 3 4 5 6 7 8 9 |
| Pathway ID | Tissue | Disease Stage | Description | Gene Ratio | Bg Ratio | pvalue | p.adjust | qvalue | Count |
| Page: 1 |
Top |
Cell-cell communication analysis |
| Identification of potential cell-cell interactions between two cell types and their ligand-receptor pairs for different disease states |
| Ligand | Receptor | LRpair | Pathway | Tissue | Disease Stage |
| Page: 1 |
Top |
Single-cell gene regulatory network inference analysis |
| Find out the significant the regulons (TFs) and the target genes of each regulon across cell types for different disease states |
| TF | Cell Type | Tissue | Disease Stage | Target Gene | RSS | Regulon Activity |
| ∗The dot plots of a searched regulon are shown for all cell subpopulations in each disease state of each tissue based on the regulon specific score inferred using pySCENIC and by calculating the average expression. |
| Page: 1 |
Top |
Somatic mutation of malignant transformation related genes |
| Annotation of somatic variants for genes involved in malignant transformation |
| Hugo Symbol | Variant Class | Variant Classification | dbSNP RS | HGVSc | HGVSp | HGVSp Short | SWISSPROT | BIOTYPE | SIFT | PolyPhen | Tumor Sample Barcode | Tissue | Histology | Sex | Age | Stage | Therapy Types | Drugs | Outcome |
| ADIRF | SNV | Missense_Mutation | novel | c.164N>T | p.Asp55Val | p.D55V | Q15847 | protein_coding | deleterious(0) | possibly_damaging(0.904) | TCGA-C5-A7X5-01 | Cervix | cervical & endocervical cancer | Female | >=65 | I/II | Chemotherapy | carboplatin | PD |
| ADIRF | SNV | Missense_Mutation | rs143202580 | c.65N>T | p.Ser22Leu | p.S22L | Q15847 | protein_coding | deleterious(0.02) | benign(0.027) | TCGA-LP-A5U2-01 | Cervix | cervical & endocervical cancer | Female | <65 | III/IV | Unknown | Unknown | SD |
| ADIRF | SNV | Missense_Mutation | novel | c.76N>A | p.Ala26Thr | p.A26T | Q15847 | protein_coding | tolerated(0.36) | benign(0.001) | TCGA-AJ-A3BG-01 | Endometrium | uterine corpus endometrioid carcinoma | Female | >=65 | I/II | Chemotherapy | carboplatin | PD |
| ADIRF | SNV | Missense_Mutation | c.104N>T | p.Ala35Val | p.A35V | Q15847 | protein_coding | tolerated(1) | benign(0.289) | TCGA-B5-A11E-01 | Endometrium | uterine corpus endometrioid carcinoma | Female | <65 | I/II | Unknown | Unknown | SD | |
| ADIRF | SNV | Missense_Mutation | c.49N>A | p.Ala17Thr | p.A17T | Q15847 | protein_coding | tolerated(0.18) | benign(0.018) | TCGA-CG-5721-01 | Stomach | stomach adenocarcinoma | Male | <65 | III/IV | Unknown | Unknown | SD | |
| ADIRF | SNV | Missense_Mutation | novel | c.14N>A | p.Gly5Asp | p.G5D | Q15847 | protein_coding | deleterious(0.05) | possibly_damaging(0.873) | TCGA-HF-7132-01 | Stomach | stomach adenocarcinoma | Male | Unknown | I/II | Chemotherapy | fluorouracil | SD |
| ADIRF | SNV | Missense_Mutation | c.41N>T | p.Glu14Val | p.E14V | Q15847 | protein_coding | deleterious(0) | possibly_damaging(0.529) | TCGA-HU-A4G9-01 | Stomach | stomach adenocarcinoma | Female | >=65 | I/II | Unknown | Unknown | SD |
| Page: 1 |
Top |
Related drugs of malignant transformation related genes |
| Identification of chemicals and drugs interact with genes involved in malignant transfromation |
| (DGIdb 4.0) |
| Entrez ID | Symbol | Category | Interaction Types | Drug Claim Name | Drug Name | PMIDs |
| Page: 1 |

Copyright 2023-Present -The University of Texas Health Science Center at Houston |