| Tissue | Expression Dynamics | Abbreviation |
| Cervix | 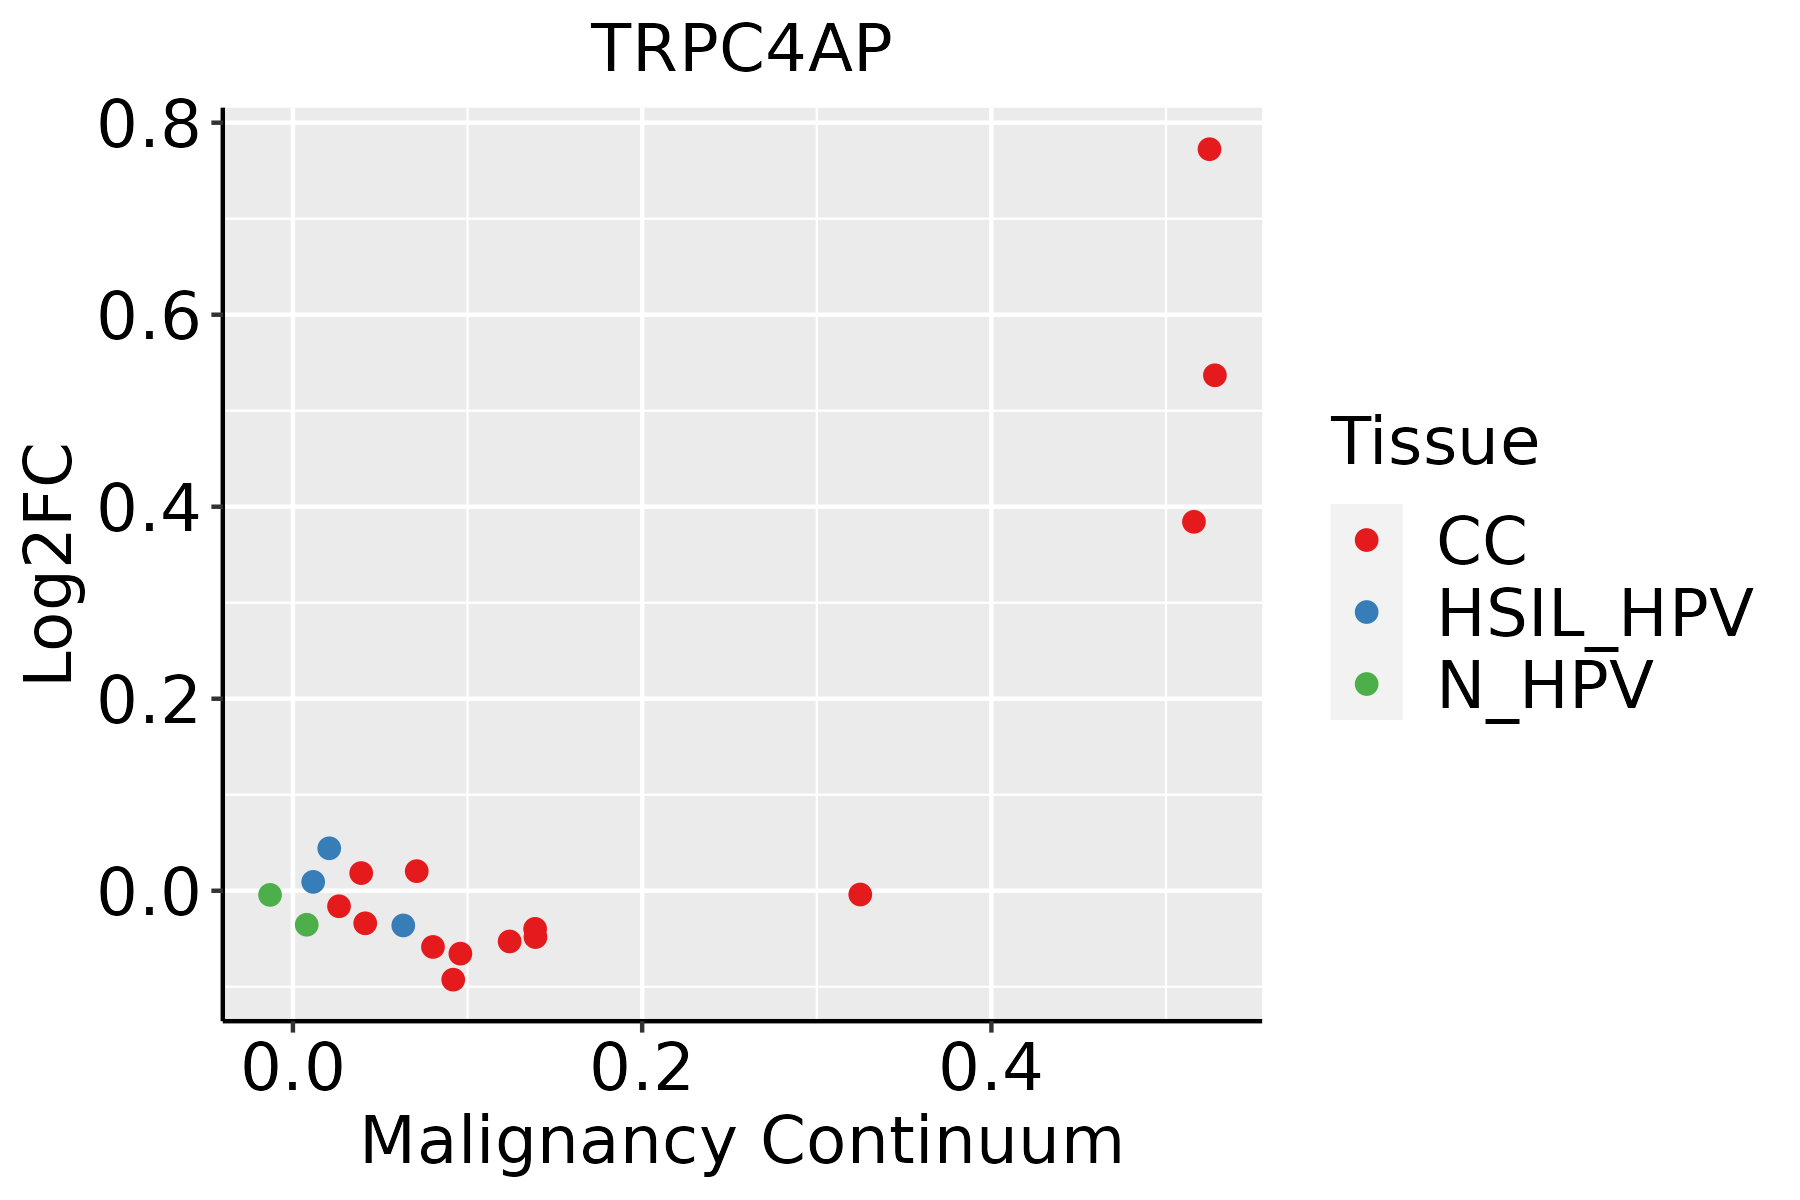 | CC: Cervix cancer |
| HSIL_HPV: HPV-infected high-grade squamous intraepithelial lesions |
| N_HPV: HPV-infected normal cervix |
| Esophagus | 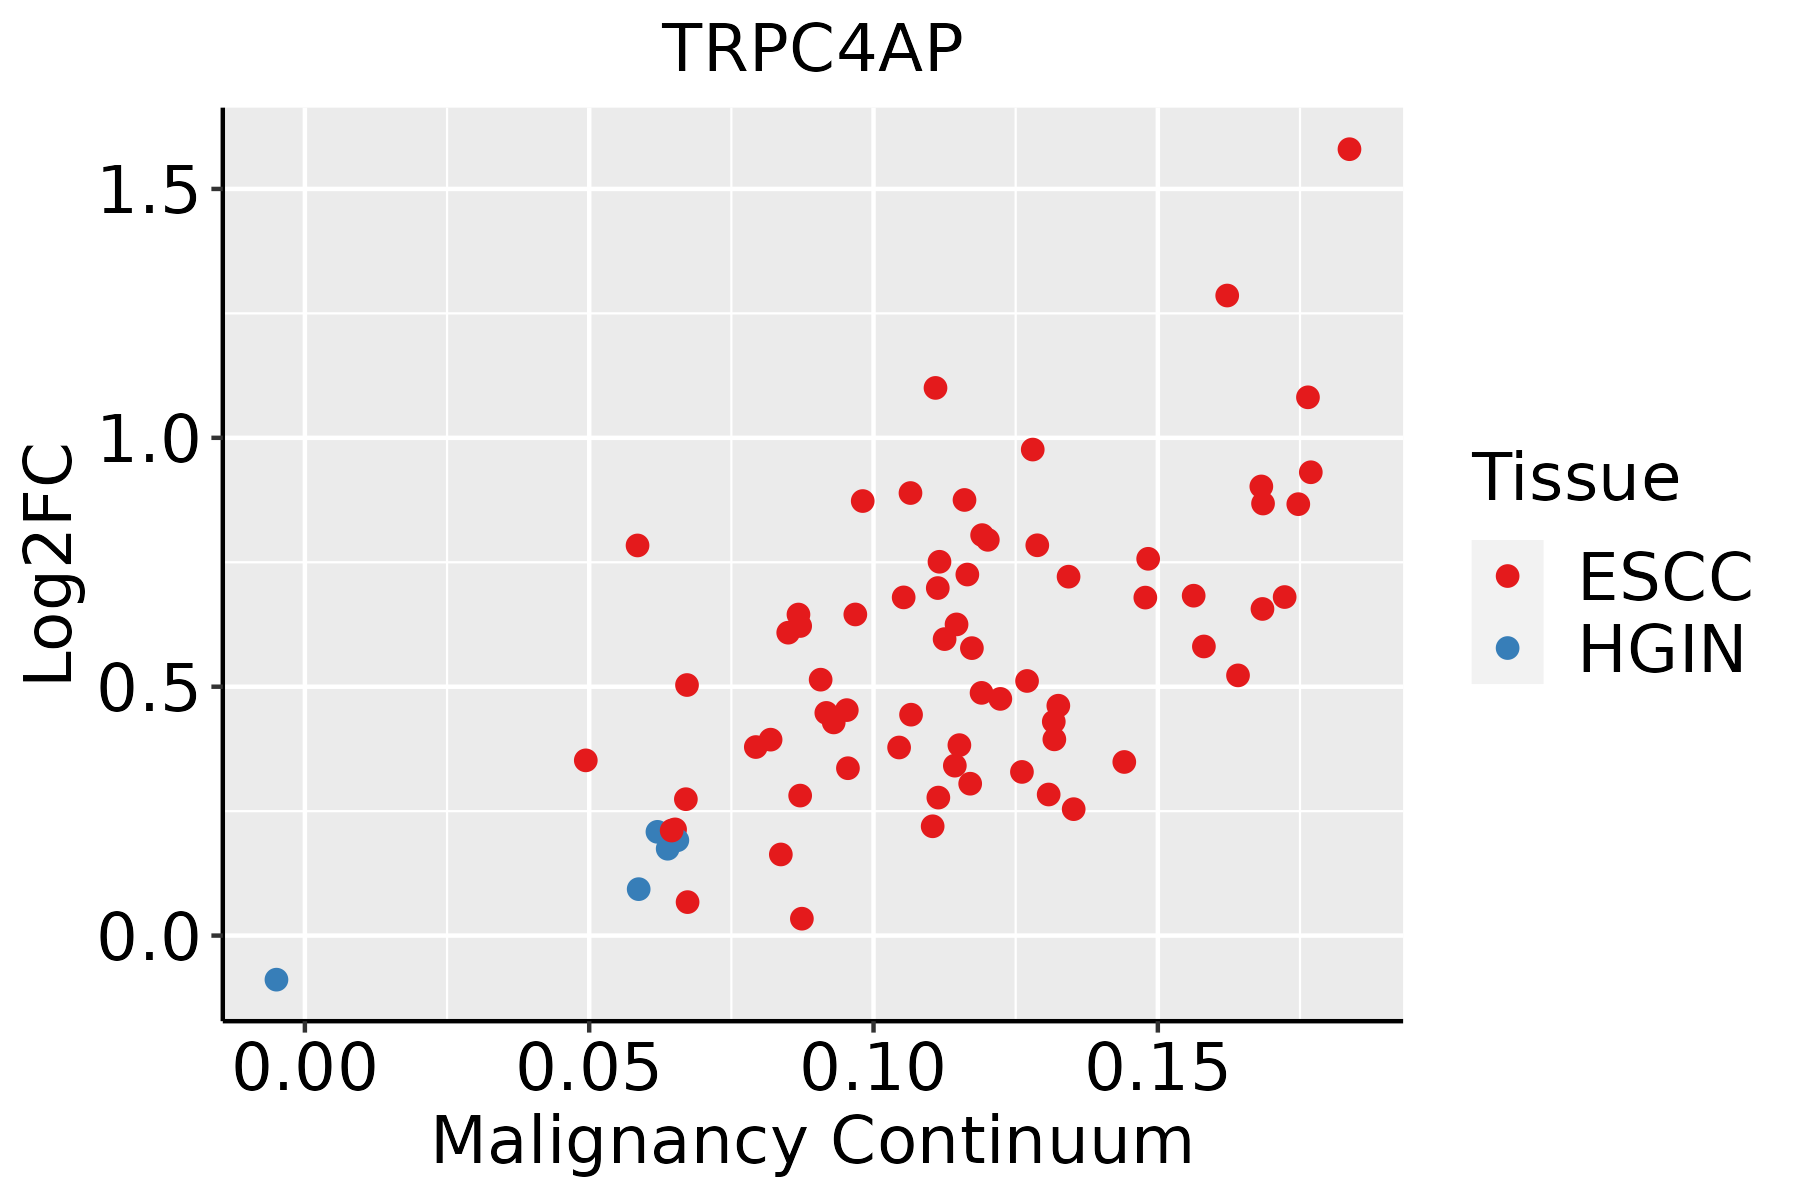 | ESCC: Esophageal squamous cell carcinoma |
| HGIN: High-grade intraepithelial neoplasias |
| LGIN: Low-grade intraepithelial neoplasias |
| Liver | 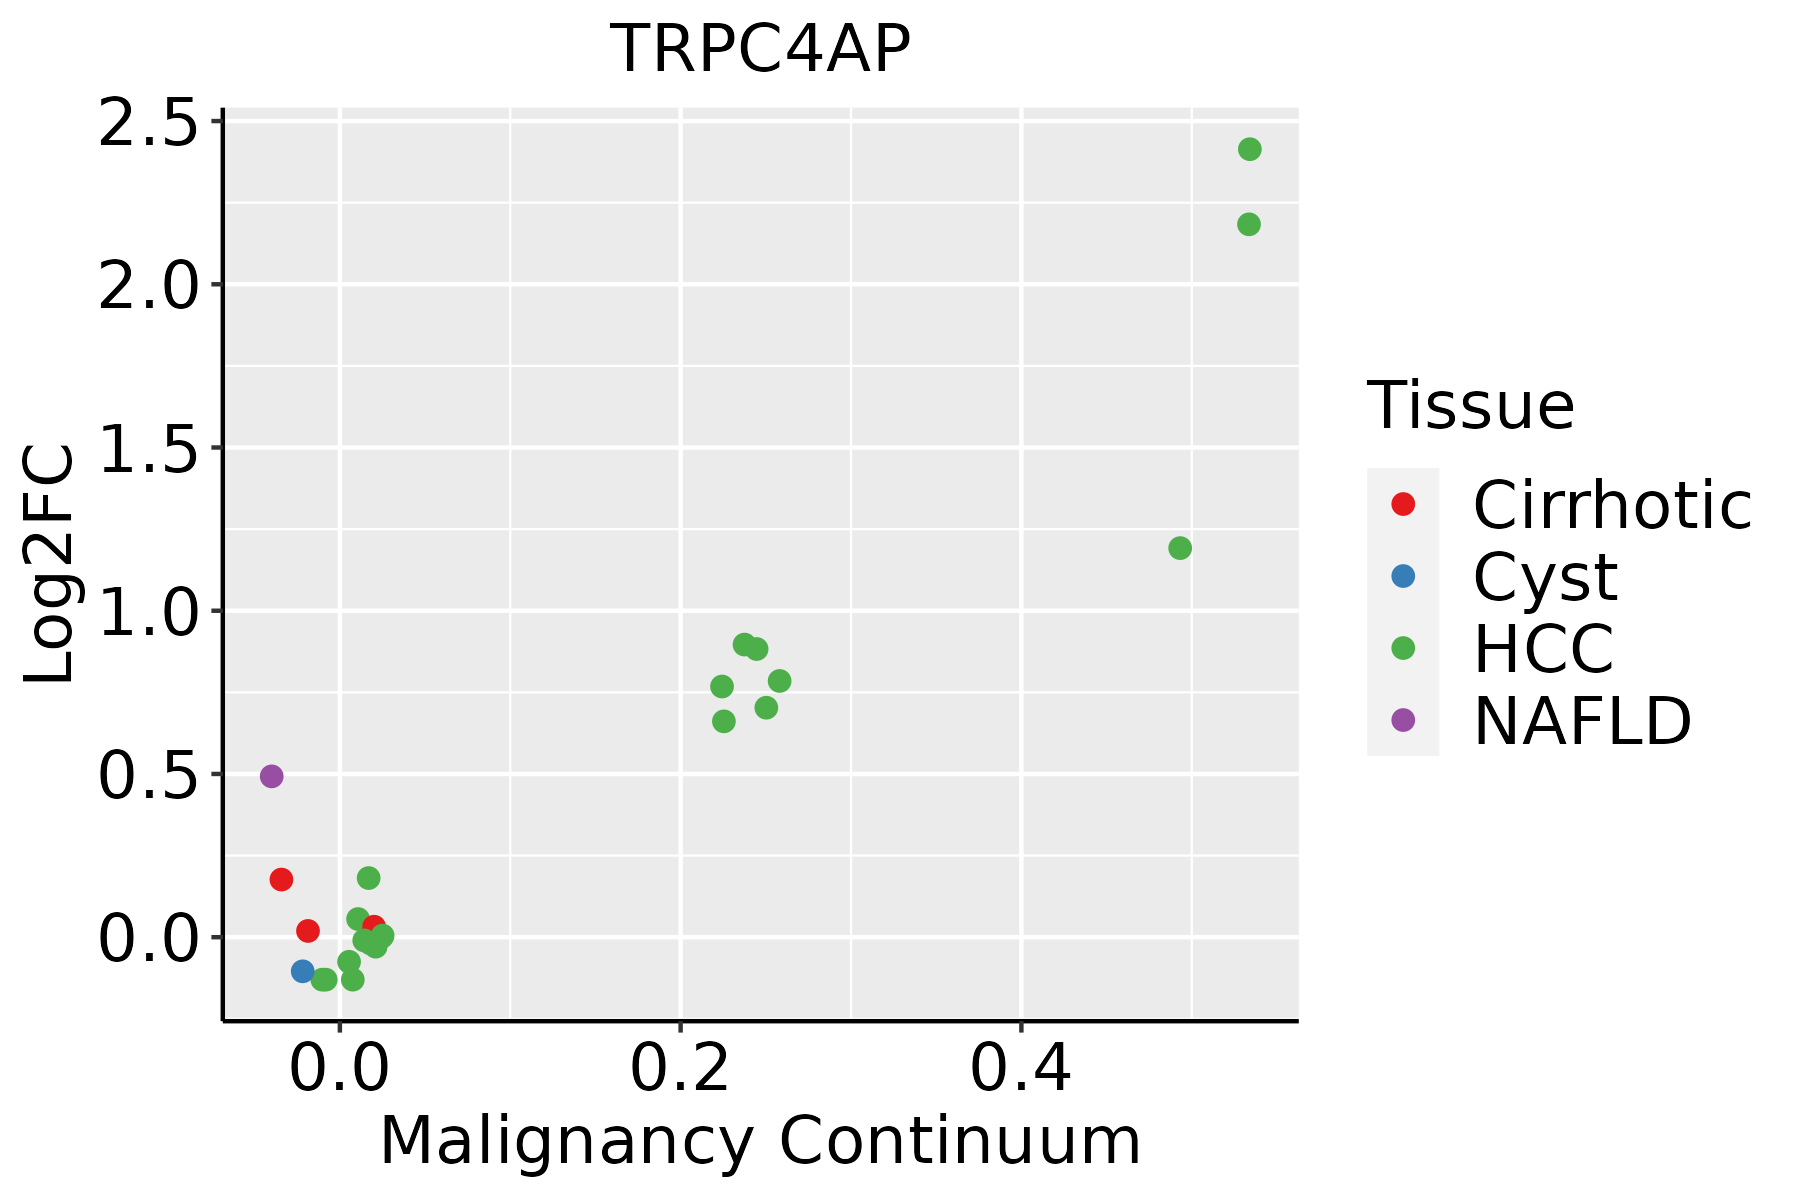 | HCC: Hepatocellular carcinoma |
| NAFLD: Non-alcoholic fatty liver disease |
| Lung | 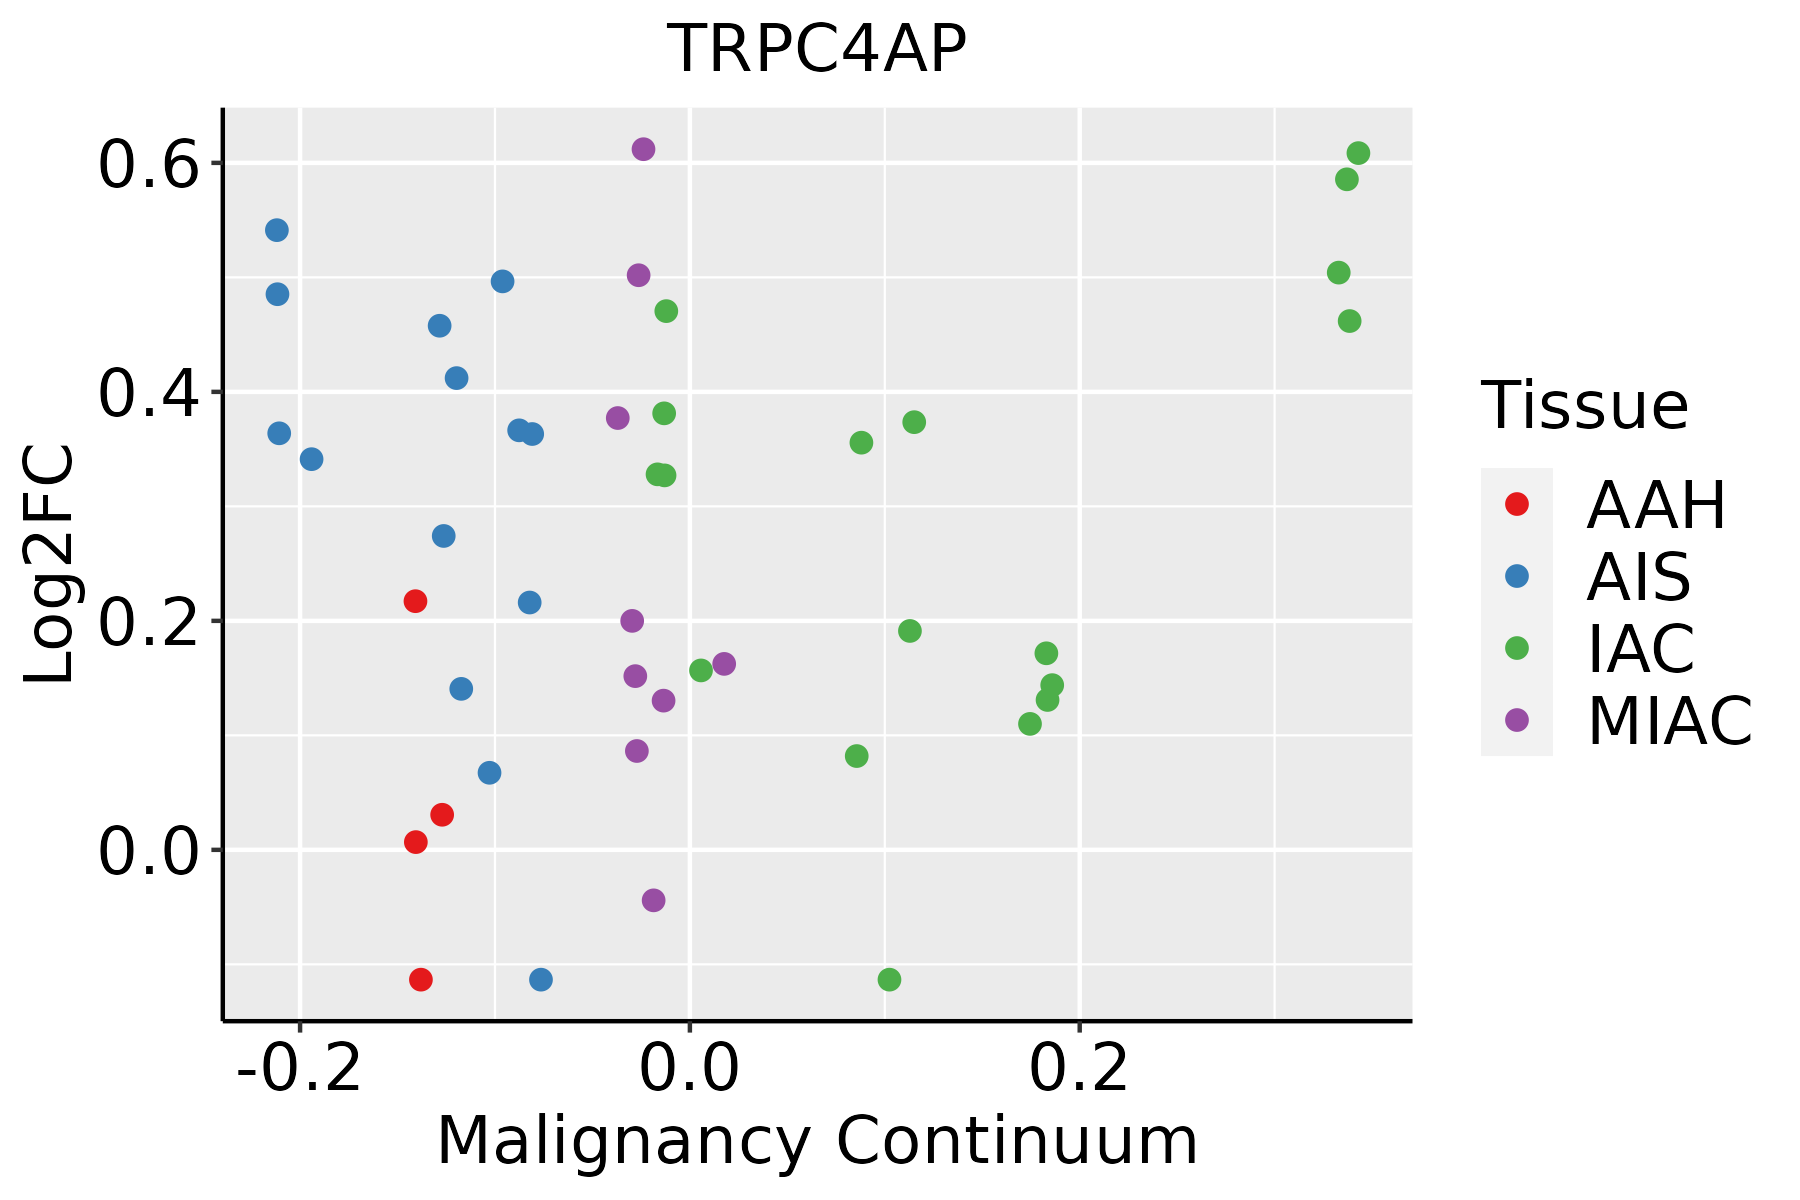 | AAH: Atypical adenomatous hyperplasia |
| AIS: Adenocarcinoma in situ |
| IAC: Invasive lung adenocarcinoma |
| MIA: Minimally invasive adenocarcinoma |
| Oral Cavity |  | EOLP: Erosive Oral lichen planus |
| LP: leukoplakia |
| NEOLP: Non-erosive oral lichen planus |
| OSCC: Oral squamous cell carcinoma |
| Prostate | 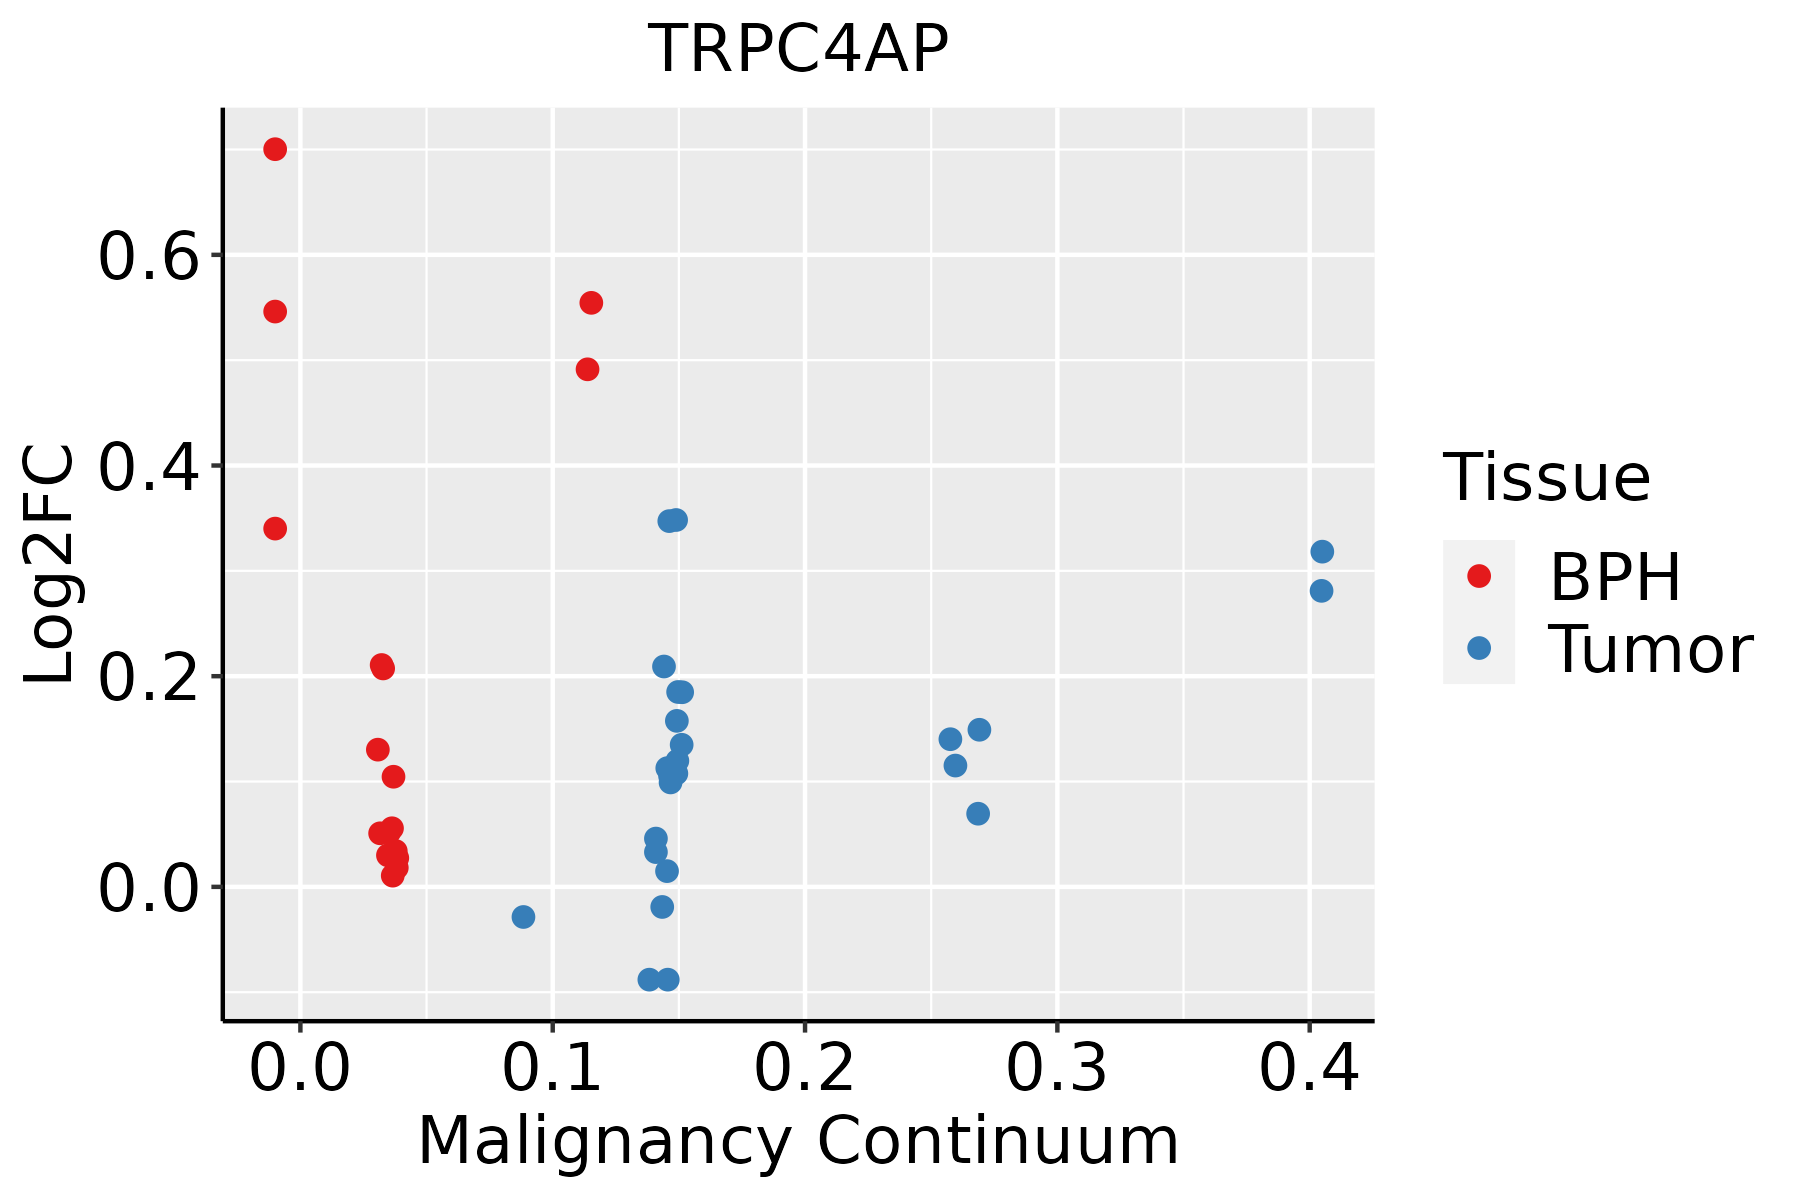 | BPH: Benign Prostatic Hyperplasia |
| Skin | 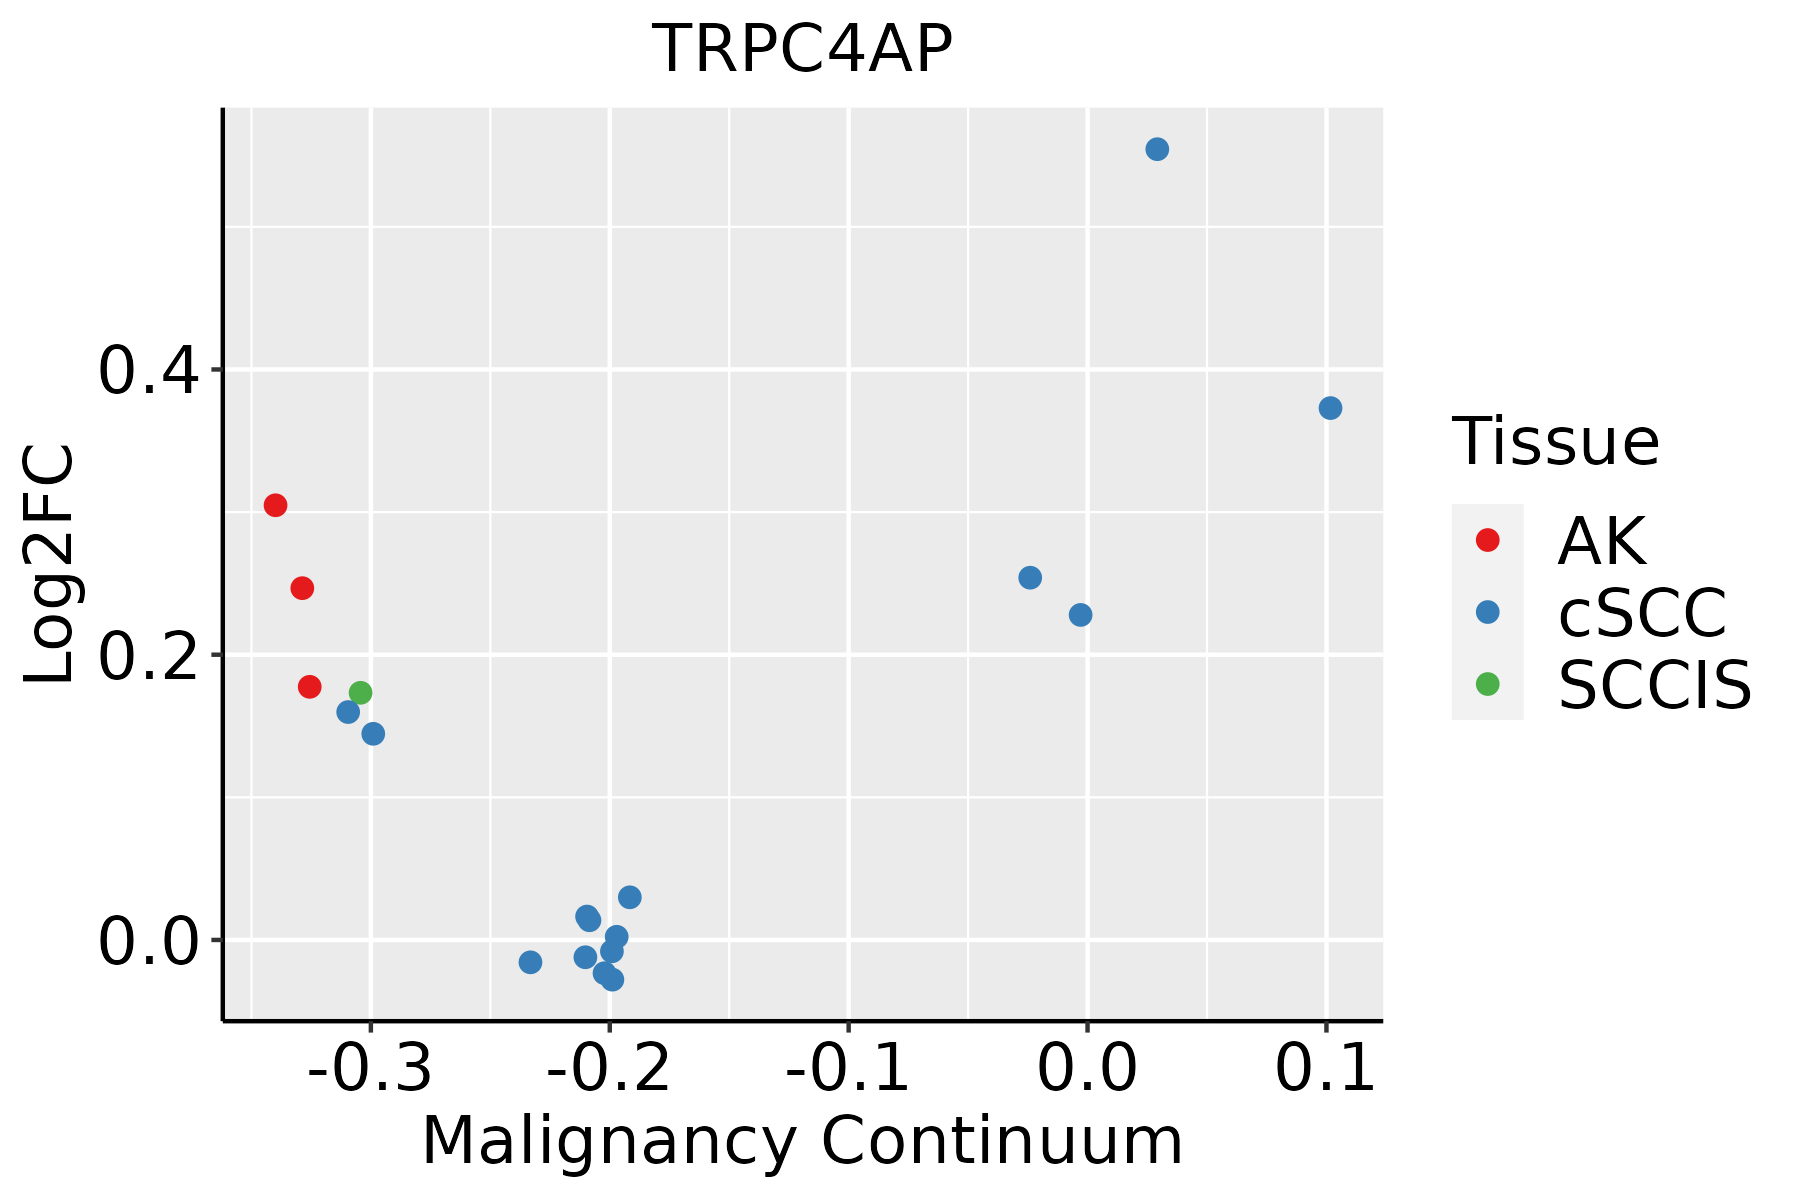 | AK: Actinic keratosis |
| cSCC: Cutaneous squamous cell carcinoma |
| SCCIS:squamous cell carcinoma in situ |
| Thyroid | 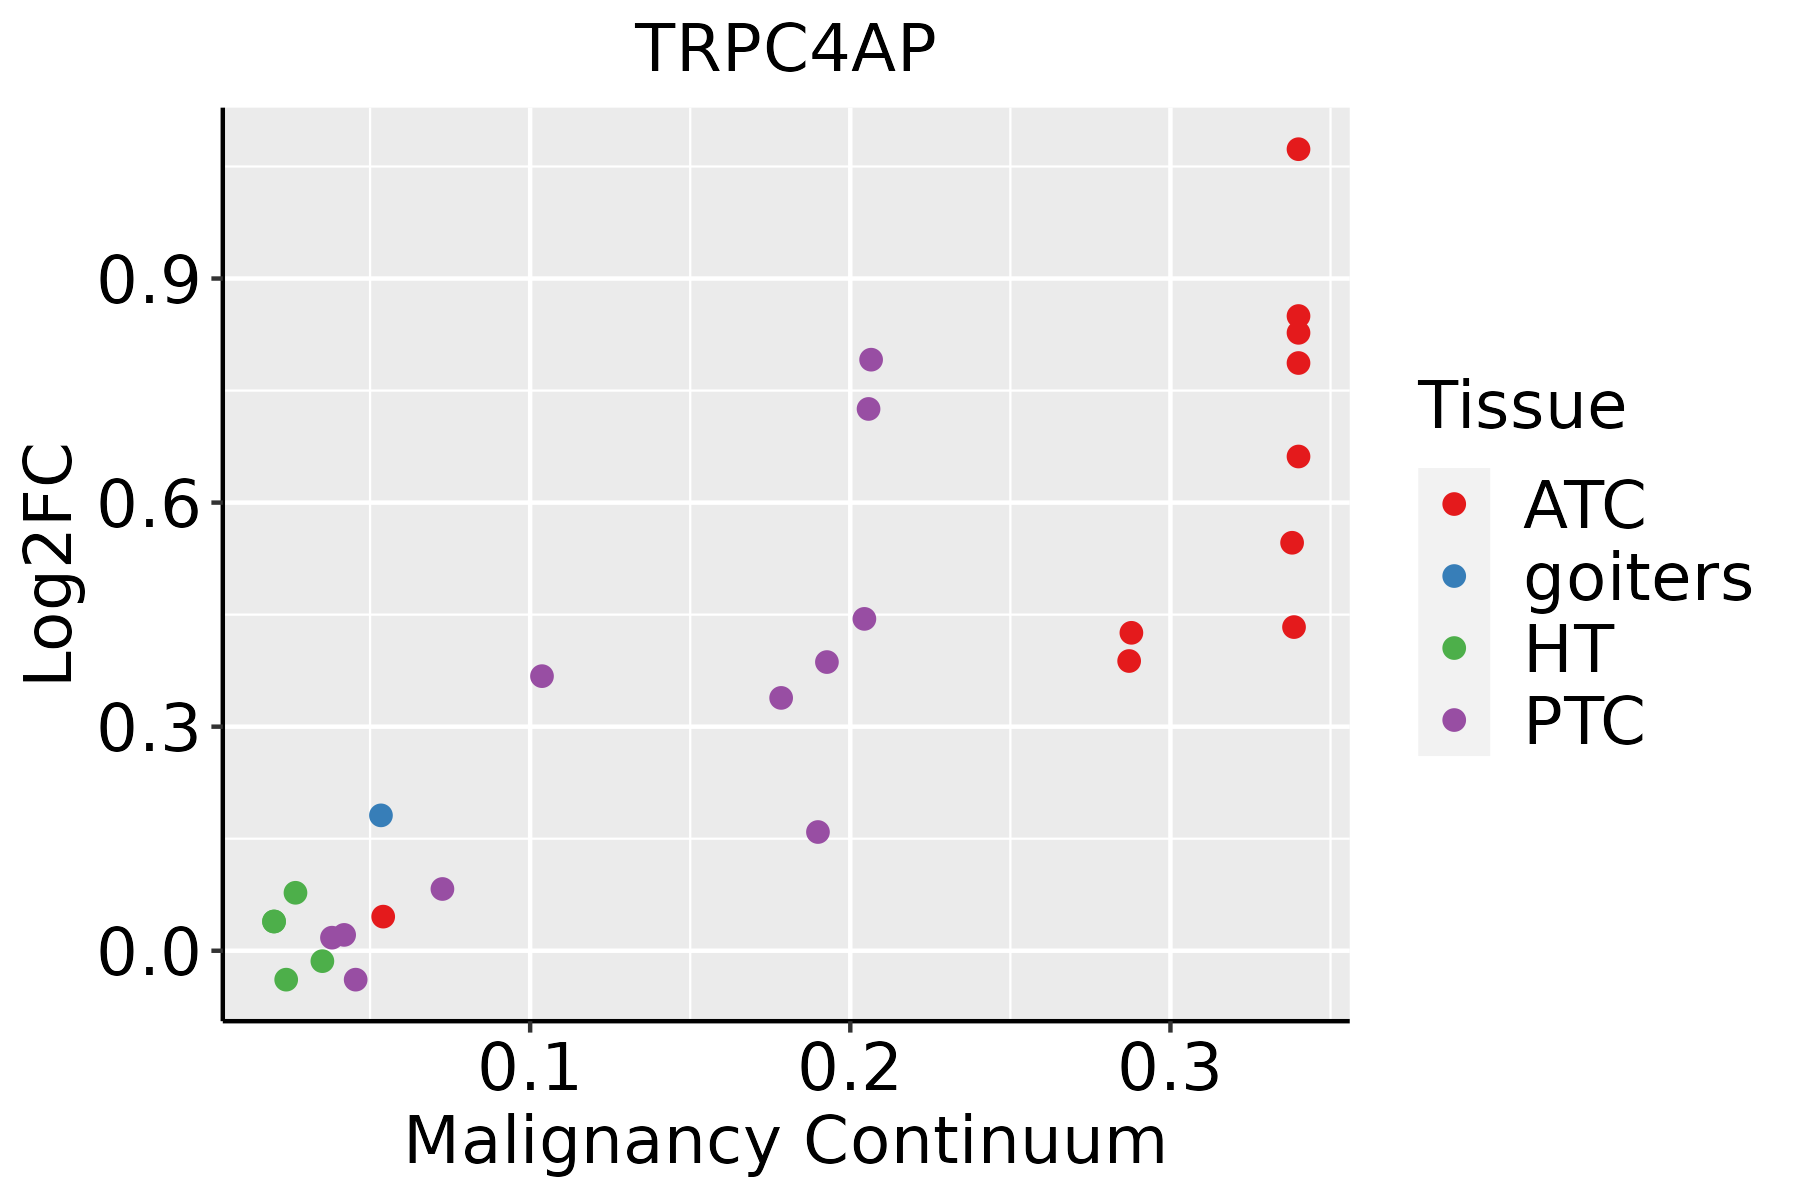 | ATC: Anaplastic thyroid cancer |
| HT: Hashimoto's thyroiditis |
| PTC: Papillary thyroid cancer |
| GO ID | Tissue | Disease Stage | Description | Gene Ratio | Bg Ratio | pvalue | p.adjust | Count |
| GO:00085446 | Cervix | CC | epidermis development | 83/2311 | 324/18723 | 3.91e-11 | 8.54e-09 | 83 |
| GO:00435884 | Cervix | CC | skin development | 71/2311 | 263/18723 | 8.04e-11 | 1.46e-08 | 71 |
| GO:001049810 | Cervix | CC | proteasomal protein catabolic process | 111/2311 | 490/18723 | 8.98e-11 | 1.58e-08 | 111 |
| GO:004316110 | Cervix | CC | proteasome-mediated ubiquitin-dependent protein catabolic process | 91/2311 | 412/18723 | 1.65e-08 | 1.25e-06 | 91 |
| GO:001049826 | Esophagus | HGIN | proteasomal protein catabolic process | 139/2587 | 490/18723 | 1.20e-17 | 3.41e-15 | 139 |
| GO:004316126 | Esophagus | HGIN | proteasome-mediated ubiquitin-dependent protein catabolic process | 114/2587 | 412/18723 | 7.00e-14 | 1.20e-11 | 114 |
| GO:0010498111 | Esophagus | ESCC | proteasomal protein catabolic process | 369/8552 | 490/18723 | 1.13e-41 | 1.80e-38 | 369 |
| GO:0043161111 | Esophagus | ESCC | proteasome-mediated ubiquitin-dependent protein catabolic process | 312/8552 | 412/18723 | 3.53e-36 | 4.48e-33 | 312 |
| GO:00435888 | Esophagus | ESCC | skin development | 163/8552 | 263/18723 | 6.48e-08 | 1.14e-06 | 163 |
| GO:000854410 | Esophagus | ESCC | epidermis development | 193/8552 | 324/18723 | 2.87e-07 | 4.19e-06 | 193 |
| GO:00224043 | Esophagus | ESCC | molting cycle process | 53/8552 | 84/18723 | 9.62e-04 | 4.88e-03 | 53 |
| GO:00224053 | Esophagus | ESCC | hair cycle process | 53/8552 | 84/18723 | 9.62e-04 | 4.88e-03 | 53 |
| GO:0001942 | Esophagus | ESCC | hair follicle development | 51/8552 | 81/18723 | 1.27e-03 | 6.14e-03 | 51 |
| GO:0098773 | Esophagus | ESCC | skin epidermis development | 53/8552 | 85/18723 | 1.43e-03 | 6.77e-03 | 53 |
| GO:00423033 | Esophagus | ESCC | molting cycle | 64/8552 | 107/18723 | 2.24e-03 | 9.85e-03 | 64 |
| GO:00426333 | Esophagus | ESCC | hair cycle | 64/8552 | 107/18723 | 2.24e-03 | 9.85e-03 | 64 |
| GO:00488201 | Esophagus | ESCC | hair follicle maturation | 11/8552 | 13/18723 | 4.76e-03 | 1.85e-02 | 11 |
| GO:00431617 | Liver | NAFLD | proteasome-mediated ubiquitin-dependent protein catabolic process | 91/1882 | 412/18723 | 3.00e-13 | 1.75e-10 | 91 |
| GO:00104987 | Liver | NAFLD | proteasomal protein catabolic process | 101/1882 | 490/18723 | 1.35e-12 | 6.09e-10 | 101 |
| GO:001049822 | Liver | HCC | proteasomal protein catabolic process | 351/7958 | 490/18723 | 6.92e-40 | 1.46e-36 | 351 |
| Hugo Symbol | Variant Class | Variant Classification | dbSNP RS | HGVSc | HGVSp | HGVSp Short | SWISSPROT | BIOTYPE | SIFT | PolyPhen | Tumor Sample Barcode | Tissue | Histology | Sex | Age | Stage | Therapy Types | Drugs | Outcome |
| TRPC4AP | SNV | Missense_Mutation | novel | c.2123N>C | p.Tyr708Ser | p.Y708S | Q8TEL6 | protein_coding | deleterious(0.01) | probably_damaging(0.999) | TCGA-A2-A25A-01 | Breast | breast invasive carcinoma | Female | <65 | I/II | Unspecific | Cytoxan | SD |
| TRPC4AP | SNV | Missense_Mutation | novel | c.1885N>A | p.Arg629Ser | p.R629S | Q8TEL6 | protein_coding | deleterious(0) | probably_damaging(0.999) | TCGA-A2-A25A-01 | Breast | breast invasive carcinoma | Female | <65 | I/II | Unspecific | Cytoxan | SD |
| TRPC4AP | SNV | Missense_Mutation | | c.1057N>G | p.Ile353Val | p.I353V | Q8TEL6 | protein_coding | tolerated(1) | benign(0) | TCGA-AO-A0J9-01 | Breast | breast invasive carcinoma | Female | <65 | III/IV | Chemotherapy | cyclophosphamide | PD |
| TRPC4AP | SNV | Missense_Mutation | | c.1360N>A | p.Leu454Met | p.L454M | Q8TEL6 | protein_coding | deleterious(0.01) | probably_damaging(0.93) | TCGA-BH-A0C0-01 | Breast | breast invasive carcinoma | Female | <65 | I/II | Chemotherapy | carboplatin | SD |
| TRPC4AP | SNV | Missense_Mutation | rs11552601 | c.2140N>T | p.Arg714Trp | p.R714W | Q8TEL6 | protein_coding | deleterious(0) | possibly_damaging(0.663) | TCGA-C8-A3M7-01 | Breast | breast invasive carcinoma | Female | <65 | III/IV | Unknown | Unknown | PD |
| TRPC4AP | SNV | Missense_Mutation | novel | c.469N>G | p.Lys157Glu | p.K157E | Q8TEL6 | protein_coding | tolerated(0.26) | benign(0.037) | TCGA-E9-A3HO-01 | Breast | breast invasive carcinoma | Female | <65 | I/II | Chemotherapy | cyclophosphamide | CR |
| TRPC4AP | deletion | In_Frame_Del | | c.1491_1493delNNN | p.Glu497_Ala498delinsAsp | p.E497_A498delinsD | Q8TEL6 | protein_coding | | | TCGA-BH-A0GY-01 | Breast | breast invasive carcinoma | Female | >=65 | I/II | Chemotherapy | cyotxan | SD |
| TRPC4AP | deletion | Frame_Shift_Del | novel | c.1376delN | p.Leu459Ter | p.L459* | Q8TEL6 | protein_coding | | | TCGA-D8-A27V-01 | Breast | breast invasive carcinoma | Female | <65 | I/II | Hormone Therapy | tamoxiphen | SD |
| TRPC4AP | SNV | Missense_Mutation | | c.1724C>T | p.Ser575Leu | p.S575L | Q8TEL6 | protein_coding | tolerated(0.1) | probably_damaging(0.977) | TCGA-C5-A1MJ-01 | Cervix | cervical & endocervical cancer | Female | <65 | I/II | Unknown | Unknown | SD |
| TRPC4AP | SNV | Missense_Mutation | | c.1226N>A | p.Arg409Lys | p.R409K | Q8TEL6 | protein_coding | tolerated(0.77) | benign(0.001) | TCGA-EK-A2RA-01 | Cervix | cervical & endocervical cancer | Female | >=65 | I/II | Unknown | Unknown | SD |


