
|
|||||
|
 | |
| |
| |
| |
| |
| |
|
Gene: TMEM248 |
Gene summary for TMEM248 |
| Gene information | Species | Human | Gene symbol | TMEM248 | Gene ID | 55069 |
| Gene name | transmembrane protein 248 | |
| Gene Alias | C7orf42 | |
| Cytomap | 7q11.21 | |
| Gene Type | protein-coding | GO ID | GO:0005575 | UniProtAcc | A0A024RDK7 |
Top |
Malignant transformation analysis |
| Identification of the aberrant gene expression in precancerous and cancerous lesions by comparing the gene expression of stem-like cells in diseased tissues with normal stem cells |
| Entrez ID | Symbol | Replicates | Species | Organ | Tissue | Adj P-value | Log2FC | Malignancy |
| 55069 | TMEM248 | C08 | Human | Oral cavity | OSCC | 5.17e-47 | 1.02e+00 | 0.1919 |
| 55069 | TMEM248 | C09 | Human | Oral cavity | OSCC | 2.30e-07 | 4.83e-01 | 0.1431 |
| 55069 | TMEM248 | LN38 | Human | Oral cavity | OSCC | 3.21e-02 | 1.13e+00 | 0.168 |
| 55069 | TMEM248 | LN46 | Human | Oral cavity | OSCC | 4.25e-06 | 5.56e-01 | 0.1666 |
| 55069 | TMEM248 | LP15 | Human | Oral cavity | LP | 1.97e-02 | 1.14e+00 | 0.2174 |
| 55069 | TMEM248 | LP17 | Human | Oral cavity | LP | 1.94e-03 | 9.25e-01 | 0.2349 |
| 55069 | TMEM248 | EOLP-1 | Human | Oral cavity | EOLP | 1.56e-02 | 6.45e-02 | -0.0202 |
| 55069 | TMEM248 | SYSMH1 | Human | Oral cavity | OSCC | 6.60e-21 | 5.28e-01 | 0.1127 |
| 55069 | TMEM248 | SYSMH2 | Human | Oral cavity | OSCC | 1.61e-08 | 4.17e-01 | 0.2326 |
| 55069 | TMEM248 | SYSMH3 | Human | Oral cavity | OSCC | 1.10e-12 | 4.81e-01 | 0.2442 |
| 55069 | TMEM248 | SYSMH4 | Human | Oral cavity | OSCC | 1.19e-03 | 1.76e-02 | 0.1226 |
| 55069 | TMEM248 | SYSMH5 | Human | Oral cavity | OSCC | 3.53e-04 | 4.96e-02 | 0.0647 |
| 55069 | TMEM248 | SYSMH6 | Human | Oral cavity | OSCC | 2.17e-14 | 4.06e-01 | 0.1275 |
| 55069 | TMEM248 | P4_S8_cSCC | Human | Skin | cSCC | 6.73e-04 | 9.13e-03 | -0.3095 |
| 55069 | TMEM248 | P1_cSCC | Human | Skin | cSCC | 2.93e-11 | 5.98e-01 | 0.0292 |
| 55069 | TMEM248 | P2_cSCC | Human | Skin | cSCC | 3.09e-03 | 2.50e-01 | -0.024 |
| 55069 | TMEM248 | P4_cSCC | Human | Skin | cSCC | 4.74e-02 | 3.14e-01 | -0.00290000000000005 |
| 55069 | TMEM248 | P10_cSCC | Human | Skin | cSCC | 4.23e-15 | 7.27e-01 | 0.1017 |
| 55069 | TMEM248 | male-WTA | Human | Thyroid | PTC | 5.36e-49 | 4.73e-01 | 0.1037 |
| 55069 | TMEM248 | PTC01 | Human | Thyroid | PTC | 1.99e-10 | 2.71e-01 | 0.1899 |
| Page: 1 2 3 4 5 6 7 8 |
| Tissue | Expression Dynamics | Abbreviation |
| Colorectum (GSE201348) |  | FAP: Familial adenomatous polyposis |
| CRC: Colorectal cancer | ||
| Colorectum (HTA11) |  | AD: Adenomas |
| SER: Sessile serrated lesions | ||
| MSI-H: Microsatellite-high colorectal cancer | ||
| MSS: Microsatellite stable colorectal cancer | ||
| Esophagus |  | ESCC: Esophageal squamous cell carcinoma |
| HGIN: High-grade intraepithelial neoplasias | ||
| LGIN: Low-grade intraepithelial neoplasias | ||
| Liver |  | HCC: Hepatocellular carcinoma |
| NAFLD: Non-alcoholic fatty liver disease | ||
| Oral Cavity | 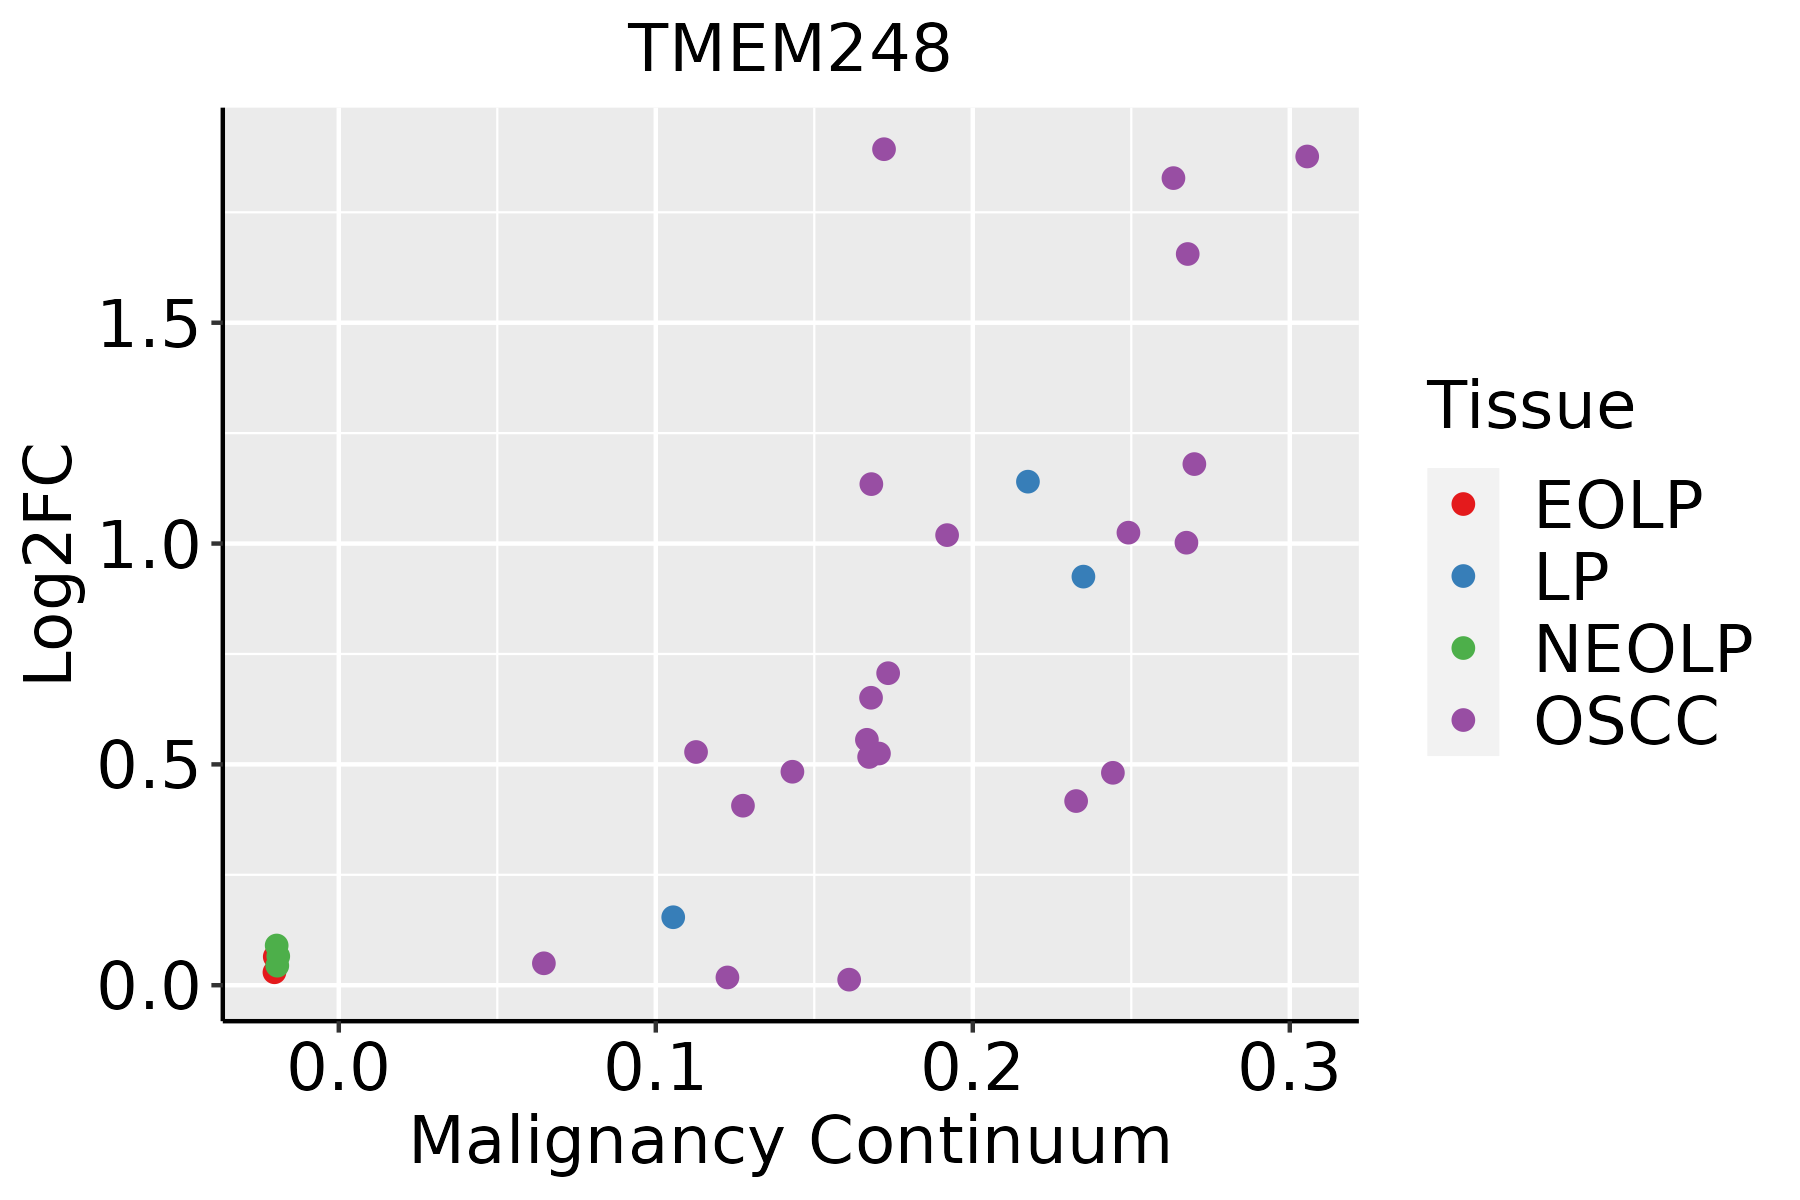 | EOLP: Erosive Oral lichen planus |
| LP: leukoplakia | ||
| NEOLP: Non-erosive oral lichen planus | ||
| OSCC: Oral squamous cell carcinoma | ||
| Prostate | 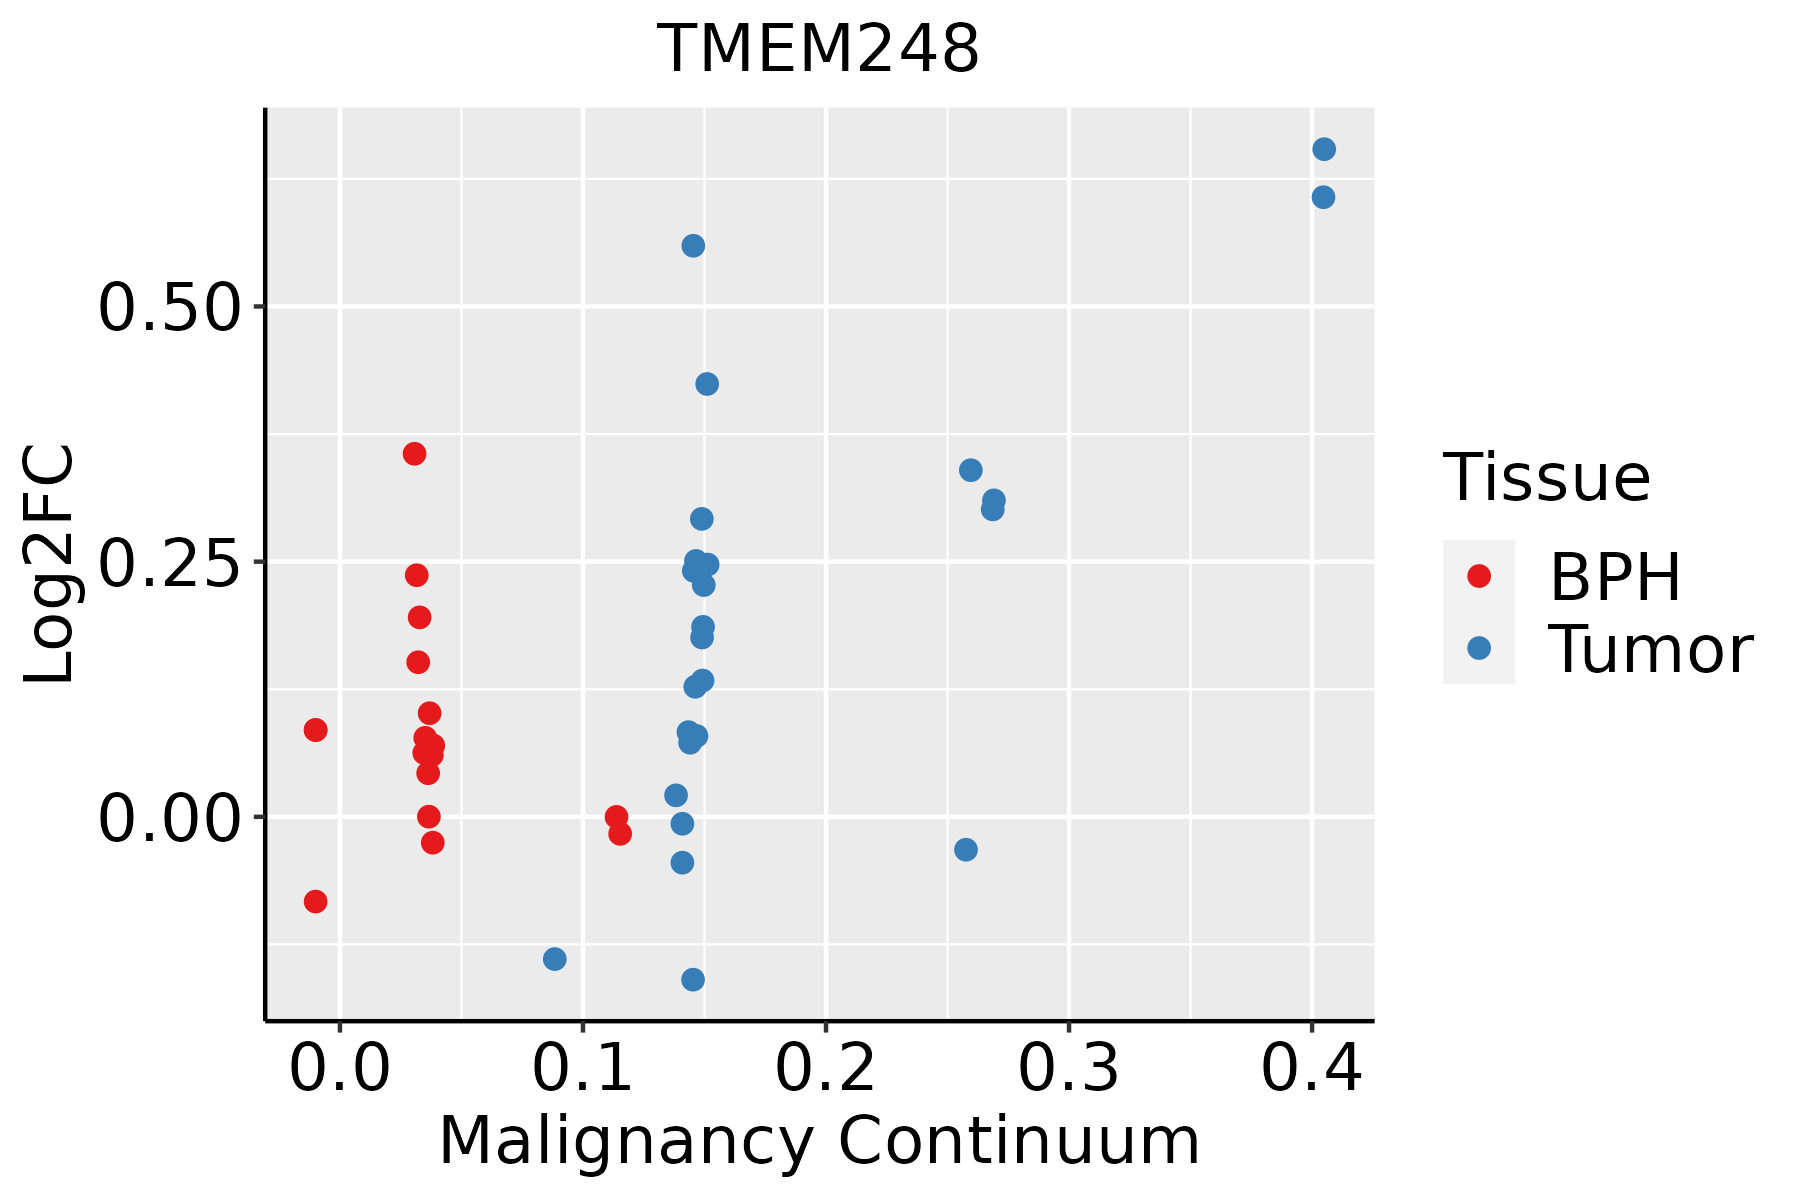 | BPH: Benign Prostatic Hyperplasia |
| Skin | 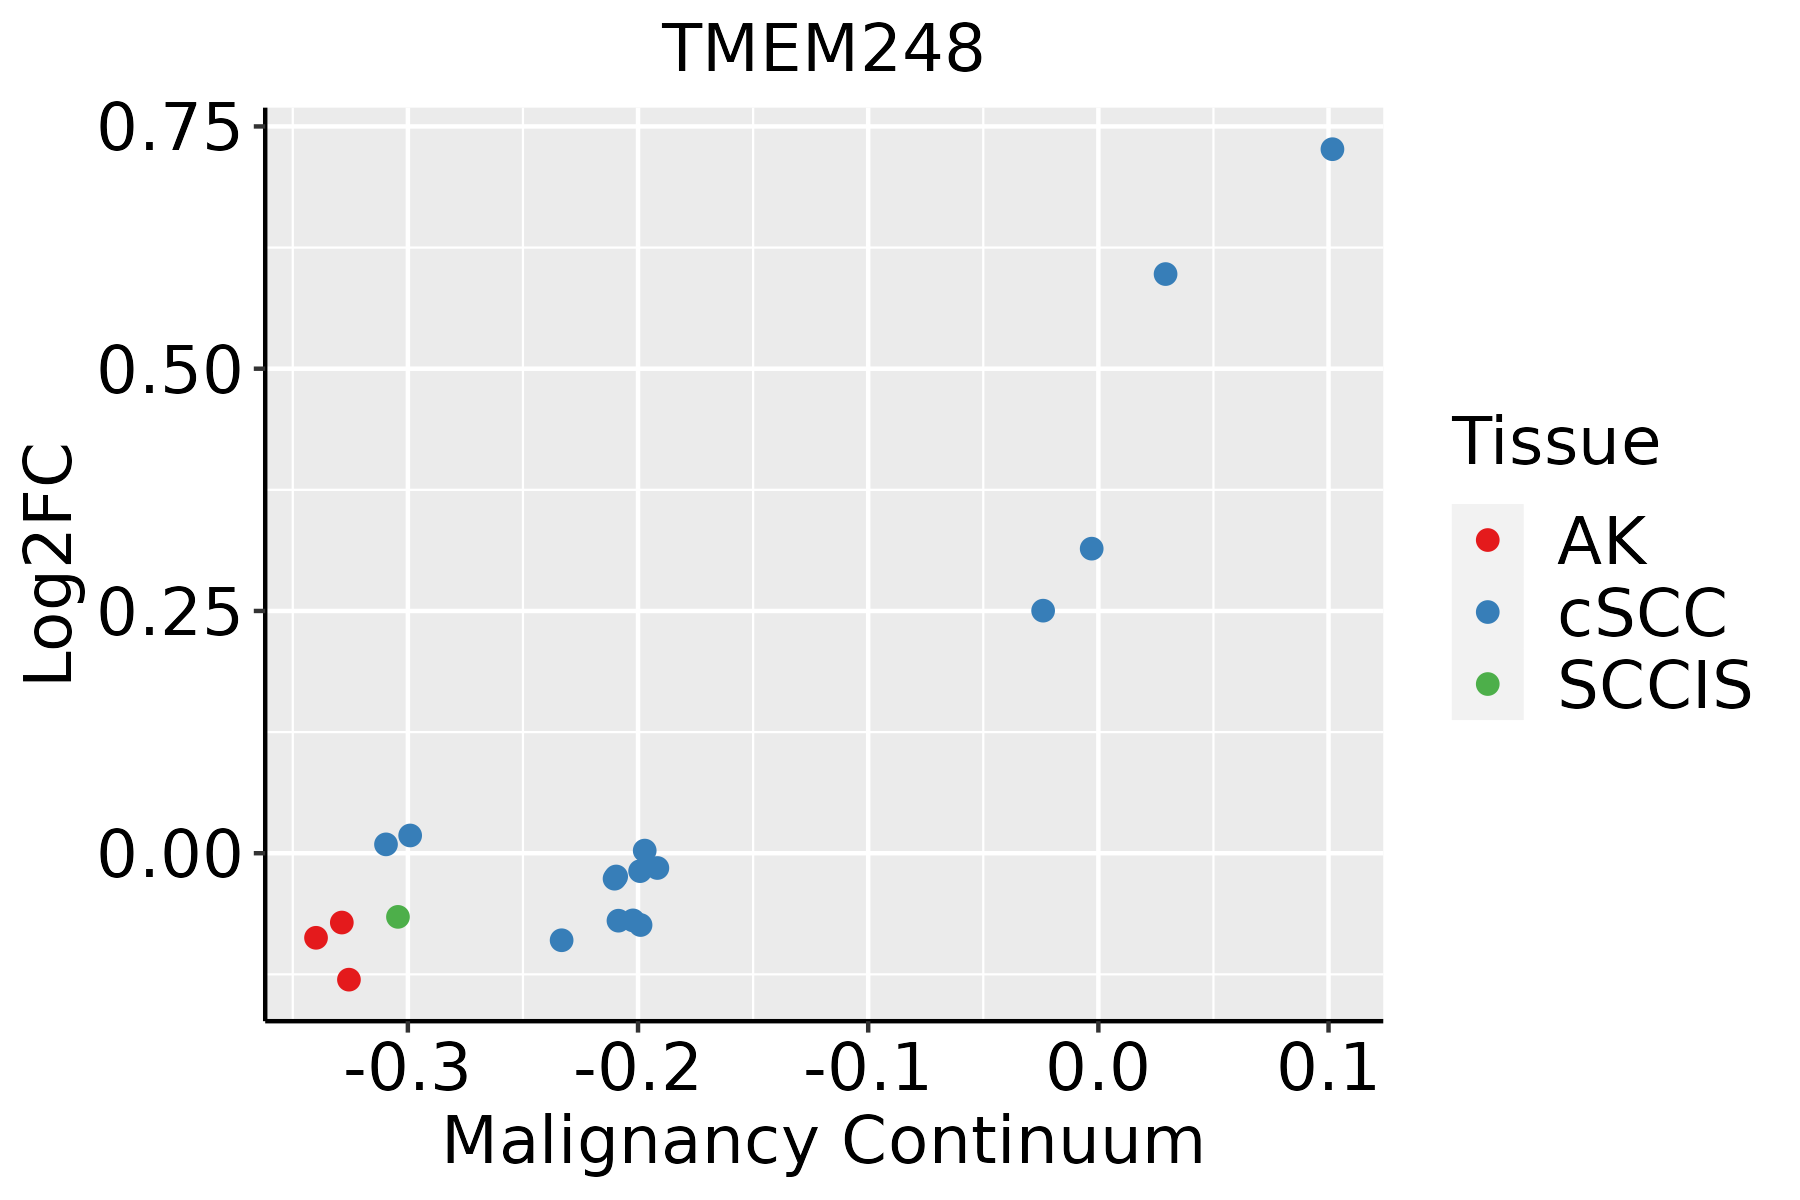 | AK: Actinic keratosis |
| cSCC: Cutaneous squamous cell carcinoma | ||
| SCCIS:squamous cell carcinoma in situ | ||
| Thyroid | 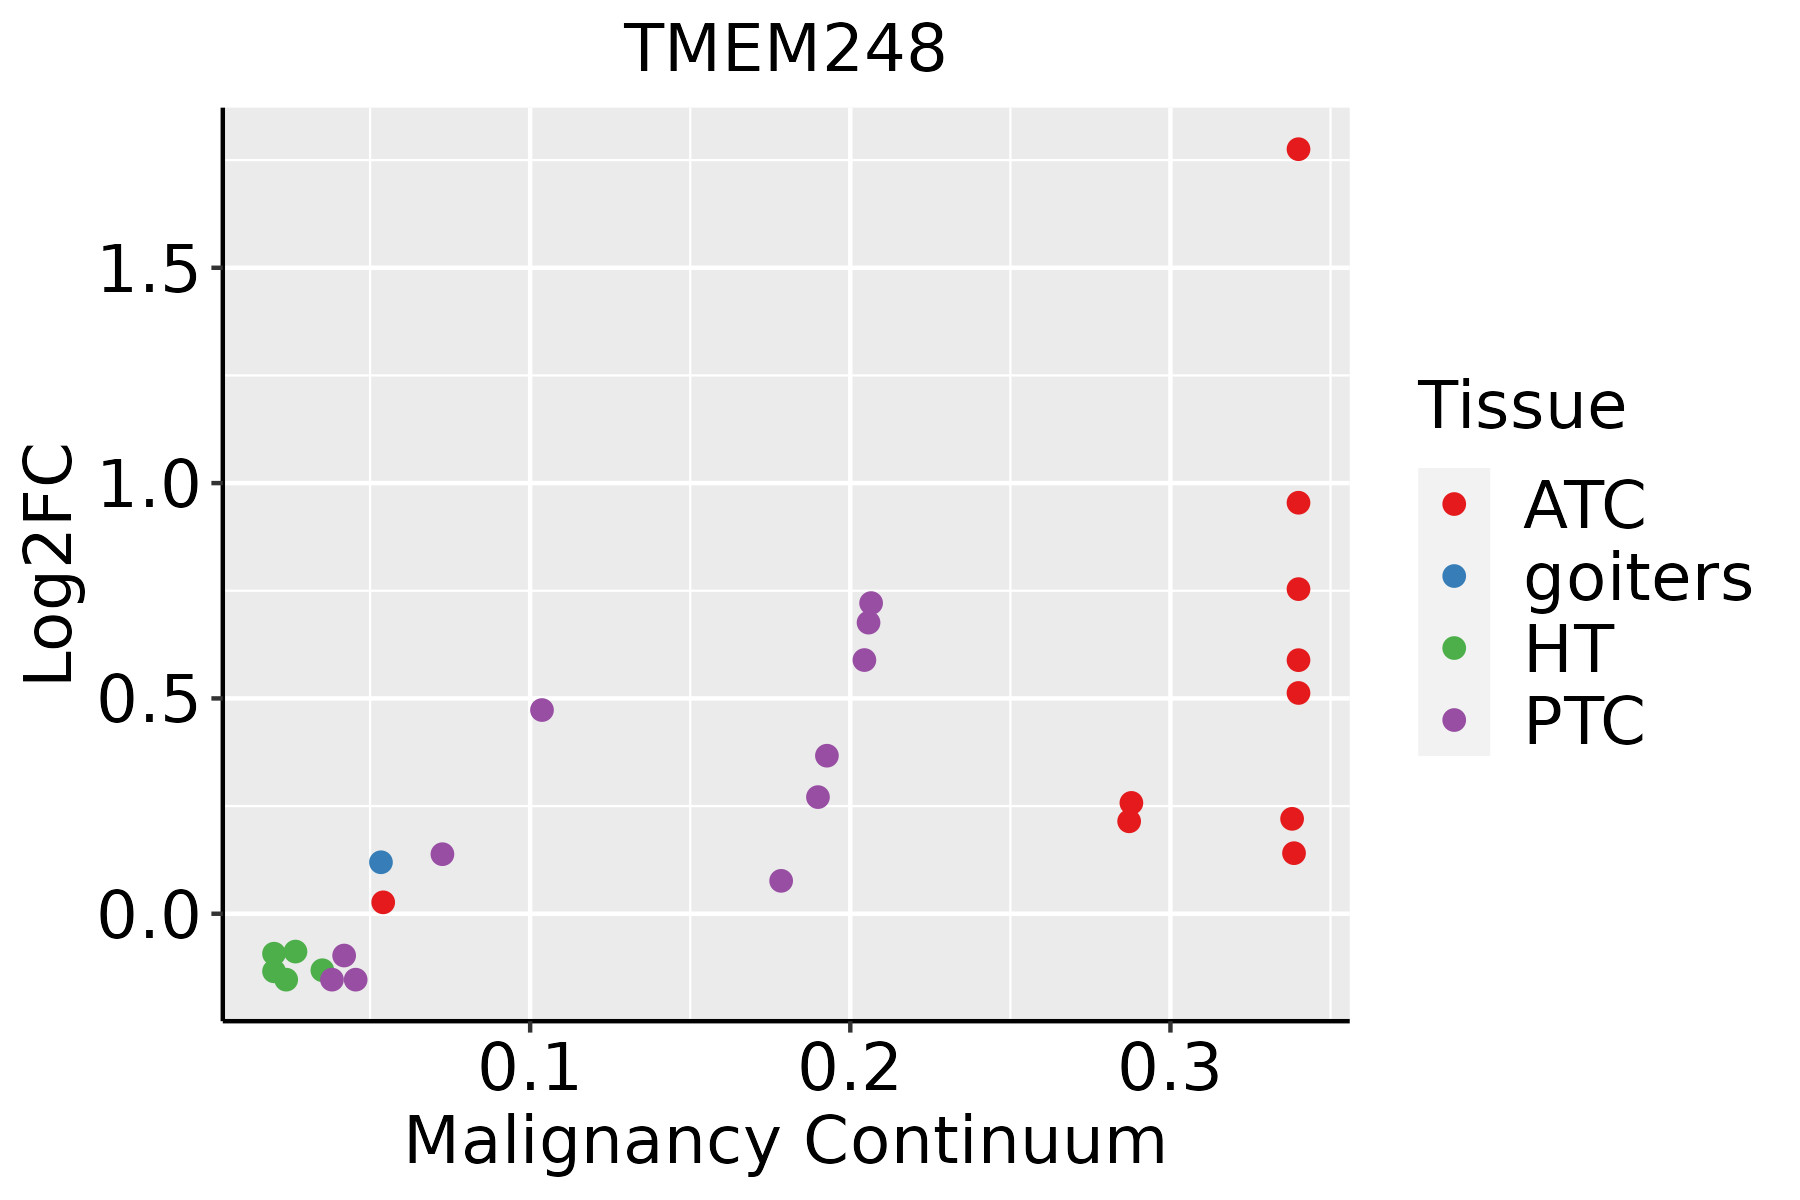 | ATC: Anaplastic thyroid cancer |
| HT: Hashimoto's thyroiditis | ||
| PTC: Papillary thyroid cancer |
| ∗log2FC in expression of this searched gene in stem-like cells from each diseased tissue sample relative to stem-like cells in normal samples in each tissue plotted against the malignancy continuum. Samples are colored based on if they are from different disease stage. |
Top |
Malignant transformation related pathway analysis |
| Find out the enriched GO biological processes and KEGG pathways involved in transition from healthy to precancer to cancer |
| Tissue | Disease Stage | Enriched GO biological Processes |
| Colorectum | AD |  |
| Colorectum | SER |  |
| Colorectum | MSS |  |
| Colorectum | MSI-H |  |
| Colorectum | FAP |  |
| ∗Top 15 enriched GO BP terms are showed in the bar plot of each disease state in each tissue. Each row represents a significant GO biological process which is colored according to the -log10(p.adjust). |
| Page: 1 2 3 4 5 6 7 8 9 |
| GO ID | Tissue | Disease Stage | Description | Gene Ratio | Bg Ratio | pvalue | p.adjust | Count |
| Page: 1 |
| Pathway ID | Tissue | Disease Stage | Description | Gene Ratio | Bg Ratio | pvalue | p.adjust | qvalue | Count |
| Page: 1 |
Top |
Cell-cell communication analysis |
| Identification of potential cell-cell interactions between two cell types and their ligand-receptor pairs for different disease states |
| Ligand | Receptor | LRpair | Pathway | Tissue | Disease Stage |
| Page: 1 |
Top |
Single-cell gene regulatory network inference analysis |
| Find out the significant the regulons (TFs) and the target genes of each regulon across cell types for different disease states |
| TF | Cell Type | Tissue | Disease Stage | Target Gene | RSS | Regulon Activity |
| ∗The dot plots of a searched regulon are shown for all cell subpopulations in each disease state of each tissue based on the regulon specific score inferred using pySCENIC and by calculating the average expression. |
| Page: 1 |
Top |
Somatic mutation of malignant transformation related genes |
| Annotation of somatic variants for genes involved in malignant transformation |
| Hugo Symbol | Variant Class | Variant Classification | dbSNP RS | HGVSc | HGVSp | HGVSp Short | SWISSPROT | BIOTYPE | SIFT | PolyPhen | Tumor Sample Barcode | Tissue | Histology | Sex | Age | Stage | Therapy Types | Drugs | Outcome |
| TMEM248 | SNV | Missense_Mutation | c.293N>T | p.Thr98Ile | p.T98I | Q9NWD8 | protein_coding | deleterious(0.01) | possibly_damaging(0.858) | TCGA-BH-A1F8-01 | Breast | breast invasive carcinoma | Female | >=65 | III/IV | Unknown | Unknown | PD | |
| TMEM248 | insertion | Frame_Shift_Ins | novel | c.251_252insTAGAGACATACTGGCTGGCTTAATTCTCTCTCTTT | p.Pro85ArgfsTer17 | p.P85Rfs*17 | Q9NWD8 | protein_coding | TCGA-AO-A0JF-01 | Breast | breast invasive carcinoma | Female | >=65 | I/II | Chemotherapy | doxorubicin | SD | ||
| TMEM248 | insertion | Nonsense_Mutation | novel | c.443_444insCTAATCACTTTTATATTCACAACCTAA | p.Ser148_Gly149insTer | p.S148_G149ins* | Q9NWD8 | protein_coding | TCGA-BH-A0B4-01 | Breast | breast invasive carcinoma | Male | >=65 | III/IV | Hormone Therapy | tamoxiphen | SD | ||
| TMEM248 | SNV | Missense_Mutation | novel | c.94N>G | p.Ile32Val | p.I32V | Q9NWD8 | protein_coding | tolerated(0.15) | benign(0.162) | TCGA-VS-A9V3-01 | Cervix | cervical & endocervical cancer | Female | <65 | I/II | Chemotherapy | cisplatin | PD |
| TMEM248 | SNV | Missense_Mutation | rs201691446 | c.514N>A | p.Ala172Thr | p.A172T | Q9NWD8 | protein_coding | tolerated(0.59) | benign(0.039) | TCGA-AA-3864-01 | Colorectum | colon adenocarcinoma | Male | >=65 | I/II | Unknown | Unknown | SD |
| TMEM248 | SNV | Missense_Mutation | novel | c.213G>T | p.Glu71Asp | p.E71D | Q9NWD8 | protein_coding | tolerated(0.51) | benign(0.003) | TCGA-AG-A002-01 | Colorectum | rectum adenocarcinoma | Male | <65 | I/II | Unknown | Unknown | SD |
| TMEM248 | SNV | Missense_Mutation | rs753419807 | c.893G>A | p.Arg298His | p.R298H | Q9NWD8 | protein_coding | tolerated(0.1) | probably_damaging(0.982) | TCGA-AG-A02N-01 | Colorectum | rectum adenocarcinoma | Male | >=65 | I/II | Chemotherapy | folinic | CR |
| TMEM248 | SNV | Missense_Mutation | rs758753584 | c.79N>A | p.Val27Ile | p.V27I | Q9NWD8 | protein_coding | tolerated(0.26) | benign(0.198) | TCGA-AJ-A3EL-01 | Endometrium | uterine corpus endometrioid carcinoma | Female | <65 | I/II | Unknown | Unknown | SD |
| TMEM248 | SNV | Missense_Mutation | rs768749336 | c.788N>A | p.Arg263His | p.R263H | Q9NWD8 | protein_coding | tolerated(0.08) | possibly_damaging(0.855) | TCGA-AP-A059-01 | Endometrium | uterine corpus endometrioid carcinoma | Female | >=65 | I/II | Unknown | Unknown | SD |
| TMEM248 | SNV | Missense_Mutation | novel | c.140N>C | p.Lys47Thr | p.K47T | Q9NWD8 | protein_coding | tolerated(0.16) | benign(0.009) | TCGA-AP-A1DV-01 | Endometrium | uterine corpus endometrioid carcinoma | Female | <65 | I/II | Unknown | Unknown | SD |
| Page: 1 2 3 4 |
Top |
Related drugs of malignant transformation related genes |
| Identification of chemicals and drugs interact with genes involved in malignant transfromation |
| (DGIdb 4.0) |
| Entrez ID | Symbol | Category | Interaction Types | Drug Claim Name | Drug Name | PMIDs |
| Page: 1 |

Copyright 2023-Present -The University of Texas Health Science Center at Houston |