Schematic overview of the cellular and molecular mechanisms involved in the cancer progression, including the proposed cellular and molecular mechanisms in cancer cells trajectory. AT1: alveolar type 1 cells; AT2: alveolar type 2 cells; AAH: atypical adenomatous hyperplasia; AIS: adenocarcinoma in situ; MIA: minimally invasive adenocarcinoma; IA: invasive adenocarcinoma; EMT: epithelial-mesenchymal transition

Home

Download

Statistics

Help

Contact

Center for Computational Systems Medicine
leaf

Gene summary

leaf

Malignant transformation analysis

leaf

Malignant transformation related pathway analysis

leaf

Cell-cell communication analysis

leaf

Single-cell gene regulatory network inference analysis

leaf

Somatic mutation of malignant transformation related genes

leaf

Related drugs of malignant transformation related genes

Gene: TET2

Gene summary for TET2

check button Gene summary.

Gene informationSpeciesHuman
Gene symbol

TET2

Gene ID

54790

Gene nametet methylcytosine dioxygenase 2
Gene AliasIMD75
Cytomap4q24
Gene Typeprotein-coding
GO ID

GO:0002376

UniProtAcc

A0A158SIU0


Top

Malignant transformation analysis

check button Identification of the aberrant gene expression in precancerous and cancerous lesions by comparing the gene expression of stem-like cells in diseased tissues with normal stem cells
check button Malignant transformation involving gene list.
Entrez IDSymbolReplicatesSpeciesOrganTissueAdj P-valueLog2FCMalignancy
54790TET2052099_1652-all-cellsHumanProstateBPH3.23e-174.14e-010.1038
54790TET2Dong_P3HumanProstateTumor4.14e-061.22e-010.0278
54790TET2GSM5353221_PA_PB2A_Pool_1_3_S25_L001HumanProstateTumor5.60e-115.47e-010.1633
54790TET2GSM5353222_PA_PB2B_Pool_1_3_S52_L002HumanProstateTumor3.20e-115.00e-010.1608
54790TET2GSM5353223_PA_PB2B_Pool_2_S26_L001HumanProstateTumor1.34e-116.18e-010.1604
54790TET2GSM5353224_PA_PR5186_Pool_1_2_3_S27_L001HumanProstateTumor3.99e-043.55e-010.1621
54790TET2GSM5353227_PA_PR5199-193K_Pool_1_2_3_S55_L002HumanProstateTumor2.95e-064.45e-010.1602
54790TET2GSM5353237_PA_PR5251_T2_S8_L001HumanProstateTumor9.24e-034.76e-010.1622
54790TET2GSM5353240_PA_PR5254_T1_S15_L001HumanProstateTumor1.04e-032.97e-010.1575
54790TET2GSM5353244_PA_PR5261_T2_S24_L002HumanProstateTumor1.32e-023.03e-010.1569
54790TET2male-WTAHumanThyroidPTC7.58e-101.32e-010.1037
54790TET2PTC01HumanThyroidPTC2.09e-051.13e-010.1899
54790TET2PTC04HumanThyroidPTC1.10e-132.98e-010.1927
54790TET2PTC05HumanThyroidPTC1.34e-135.29e-010.2065
54790TET2PTC06HumanThyroidPTC4.92e-265.59e-010.2057
54790TET2PTC07HumanThyroidPTC8.00e-213.99e-010.2044
54790TET2ATC13HumanThyroidATC1.97e-203.27e-010.34
54790TET2ATC2HumanThyroidATC7.86e-095.46e-010.34
54790TET2ATC4HumanThyroidATC8.04e-031.02e-010.34
54790TET2ATC5HumanThyroidATC4.52e-133.49e-010.34
Page: 1 2 3 4 5 6 7 

check button Transcriptomic changes along malignancy continuum.
TissueExpression DynamicsAbbreviation
Colorectum (GSE201348)The image shows the transcriptomic changes along malignancy continuum.log2FC in expression of this searched gene in stem-like cells from each diseased tissue sample relative to stem-like cells in normal samples in each tissue plotted against the malignancy continuum. Samples are colored based on if they are from different disease stage.FAP: Familial adenomatous polyposis
CRC: Colorectal cancer
Colorectum (HTA11)The image shows the transcriptomic changes along malignancy continuum.log2FC in expression of this searched gene in stem-like cells from each diseased tissue sample relative to stem-like cells in normal samples in each tissue plotted against the malignancy continuum. Samples are colored based on if they are from different disease stage.AD: Adenomas
SER: Sessile serrated lesions
MSI-H: Microsatellite-high colorectal cancer
MSS: Microsatellite stable colorectal cancer
EsophagusThe image shows the transcriptomic changes along malignancy continuum.log2FC in expression of this searched gene in stem-like cells from each diseased tissue sample relative to stem-like cells in normal samples in each tissue plotted against the malignancy continuum. Samples are colored based on if they are from different disease stage.
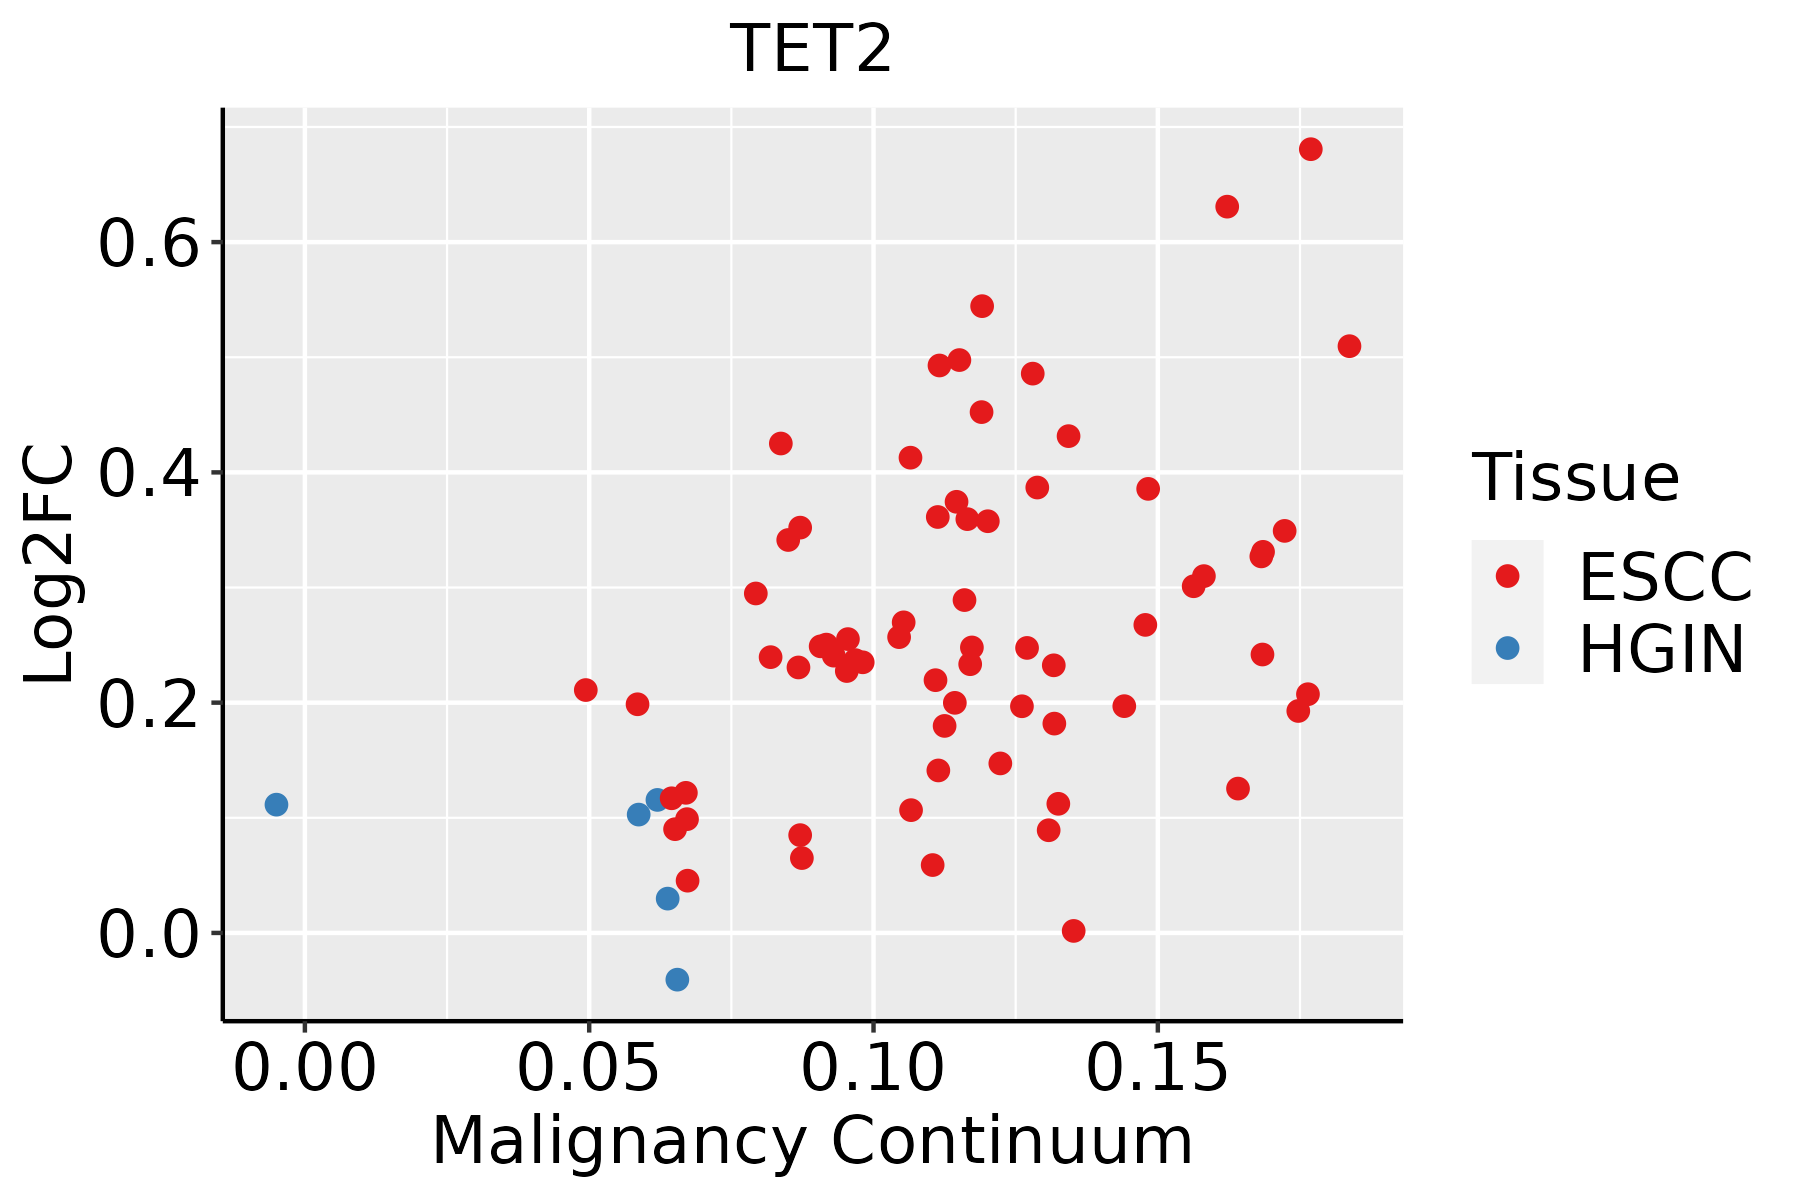
ESCC: Esophageal squamous cell carcinoma
HGIN: High-grade intraepithelial neoplasias
LGIN: Low-grade intraepithelial neoplasias
LungThe image shows the transcriptomic changes along malignancy continuum.log2FC in expression of this searched gene in stem-like cells from each diseased tissue sample relative to stem-like cells in normal samples in each tissue plotted against the malignancy continuum. Samples are colored based on if they are from different disease stage.
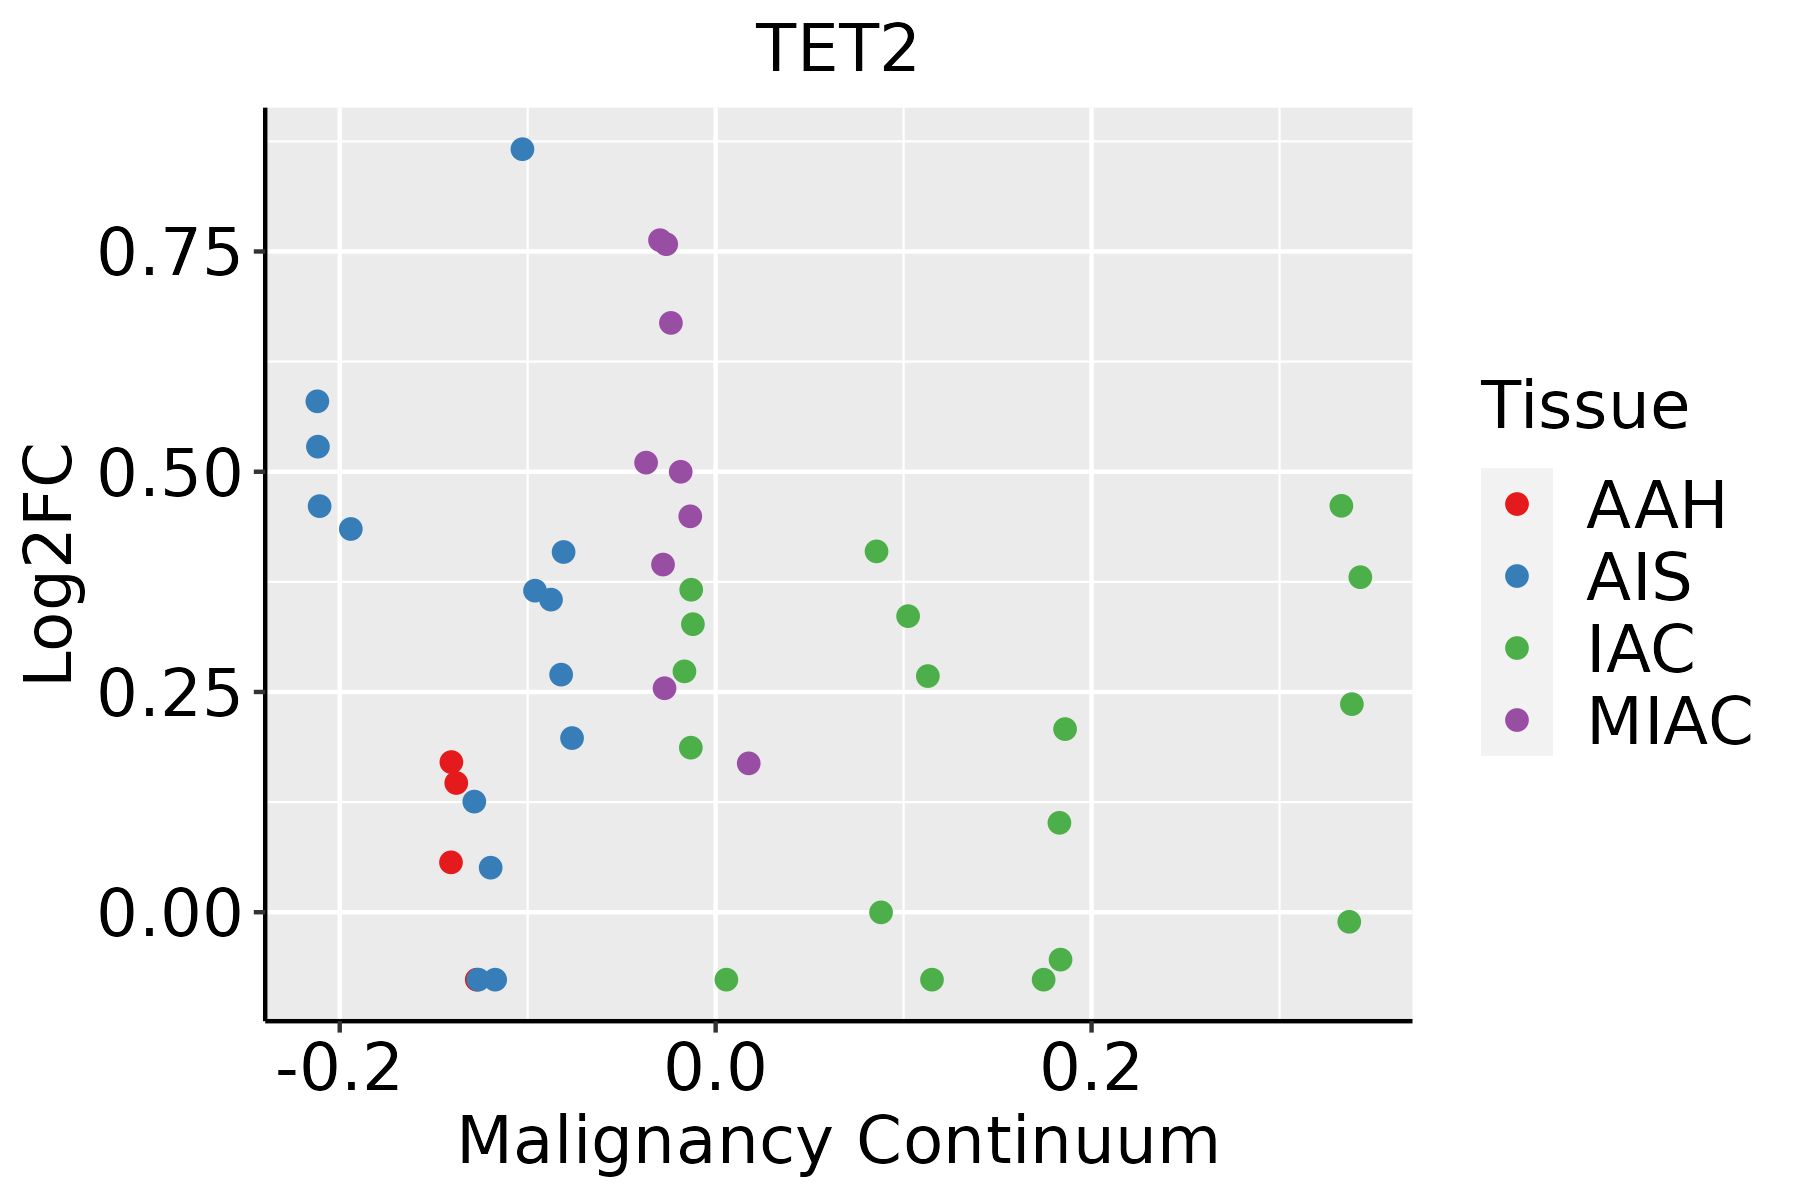
AAH: Atypical adenomatous hyperplasia
AIS: Adenocarcinoma in situ
IAC: Invasive lung adenocarcinoma
MIA: Minimally invasive adenocarcinoma
ProstateThe image shows the transcriptomic changes along malignancy continuum.log2FC in expression of this searched gene in stem-like cells from each diseased tissue sample relative to stem-like cells in normal samples in each tissue plotted against the malignancy continuum. Samples are colored based on if they are from different disease stage.
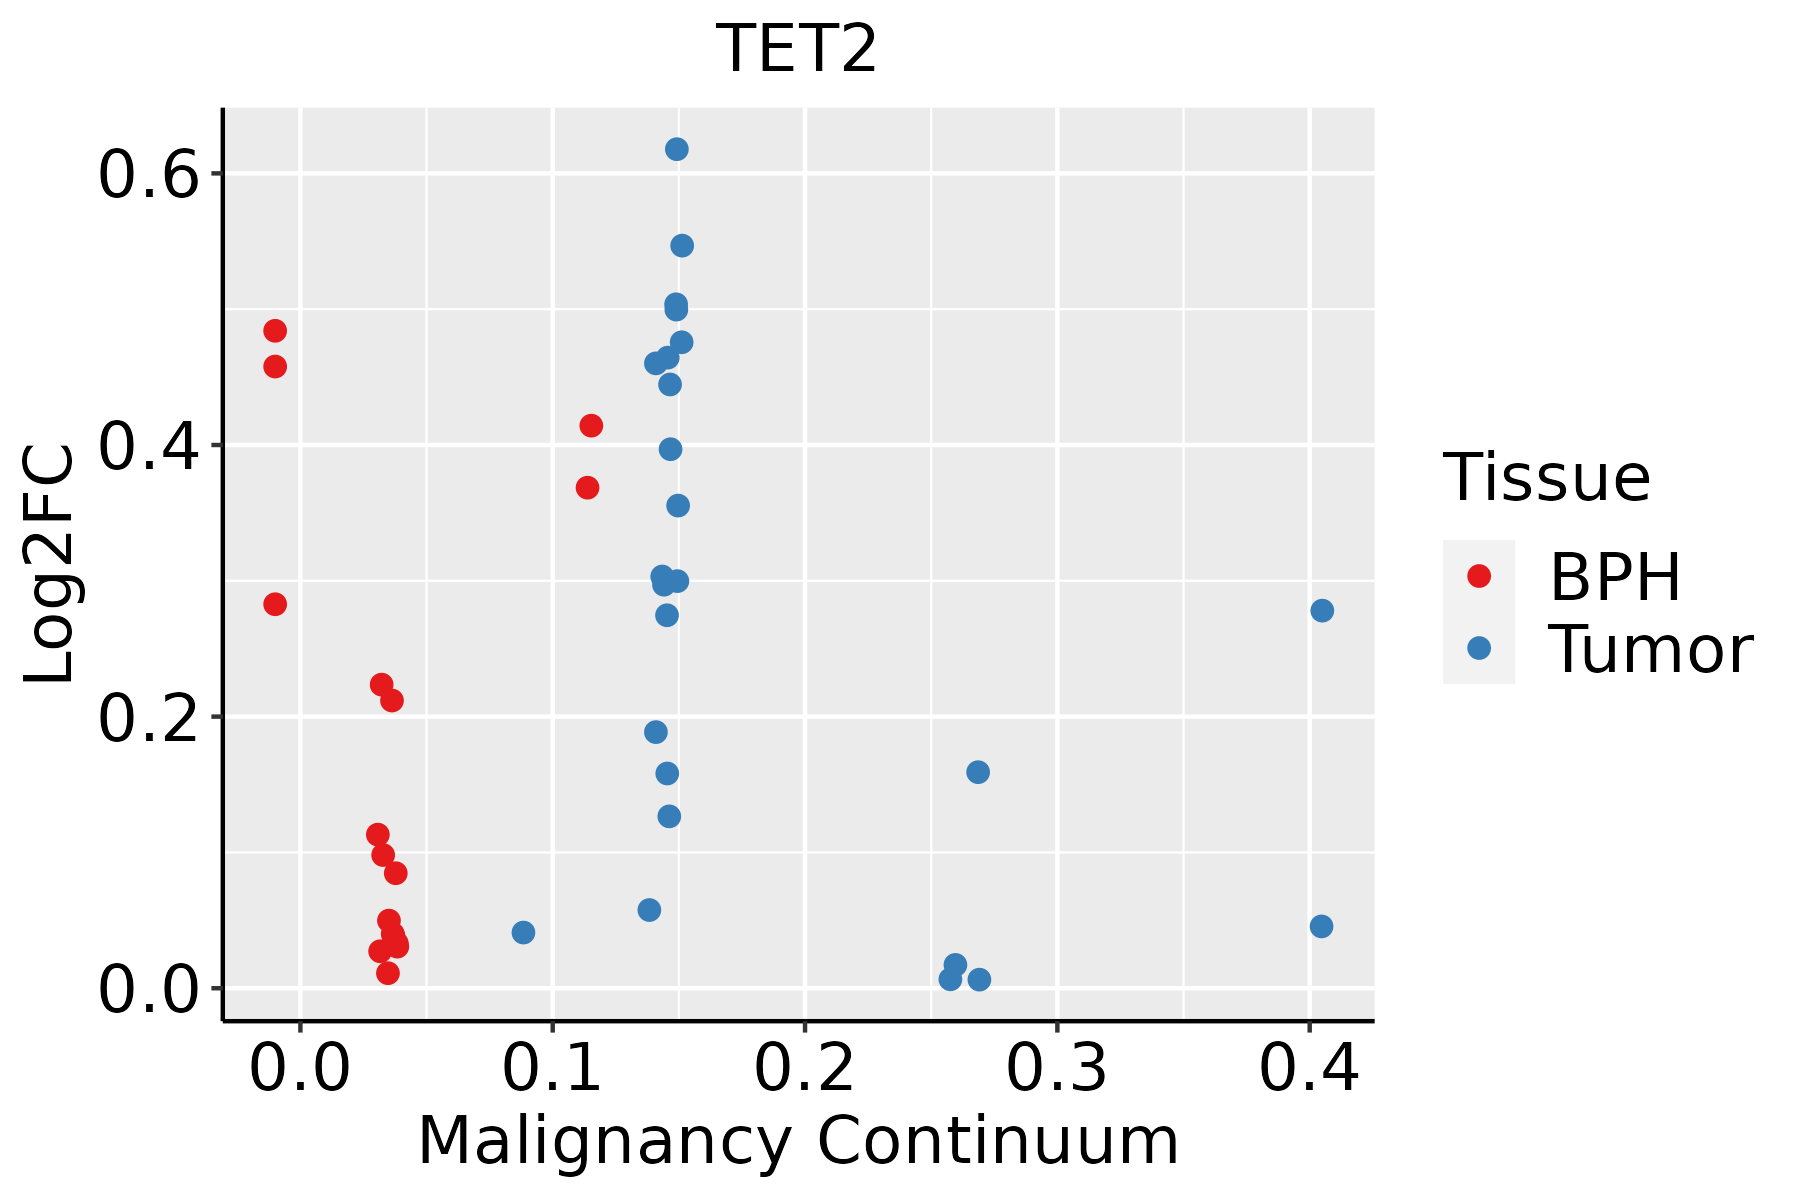
BPH: Benign Prostatic Hyperplasia
ThyroidThe image shows the transcriptomic changes along malignancy continuum.log2FC in expression of this searched gene in stem-like cells from each diseased tissue sample relative to stem-like cells in normal samples in each tissue plotted against the malignancy continuum. Samples are colored based on if they are from different disease stage.
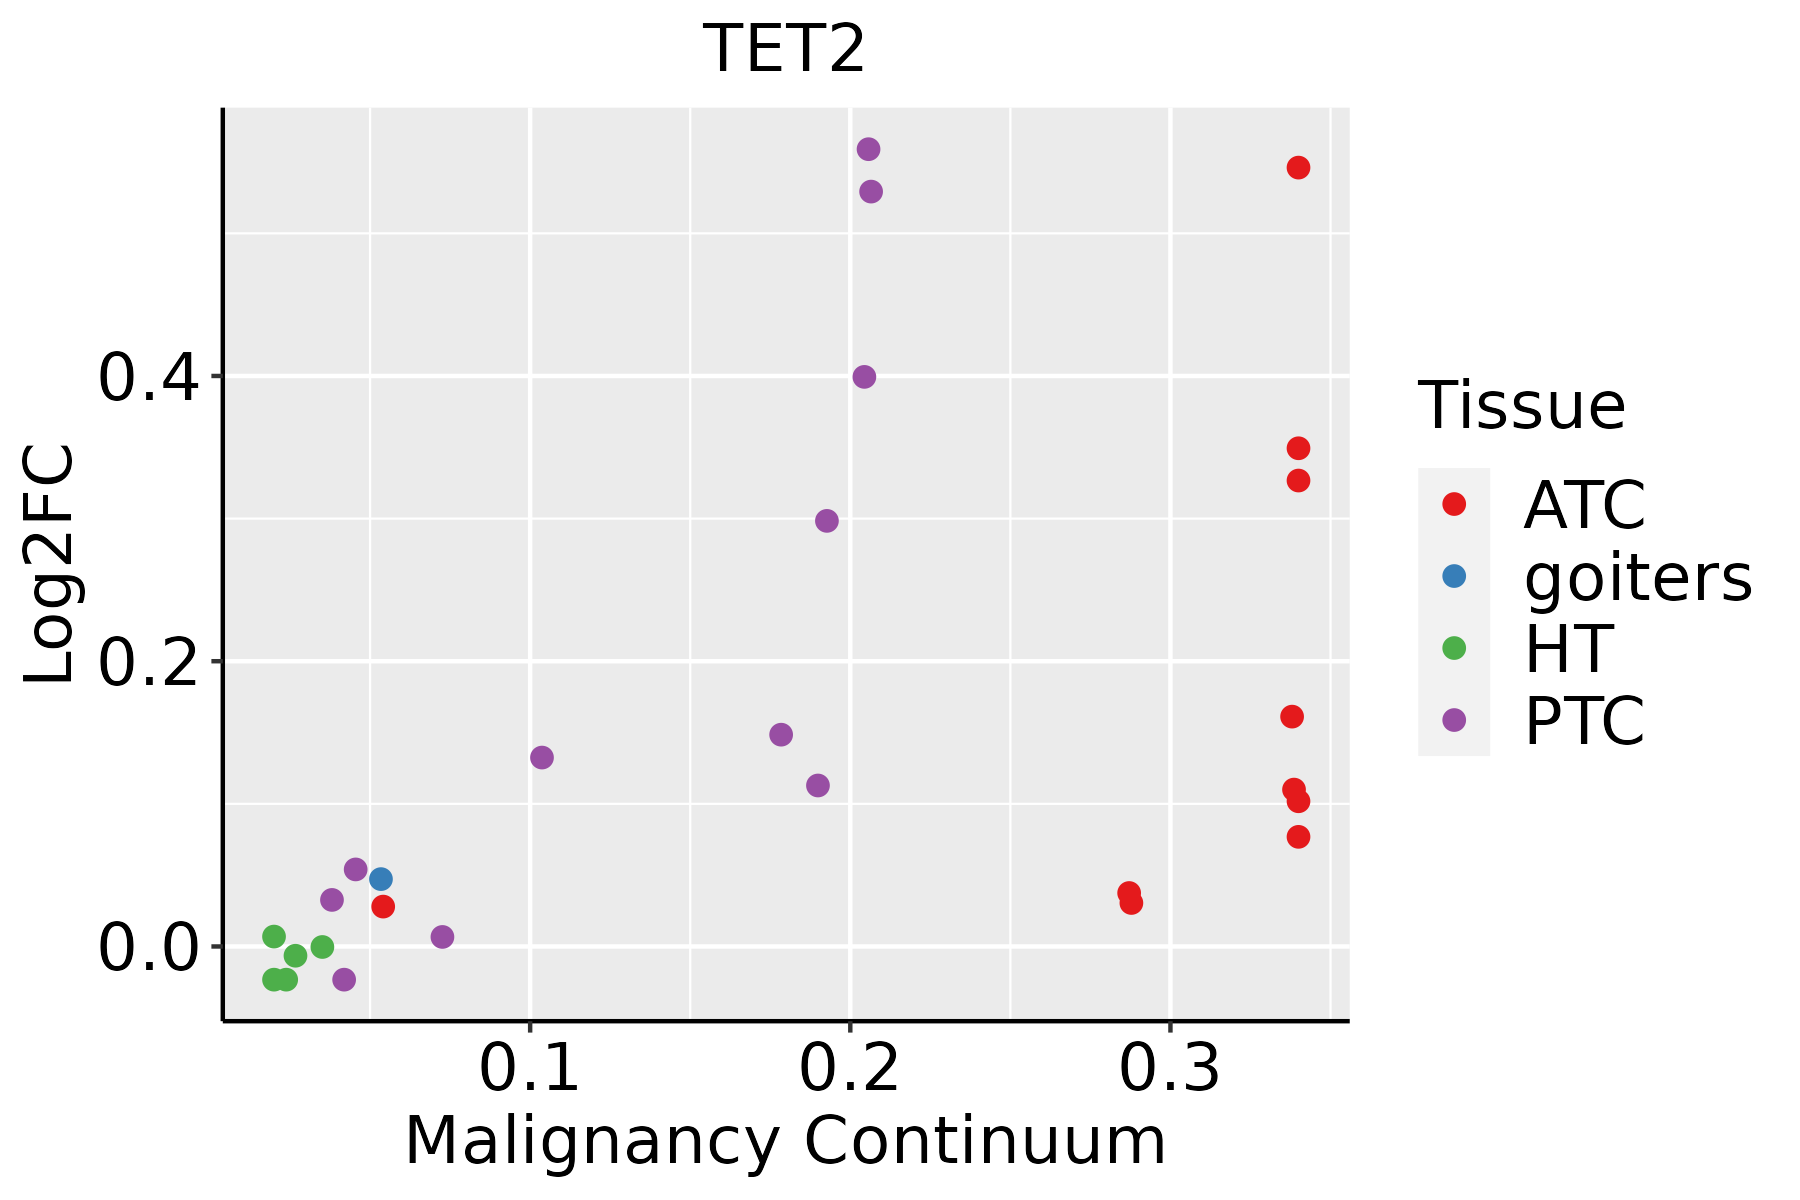
ATC: Anaplastic thyroid cancer
HT: Hashimoto's thyroiditis
PTC: Papillary thyroid cancer
∗log2FC in expression of this searched gene in stem-like cells from each diseased tissue sample relative to stem-like cells in normal samples in each tissue plotted against the malignancy continuum. Samples are colored based on if they are from different disease stage.

Top

Malignant transformation related pathway analysis

check buttonFind out the enriched GO biological processes and KEGG pathways involved in transition from healthy to precancer to cancer
check button Figure of enriched GO biological processes.
TissueDisease StageEnriched GO biological Processes
ColorectumADGO analysis - Figure of enriched GO biological processes: Top 15 enriched GO BP terms are showed in the bar plot of each disease state in each tissue. Each row represents a significant GO biological process which is colored according to the -log10(p.adjust).
ColorectumSERGO analysis - Figure of enriched GO biological processes: Top 15 enriched GO BP terms are showed in the bar plot of each disease state in each tissue. Each row represents a significant GO biological process which is colored according to the -log10(p.adjust).
ColorectumMSSGO analysis - Figure of enriched GO biological processes: Top 15 enriched GO BP terms are showed in the bar plot of each disease state in each tissue. Each row represents a significant GO biological process which is colored according to the -log10(p.adjust).
ColorectumMSI-HGO analysis - Figure of enriched GO biological processes: Top 15 enriched GO BP terms are showed in the bar plot of each disease state in each tissue. Each row represents a significant GO biological process which is colored according to the -log10(p.adjust).
ColorectumFAPGO analysis - Figure of enriched GO biological processes: Top 15 enriched GO BP terms are showed in the bar plot of each disease state in each tissue. Each row represents a significant GO biological process which is colored according to the -log10(p.adjust).
∗Top 15 enriched GO BP terms are showed in the bar plot of each disease state in each tissue. Each row represents a significant GO biological process which is colored according to the -log10(p.adjust).
Page: 1 2 3 4 5 6 7 8 9 

check button Enriched GO biological processes.
GO IDTissueDisease StageDescriptionGene RatioBg Ratiopvaluep.adjustCount
GO:0044270ColorectumADcellular nitrogen compound catabolic process147/3918451/187233.35e-092.23e-07147
GO:0046700ColorectumADheterocycle catabolic process145/3918445/187234.37e-092.84e-07145
GO:0019439ColorectumADaromatic compound catabolic process146/3918467/187237.48e-083.84e-06146
GO:1901361ColorectumADorganic cyclic compound catabolic process153/3918495/187238.23e-084.18e-06153
GO:0030099ColorectumADmyeloid cell differentiation119/3918381/187231.24e-064.01e-05119
GO:0006486ColorectumADprotein glycosylation64/3918226/187234.86e-033.27e-0264
GO:0043413ColorectumADmacromolecule glycosylation64/3918226/187234.86e-033.27e-0264
GO:0070085ColorectumADglycosylation67/3918240/187235.78e-033.67e-0267
GO:00442701ColorectumSERcellular nitrogen compound catabolic process99/2897451/187231.46e-042.86e-0399
GO:00467001ColorectumSERheterocycle catabolic process97/2897445/187232.20e-043.89e-0397
GO:19013611ColorectumSERorganic cyclic compound catabolic process104/2897495/187235.46e-047.63e-03104
GO:00194391ColorectumSERaromatic compound catabolic process98/2897467/187238.09e-041.01e-0298
GO:00300991ColorectumSERmyeloid cell differentiation80/2897381/187232.28e-032.18e-0280
GO:00442702ColorectumMSScellular nitrogen compound catabolic process141/3467451/187232.95e-113.83e-09141
GO:00467002ColorectumMSSheterocycle catabolic process139/3467445/187234.37e-115.05e-09139
GO:19013612ColorectumMSSorganic cyclic compound catabolic process148/3467495/187233.47e-103.18e-08148
GO:00194392ColorectumMSSaromatic compound catabolic process140/3467467/187238.56e-106.85e-08140
GO:00300992ColorectumMSSmyeloid cell differentiation110/3467381/187234.48e-071.75e-05110
GO:0016570ColorectumMSShistone modification113/3467463/187238.37e-048.68e-03113
GO:00442704ColorectumFAPcellular nitrogen compound catabolic process101/2622451/187237.42e-073.44e-05101
Page: 1 2 3 4 5 6 7 8 

check button Enriched KEGG pathways.
Pathway IDTissueDisease StageDescriptionGene RatioBg Ratiopvaluep.adjustqvalueCount
Page: 1 

Top

Cell-cell communication analysis

check buttonIdentification of potential cell-cell interactions between two cell types and their ligand-receptor pairs for different disease states
LigandReceptorLRpairPathwayTissueDisease Stage
Page: 1 

Top

Single-cell gene regulatory network inference analysis

check buttonFind out the significant the regulons (TFs) and the target genes of each regulon across cell types for different disease states
TFCell TypeTissueDisease StageTarget GeneRSSRegulon Activity
∗The dot plots of a searched regulon are shown for all cell subpopulations in each disease state of each tissue based on the regulon specific score inferred using pySCENIC and by calculating the average expression.
Page: 1 

Top

Somatic mutation of malignant transformation related genes

check buttonAnnotation of somatic variants for genes involved in malignant transformation
Hugo SymbolVariant ClassVariant ClassificationdbSNP RSHGVScHGVSpHGVSp ShortSWISSPROTBIOTYPESIFTPolyPhenTumor Sample BarcodeTissueHistologySexAgeStageTherapy TypesDrugsOutcome
TET2SNVMissense_Mutationrs116519313c.5618T>Cp.Ile1873Thrp.I1873TQ6N021protein_codingdeleterious(0)probably_damaging(0.999)TCGA-A2-A0EQ-01Breastbreast invasive carcinomaFemale<65I/IIChemotherapyadriamycinSD
TET2SNVMissense_Mutationnovelc.2253G>Tp.Lys751Asnp.K751NQ6N021protein_codingdeleterious_low_confidence(0)benign(0.299)TCGA-AN-A046-01Breastbreast invasive carcinomaFemale>=65I/IIUnknownUnknownSD
TET2SNVMissense_Mutationc.4150N>Cp.Asp1384Hisp.D1384HQ6N021protein_codingdeleterious(0)probably_damaging(1)TCGA-AR-A255-01Breastbreast invasive carcinomaFemale<65I/IITargeted Molecular therapytrastuzumabSD
TET2SNVMissense_Mutationc.2147C>Tp.Ser716Leup.S716LQ6N021protein_codingdeleterious(0)possibly_damaging(0.469)TCGA-AR-A2LE-01Breastbreast invasive carcinomaFemale>=65I/IIHormone TherapytamoxiphenPD
TET2SNVMissense_Mutationc.1966N>Tp.Pro656Serp.P656SQ6N021protein_codingtolerated(0.79)benign(0.003)TCGA-BH-A0HF-01Breastbreast invasive carcinomaFemale>=65I/IIHormone TherapyarimidexSD
TET2SNVMissense_Mutationc.4778G>Ap.Ser1593Asnp.S1593NQ6N021protein_codingtolerated(1)benign(0.001)TCGA-BH-A18G-01Breastbreast invasive carcinomaFemale>=65I/IIUnknownUnknownSD
TET2SNVMissense_Mutationc.742N>Gp.His248Aspp.H248DQ6N021protein_codingdeleterious(0)possibly_damaging(0.795)TCGA-D8-A1J8-01Breastbreast invasive carcinomaFemale>=65I/IIHormone TherapynolvadexSD
TET2SNVMissense_Mutationc.5081N>Cp.Leu1694Serp.L1694SQ6N021protein_codingdeleterious(0.02)probably_damaging(0.977)TCGA-D8-A1XK-01Breastbreast invasive carcinomaFemale<65I/IIChemotherapydoxorubicine+cyclophosphamideSD
TET2SNVMissense_Mutationc.1276C>Gp.Leu426Valp.L426VQ6N021protein_codingdeleterious_low_confidence(0)possibly_damaging(0.647)TCGA-D8-A27G-01Breastbreast invasive carcinomaFemale>=65I/IIUnknownUnknownSD
TET2SNVMissense_Mutationnovelc.3952G>Cp.Glu1318Glnp.E1318QQ6N021protein_codingdeleterious(0.03)probably_damaging(0.944)TCGA-GM-A2DO-01Breastbreast invasive carcinomaFemale<65I/IIHormone TherapytamoxiphenCR
Page: 1 2 3 4 5 6 7 8 9 10 11 12 13 14 15 16 

Top

Related drugs of malignant transformation related genes

check buttonIdentification of chemicals and drugs interact with genes involved in malignant transfromation
(DGIdb 4.0)
Entrez IDSymbolCategoryInteraction TypesDrug Claim NameDrug NamePMIDs
54790TET2CLINICALLY ACTIONABLE, ENZYMEAzacitidineAZACITIDINE25224413,21494260
54790TET2CLINICALLY ACTIONABLE, ENZYMEN/A24507812,23099237,24994606,26769228,24524305,25224413,25412851,19666869
54790TET2CLINICALLY ACTIONABLE, ENZYMEhydrochlorothiazideHYDROCHLOROTHIAZIDE
54790TET2CLINICALLY ACTIONABLE, ENZYMEDecitabineDECITABINE25224413
Page: 1