Schematic overview of the cellular and molecular mechanisms involved in the cancer progression, including the proposed cellular and molecular mechanisms in cancer cells trajectory. AT1: alveolar type 1 cells; AT2: alveolar type 2 cells; AAH: atypical adenomatous hyperplasia; AIS: adenocarcinoma in situ; MIA: minimally invasive adenocarcinoma; IA: invasive adenocarcinoma; EMT: epithelial-mesenchymal transition

Home

Download

Statistics

Help

Contact

Center for Computational Systems Medicine
leaf

Gene summary

leaf

Malignant transformation analysis

leaf

Malignant transformation related pathway analysis

leaf

Cell-cell communication analysis

leaf

Single-cell gene regulatory network inference analysis

leaf

Somatic mutation of malignant transformation related genes

leaf

Related drugs of malignant transformation related genes

Gene: TACC1

Gene summary for TACC1

check button Gene summary.

Gene informationSpeciesHuman
Gene symbol

TACC1

Gene ID

6867

Gene nametransforming acidic coiled-coil containing protein 1
Gene AliasGa55
Cytomap8p11.22
Gene Typeprotein-coding
GO ID

GO:0000226

UniProtAcc

O75410


Top

Malignant transformation analysis

check button Identification of the aberrant gene expression in precancerous and cancerous lesions by comparing the gene expression of stem-like cells in diseased tissues with normal stem cells
check button Malignant transformation involving gene list.
Entrez IDSymbolReplicatesSpeciesOrganTissueAdj P-valueLog2FCMalignancy
6867TACC1LN22HumanOral cavityOSCC3.24e-091.33e+000.1733
6867TACC1LP15HumanOral cavityLP1.21e-029.78e-010.2174
6867TACC1EOLP-1HumanOral cavityEOLP3.87e-143.58e-01-0.0202
6867TACC1EOLP-2HumanOral cavityEOLP2.94e-042.34e-01-0.0203
6867TACC1NEOLP-1HumanOral cavityNEOLP6.72e-084.15e-01-0.0194
6867TACC1NEOLP-2HumanOral cavityNEOLP2.53e-102.78e-01-0.0196
6867TACC1NEOLP-3HumanOral cavityNEOLP3.26e-163.46e-01-0.0191
6867TACC1SYSMH1HumanOral cavityOSCC3.10e-13-3.63e-010.1127
6867TACC1SYSMH3HumanOral cavityOSCC8.08e-054.63e-010.2442
6867TACC1SYSMH4HumanOral cavityOSCC7.36e-14-5.03e-010.1226
6867TACC1SYSMH5HumanOral cavityOSCC1.10e-13-5.20e-010.0647
6867TACC1SYSMH6HumanOral cavityOSCC6.71e-05-5.09e-010.1275
6867TACC1GSM5252131_BPH340PrSF_ViaHumanProstateBPH4.88e-042.49e-01-0.2126
6867TACC1GSM5252132_BPH389PrGFHumanProstateBPH5.00e-077.65e-01-0.2247
6867TACC1GSM5252133_BPH389PrSFHumanProstateBPH4.03e-045.57e-01-0.2027
6867TACC1GSM5252135_BPH511PrPUr_Fcol_3GEXHumanProstateBPH7.42e-095.02e-01-0.1833
6867TACC1GSM5252136_BPH556PrGA1_FcolHumanProstateBPH4.32e-032.60e-01-0.23
6867TACC1GSM5252137_BPH556PrGA2_FcolHumanProstateBPH2.97e-074.24e-01-0.23
6867TACC1047563_1562-all-cellsHumanProstateBPH3.50e-144.24e-010.0791
6867TACC1052095_1628-all-cellsHumanProstateBPH3.11e-113.67e-010.1032
Page: 1 2 3 4 5 6 7 8 9 

check button Transcriptomic changes along malignancy continuum.
TissueExpression DynamicsAbbreviation
Colorectum (GSE201348)The image shows the transcriptomic changes along malignancy continuum.log2FC in expression of this searched gene in stem-like cells from each diseased tissue sample relative to stem-like cells in normal samples in each tissue plotted against the malignancy continuum. Samples are colored based on if they are from different disease stage.FAP: Familial adenomatous polyposis
CRC: Colorectal cancer
Colorectum (HTA11)The image shows the transcriptomic changes along malignancy continuum.log2FC in expression of this searched gene in stem-like cells from each diseased tissue sample relative to stem-like cells in normal samples in each tissue plotted against the malignancy continuum. Samples are colored based on if they are from different disease stage.AD: Adenomas
SER: Sessile serrated lesions
MSI-H: Microsatellite-high colorectal cancer
MSS: Microsatellite stable colorectal cancer
EsophagusThe image shows the transcriptomic changes along malignancy continuum.log2FC in expression of this searched gene in stem-like cells from each diseased tissue sample relative to stem-like cells in normal samples in each tissue plotted against the malignancy continuum. Samples are colored based on if they are from different disease stage.ESCC: Esophageal squamous cell carcinoma
HGIN: High-grade intraepithelial neoplasias
LGIN: Low-grade intraepithelial neoplasias
LiverThe image shows the transcriptomic changes along malignancy continuum.log2FC in expression of this searched gene in stem-like cells from each diseased tissue sample relative to stem-like cells in normal samples in each tissue plotted against the malignancy continuum. Samples are colored based on if they are from different disease stage.HCC: Hepatocellular carcinoma
NAFLD: Non-alcoholic fatty liver disease
LungThe image shows the transcriptomic changes along malignancy continuum.log2FC in expression of this searched gene in stem-like cells from each diseased tissue sample relative to stem-like cells in normal samples in each tissue plotted against the malignancy continuum. Samples are colored based on if they are from different disease stage.AAH: Atypical adenomatous hyperplasia
AIS: Adenocarcinoma in situ
IAC: Invasive lung adenocarcinoma
MIA: Minimally invasive adenocarcinoma
Oral CavityThe image shows the transcriptomic changes along malignancy continuum.log2FC in expression of this searched gene in stem-like cells from each diseased tissue sample relative to stem-like cells in normal samples in each tissue plotted against the malignancy continuum. Samples are colored based on if they are from different disease stage.EOLP: Erosive Oral lichen planus
LP: leukoplakia
NEOLP: Non-erosive oral lichen planus
OSCC: Oral squamous cell carcinoma
ProstateThe image shows the transcriptomic changes along malignancy continuum.log2FC in expression of this searched gene in stem-like cells from each diseased tissue sample relative to stem-like cells in normal samples in each tissue plotted against the malignancy continuum. Samples are colored based on if they are from different disease stage.
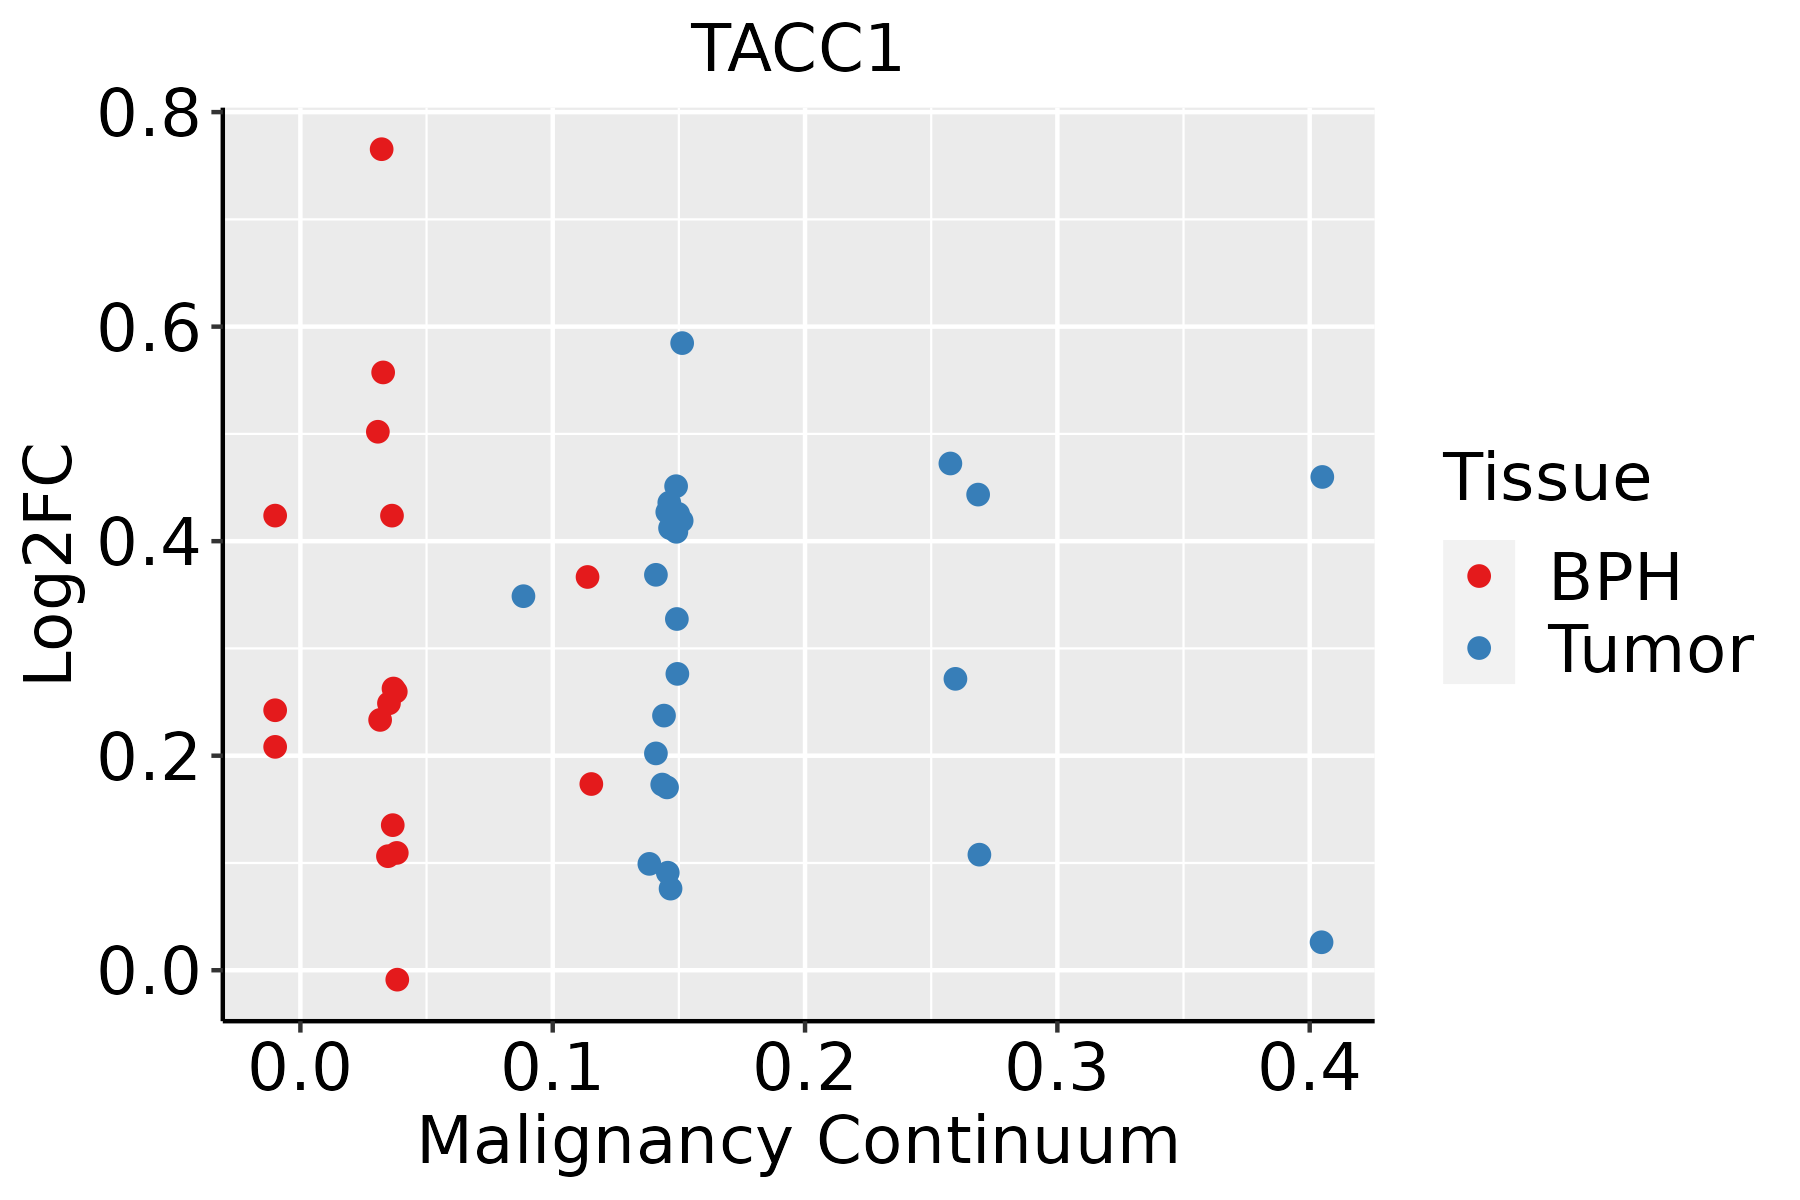
BPH: Benign Prostatic Hyperplasia
ThyroidThe image shows the transcriptomic changes along malignancy continuum.log2FC in expression of this searched gene in stem-like cells from each diseased tissue sample relative to stem-like cells in normal samples in each tissue plotted against the malignancy continuum. Samples are colored based on if they are from different disease stage.
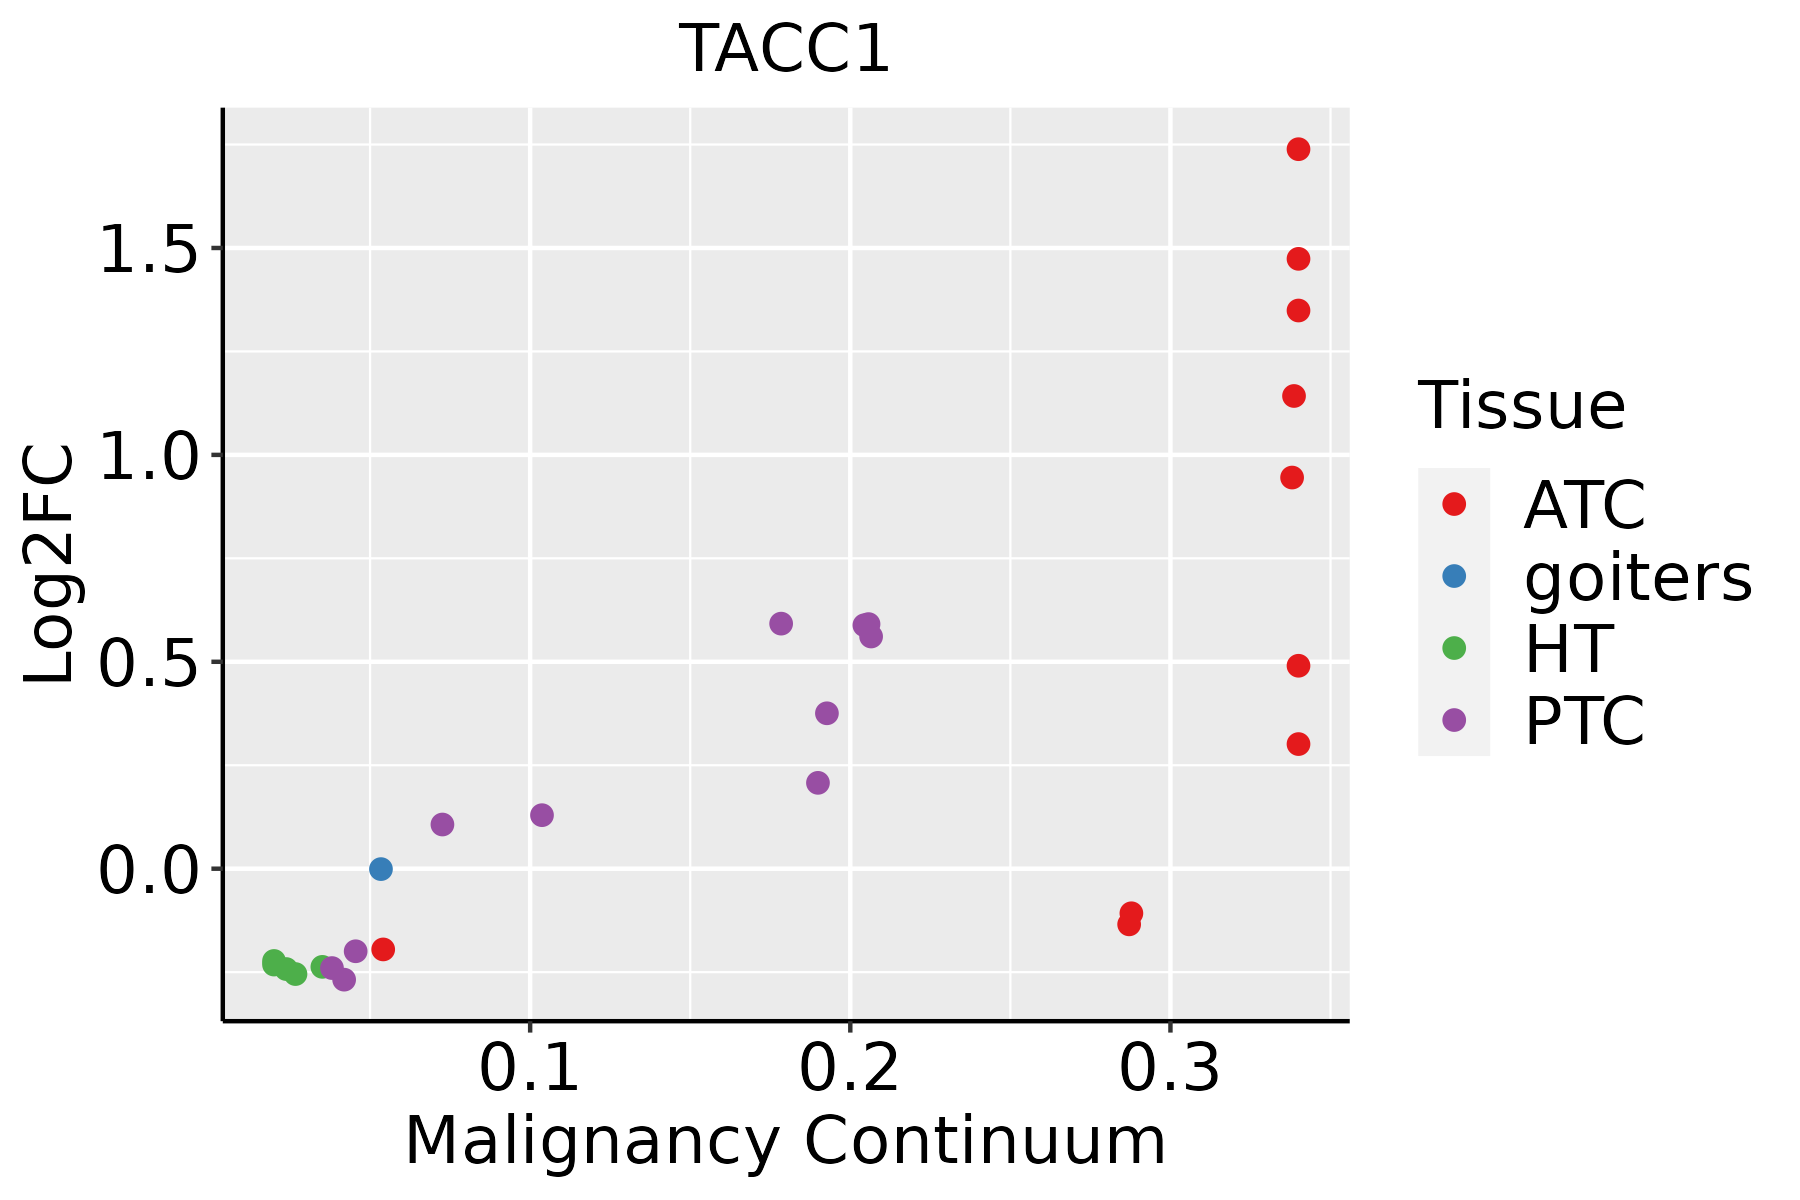
ATC: Anaplastic thyroid cancer
HT: Hashimoto's thyroiditis
PTC: Papillary thyroid cancer
∗log2FC in expression of this searched gene in stem-like cells from each diseased tissue sample relative to stem-like cells in normal samples in each tissue plotted against the malignancy continuum. Samples are colored based on if they are from different disease stage.

Top

Malignant transformation related pathway analysis

check buttonFind out the enriched GO biological processes and KEGG pathways involved in transition from healthy to precancer to cancer
check button Figure of enriched GO biological processes.
TissueDisease StageEnriched GO biological Processes
ColorectumADGO analysis - Figure of enriched GO biological processes: Top 15 enriched GO BP terms are showed in the bar plot of each disease state in each tissue. Each row represents a significant GO biological process which is colored according to the -log10(p.adjust).
ColorectumSERGO analysis - Figure of enriched GO biological processes: Top 15 enriched GO BP terms are showed in the bar plot of each disease state in each tissue. Each row represents a significant GO biological process which is colored according to the -log10(p.adjust).
ColorectumMSSGO analysis - Figure of enriched GO biological processes: Top 15 enriched GO BP terms are showed in the bar plot of each disease state in each tissue. Each row represents a significant GO biological process which is colored according to the -log10(p.adjust).
ColorectumMSI-HGO analysis - Figure of enriched GO biological processes: Top 15 enriched GO BP terms are showed in the bar plot of each disease state in each tissue. Each row represents a significant GO biological process which is colored according to the -log10(p.adjust).
ColorectumFAPGO analysis - Figure of enriched GO biological processes: Top 15 enriched GO BP terms are showed in the bar plot of each disease state in each tissue. Each row represents a significant GO biological process which is colored according to the -log10(p.adjust).
∗Top 15 enriched GO BP terms are showed in the bar plot of each disease state in each tissue. Each row represents a significant GO biological process which is colored according to the -log10(p.adjust).
Page: 1 2 3 4 5 6 7 8 9 

check button Enriched GO biological processes.
GO IDTissueDisease StageDescriptionGene RatioBg Ratiopvaluep.adjustCount
GO:0007051ColorectumADspindle organization58/3918184/187234.71e-045.20e-0358
GO:1902850ColorectumADmicrotubule cytoskeleton organization involved in mitosis48/3918147/187235.87e-046.21e-0348
GO:0007052ColorectumADmitotic spindle organization40/3918120/187231.03e-039.61e-0340
GO:00070511ColorectumMSSspindle organization53/3467184/187234.23e-045.19e-0353
GO:19028501ColorectumMSSmicrotubule cytoskeleton organization involved in mitosis44/3467147/187235.17e-045.98e-0344
GO:00070521ColorectumMSSmitotic spindle organization36/3467120/187231.52e-031.39e-0236
GO:00070512ColorectumFAPspindle organization41/2622184/187231.50e-031.34e-0241
GO:0021987ColorectumFAPcerebral cortex development28/2622114/187231.80e-031.55e-0228
GO:0021543ColorectumFAPpallium development36/2622169/187236.06e-033.81e-0236
GO:0030900ColorectumFAPforebrain development70/2622379/187238.64e-034.98e-0270
GO:00309001ColorectumCRCforebrain development66/2078379/187231.36e-042.57e-0366
GO:00219871ColorectumCRCcerebral cortex development24/2078114/187231.45e-031.57e-0224
GO:00215431ColorectumCRCpallium development32/2078169/187231.74e-031.79e-0232
GO:0021537ColorectumCRCtelencephalon development43/2078248/187232.01e-032.01e-0243
GO:00070513ColorectumCRCspindle organization32/2078184/187236.70e-034.77e-0232
GO:190285015EsophagusESCCmicrotubule cytoskeleton organization involved in mitosis116/8552147/187231.25e-169.91e-15116
GO:000705214EsophagusESCCmitotic spindle organization97/8552120/187232.17e-151.33e-1397
GO:000705114EsophagusESCCspindle organization134/8552184/187235.70e-142.87e-12134
GO:00215436EsophagusESCCpallium development94/8552169/187235.79e-032.14e-0294
GO:00070522LiverCirrhoticmitotic spindle organization46/4634120/187236.56e-044.98e-0346
Page: 1 2 3 4 

check button Enriched KEGG pathways.
Pathway IDTissueDisease StageDescriptionGene RatioBg Ratiopvaluep.adjustqvalueCount
Page: 1 

Top

Cell-cell communication analysis

check buttonIdentification of potential cell-cell interactions between two cell types and their ligand-receptor pairs for different disease states
LigandReceptorLRpairPathwayTissueDisease Stage
Page: 1 

Top

Single-cell gene regulatory network inference analysis

check buttonFind out the significant the regulons (TFs) and the target genes of each regulon across cell types for different disease states
TFCell TypeTissueDisease StageTarget GeneRSSRegulon Activity
∗The dot plots of a searched regulon are shown for all cell subpopulations in each disease state of each tissue based on the regulon specific score inferred using pySCENIC and by calculating the average expression.
Page: 1 

Top

Somatic mutation of malignant transformation related genes

check buttonAnnotation of somatic variants for genes involved in malignant transformation
Hugo SymbolVariant ClassVariant ClassificationdbSNP RSHGVScHGVSpHGVSp ShortSWISSPROTBIOTYPESIFTPolyPhenTumor Sample BarcodeTissueHistologySexAgeStageTherapy TypesDrugsOutcome
TACC1SNVMissense_Mutationc.886G>Tp.Gly296Cysp.G296CO75410protein_codingtolerated(0.06)possibly_damaging(0.59)TCGA-A8-A08T-01Breastbreast invasive carcinomaFemale<65III/IVUnknownUnknownPD
TACC1SNVMissense_Mutationrs779300910c.488N>Tp.Ser163Leup.S163LO75410protein_codingtolerated(0.2)benign(0)TCGA-AN-A046-01Breastbreast invasive carcinomaFemale>=65I/IIUnknownUnknownSD
TACC1SNVMissense_Mutationrs758999833c.1640N>Tp.Ala547Valp.A547VO75410protein_codingtolerated(0.22)benign(0.091)TCGA-AN-A0XP-01Breastbreast invasive carcinomaFemale>=65III/IVUnknownUnknownSD
TACC1SNVMissense_Mutationc.1084N>Ap.Ala362Thrp.A362TO75410protein_codingtolerated(0.28)benign(0.015)TCGA-BH-A0HF-01Breastbreast invasive carcinomaFemale>=65I/IIHormone TherapyarimidexSD
TACC1SNVMissense_Mutationrs778594616c.1895N>Ap.Arg632Glnp.R632QO75410protein_codingdeleterious(0)probably_damaging(0.944)TCGA-BH-A0HW-01Breastbreast invasive carcinomaFemale<65I/IIChemotherapydoxorubicinSD
TACC1insertionIn_Frame_Insnovelc.1619_1620insATATCTGTATGGAGTp.Pro540_Val541insTyrLeuTyrGlyValp.P540_V541insYLYGVO75410protein_codingTCGA-AN-A0AS-01Breastbreast invasive carcinomaFemale>=65III/IVUnknownUnknownSD
TACC1SNVMissense_Mutationnovelc.1340N>Gp.His447Argp.H447RO75410protein_codingtolerated(0.38)benign(0.055)TCGA-2W-A8YY-01Cervixcervical & endocervical cancerFemale<65I/IIChemotherapycisplatinCR
TACC1SNVMissense_Mutationrs377342873c.938N>Tp.Ser313Leup.S313LO75410protein_codingtolerated(0.09)benign(0.037)TCGA-EA-A5ZD-01Cervixcervical & endocervical cancerFemale<65I/IIUnknownUnknownSD
TACC1SNVMissense_Mutationc.1484N>Cp.Asp495Alap.D495AO75410protein_codingtolerated(0.07)benign(0.043)TCGA-FU-A3HZ-01Cervixcervical & endocervical cancerFemale<65I/IIChemotherapycisplatinCR
TACC1SNVMissense_Mutationc.824C>Gp.Thr275Argp.T275RO75410protein_codingtolerated(0.4)benign(0.133)TCGA-Q1-A6DW-01Cervixcervical & endocervical cancerFemale<65I/IIChemotherapycisplatinSD
Page: 1 2 3 4 5 6 7 8 

Top

Related drugs of malignant transformation related genes

check buttonIdentification of chemicals and drugs interact with genes involved in malignant transfromation
(DGIdb 4.0)
Entrez IDSymbolCategoryInteraction TypesDrug Claim NameDrug NamePMIDs
Page: 1