
|
|||||
|
 | |
| |
| |
| |
| |
| |
|
Gene: SYMPK |
Gene summary for SYMPK |
| Gene information | Species | Human | Gene symbol | SYMPK | Gene ID | 8189 |
| Gene name | symplekin scaffold protein | |
| Gene Alias | Pta1 | |
| Cytomap | 19q13.32 | |
| Gene Type | protein-coding | GO ID | GO:0006139 | UniProtAcc | A0A024R0R6 |
Top |
Malignant transformation analysis |
| Identification of the aberrant gene expression in precancerous and cancerous lesions by comparing the gene expression of stem-like cells in diseased tissues with normal stem cells |
| Entrez ID | Symbol | Replicates | Species | Organ | Tissue | Adj P-value | Log2FC | Malignancy |
| 8189 | SYMPK | PTC03 | Human | Thyroid | PTC | 9.85e-05 | 1.86e-01 | 0.1784 |
| 8189 | SYMPK | PTC04 | Human | Thyroid | PTC | 6.54e-19 | 3.31e-01 | 0.1927 |
| 8189 | SYMPK | PTC05 | Human | Thyroid | PTC | 2.64e-19 | 5.94e-01 | 0.2065 |
| 8189 | SYMPK | PTC06 | Human | Thyroid | PTC | 1.15e-33 | 6.53e-01 | 0.2057 |
| 8189 | SYMPK | PTC07 | Human | Thyroid | PTC | 3.69e-24 | 3.69e-01 | 0.2044 |
| 8189 | SYMPK | ATC09 | Human | Thyroid | ATC | 3.91e-16 | 4.40e-01 | 0.2871 |
| 8189 | SYMPK | ATC11 | Human | Thyroid | ATC | 4.47e-09 | 6.46e-01 | 0.3386 |
| 8189 | SYMPK | ATC12 | Human | Thyroid | ATC | 9.30e-20 | 3.38e-01 | 0.34 |
| 8189 | SYMPK | ATC13 | Human | Thyroid | ATC | 6.20e-28 | 5.26e-01 | 0.34 |
| 8189 | SYMPK | ATC1 | Human | Thyroid | ATC | 2.20e-16 | 5.11e-01 | 0.2878 |
| 8189 | SYMPK | ATC2 | Human | Thyroid | ATC | 3.00e-14 | 7.84e-01 | 0.34 |
| 8189 | SYMPK | ATC3 | Human | Thyroid | ATC | 1.10e-17 | 7.45e-01 | 0.338 |
| 8189 | SYMPK | ATC4 | Human | Thyroid | ATC | 1.42e-24 | 4.22e-01 | 0.34 |
| 8189 | SYMPK | ATC5 | Human | Thyroid | ATC | 1.01e-27 | 5.68e-01 | 0.34 |
| Page: 1 2 3 4 5 6 7 |
| Tissue | Expression Dynamics | Abbreviation |
| Colorectum (GSE201348) | 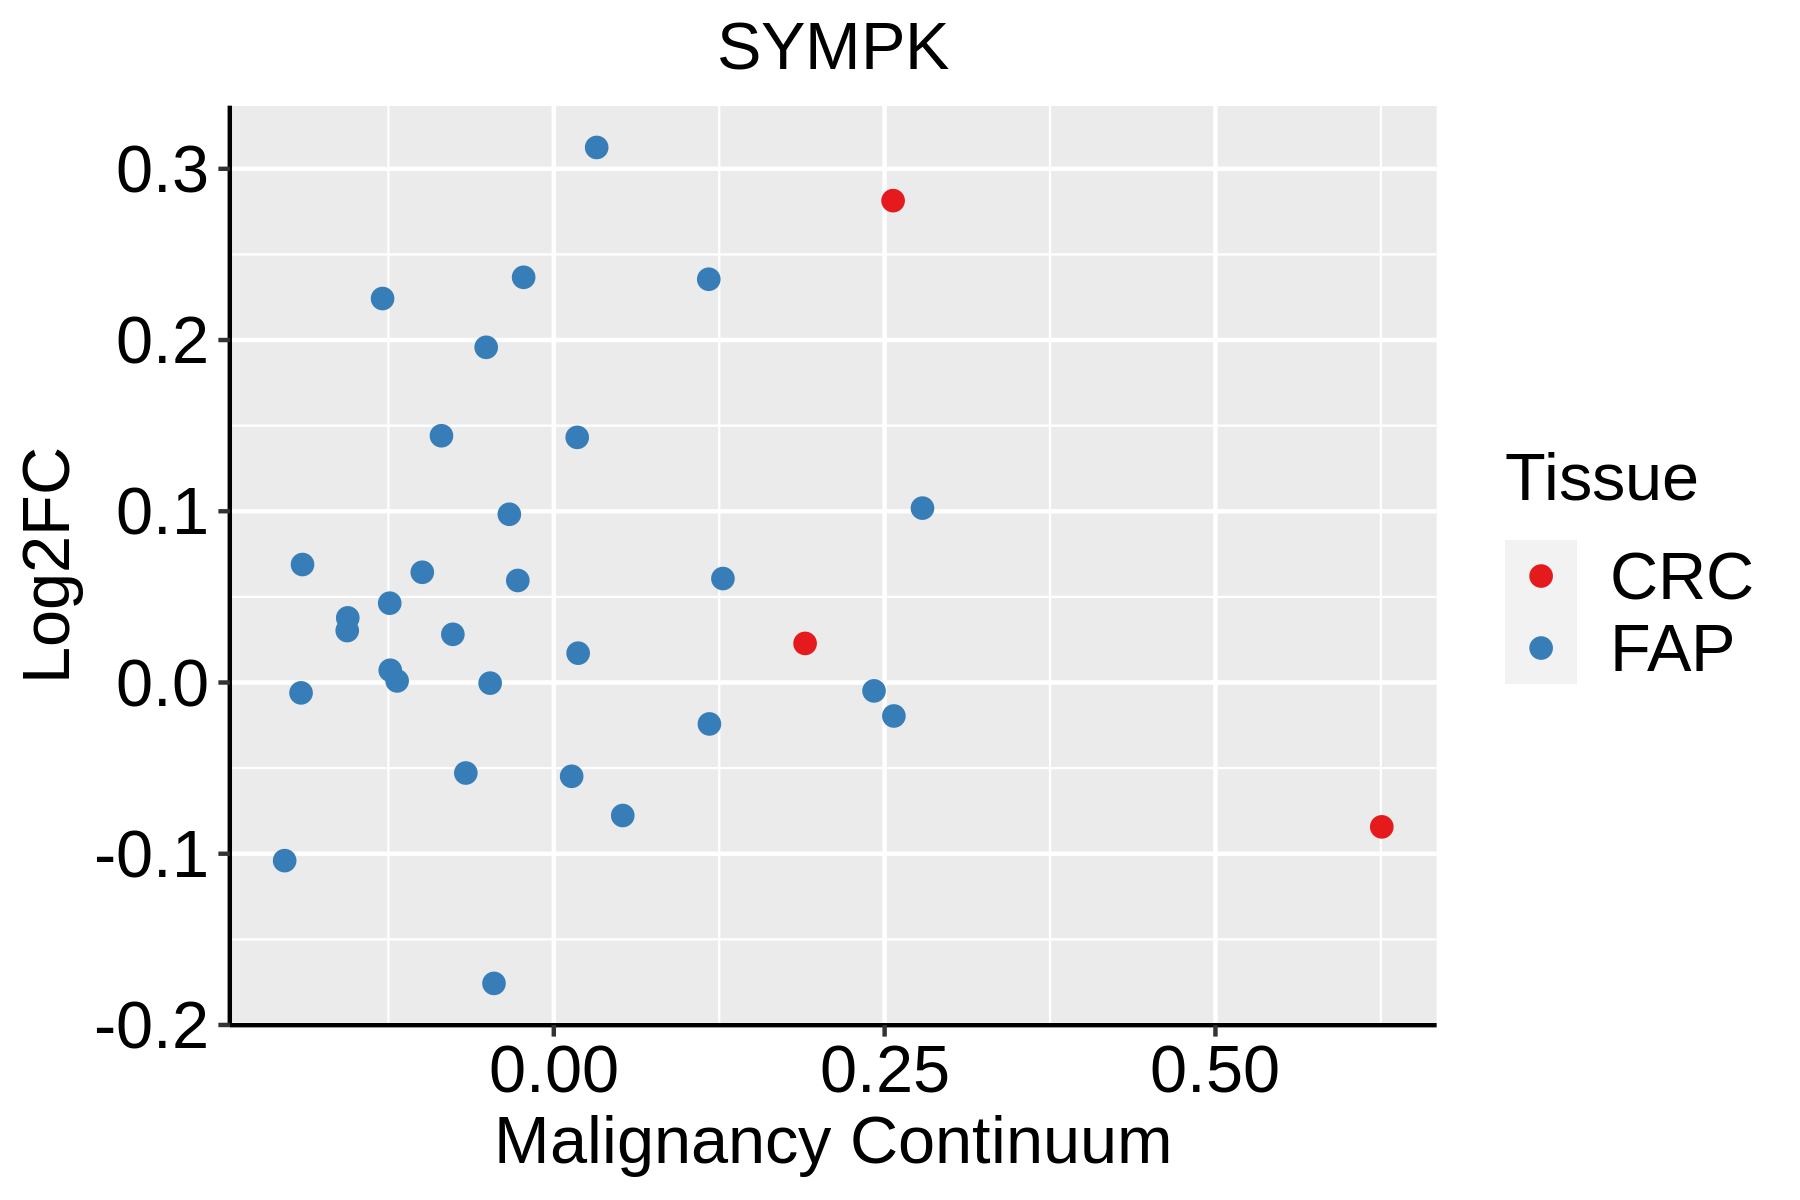 | FAP: Familial adenomatous polyposis |
| CRC: Colorectal cancer | ||
| Colorectum (HTA11) |  | AD: Adenomas |
| SER: Sessile serrated lesions | ||
| MSI-H: Microsatellite-high colorectal cancer | ||
| MSS: Microsatellite stable colorectal cancer | ||
| Esophagus | 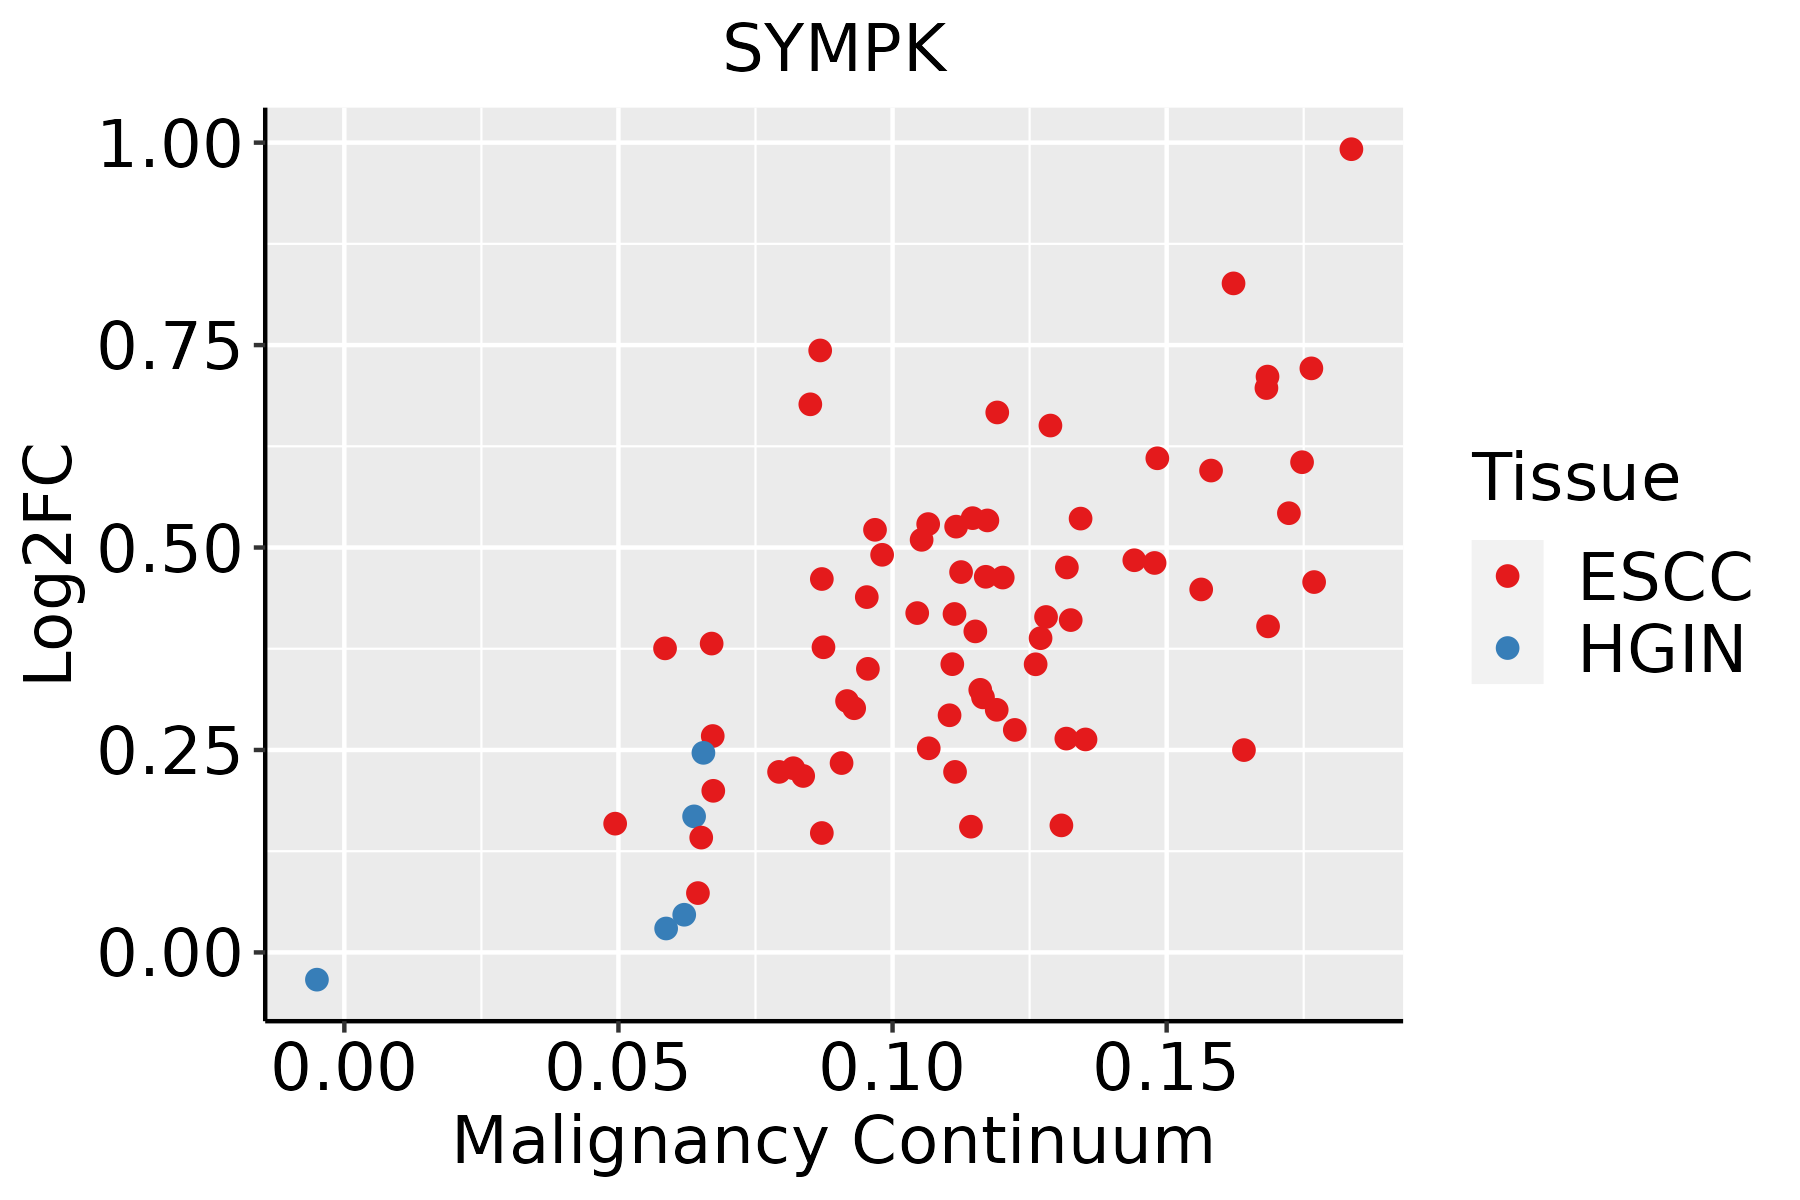 | ESCC: Esophageal squamous cell carcinoma |
| HGIN: High-grade intraepithelial neoplasias | ||
| LGIN: Low-grade intraepithelial neoplasias | ||
| Liver | 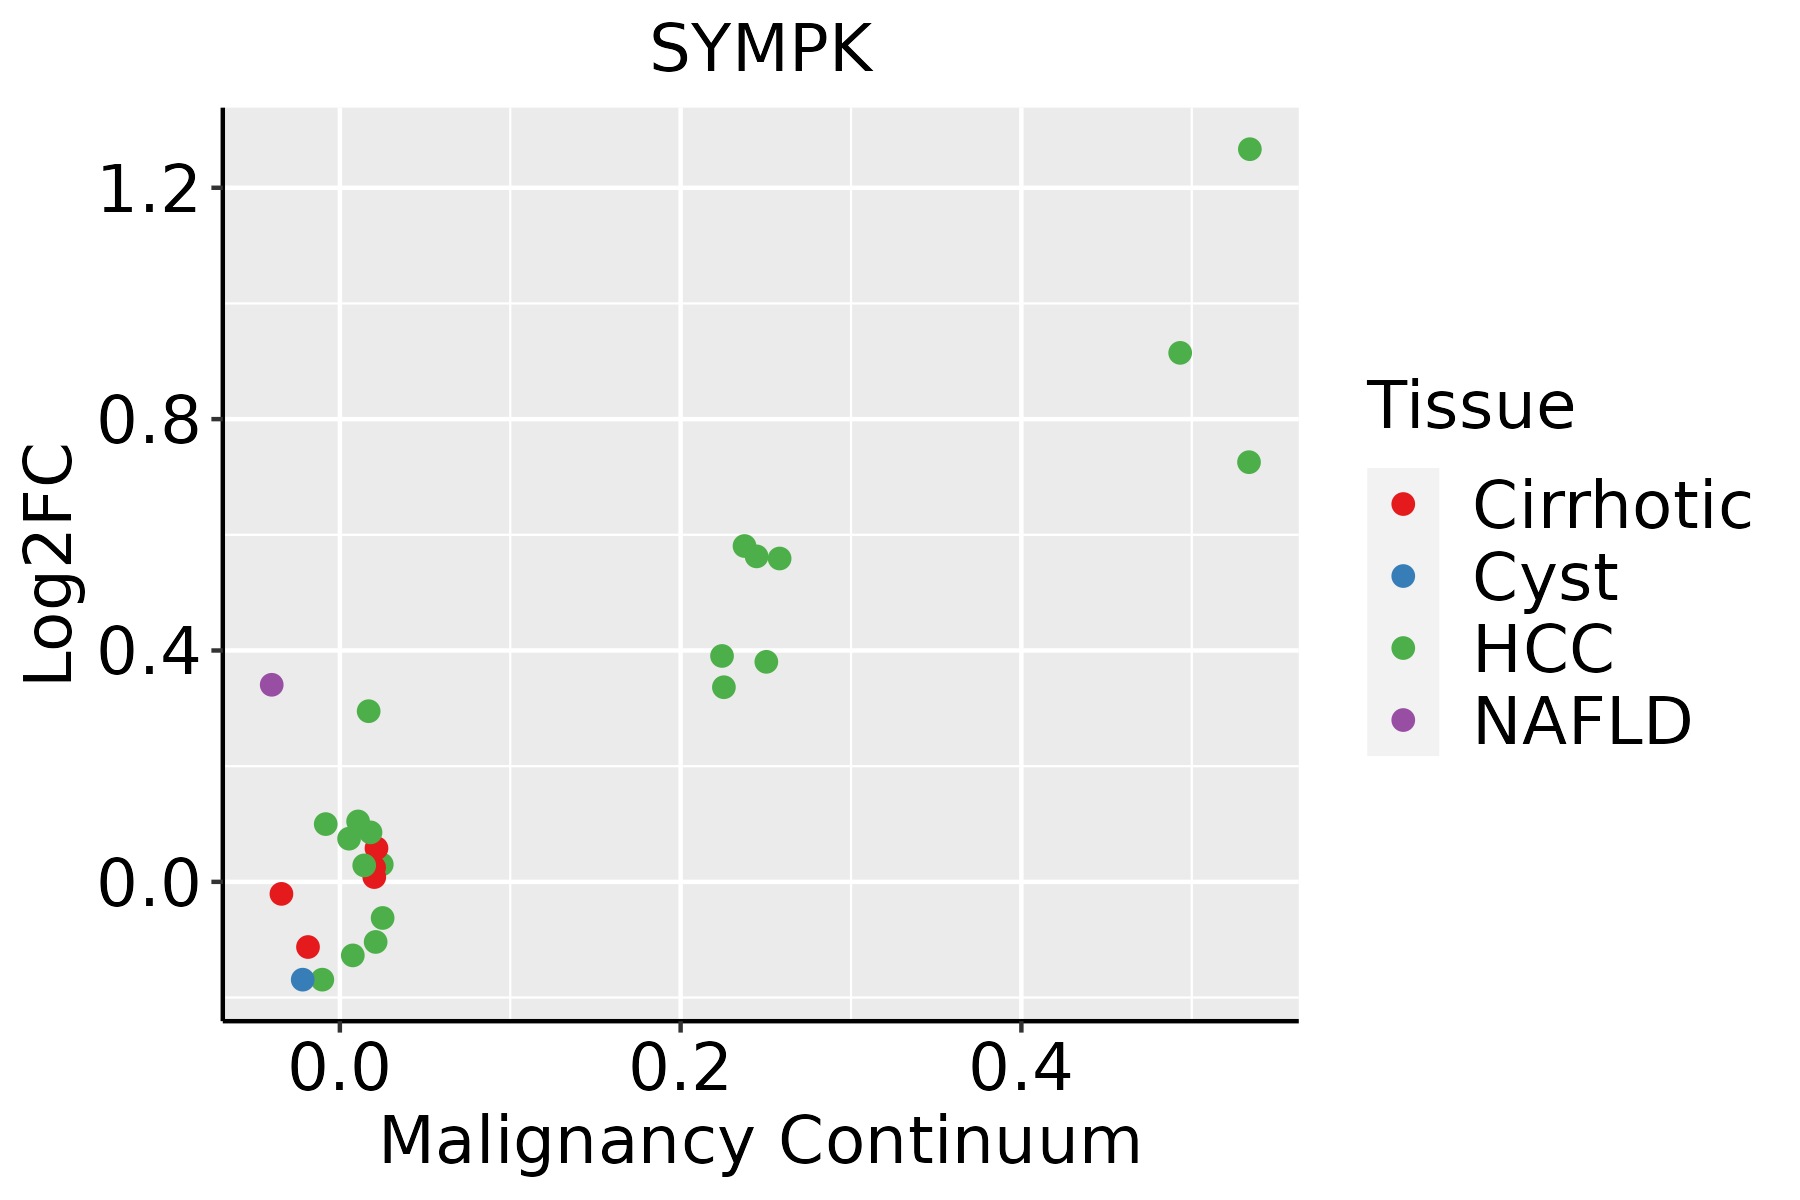 | HCC: Hepatocellular carcinoma |
| NAFLD: Non-alcoholic fatty liver disease | ||
| Oral Cavity | 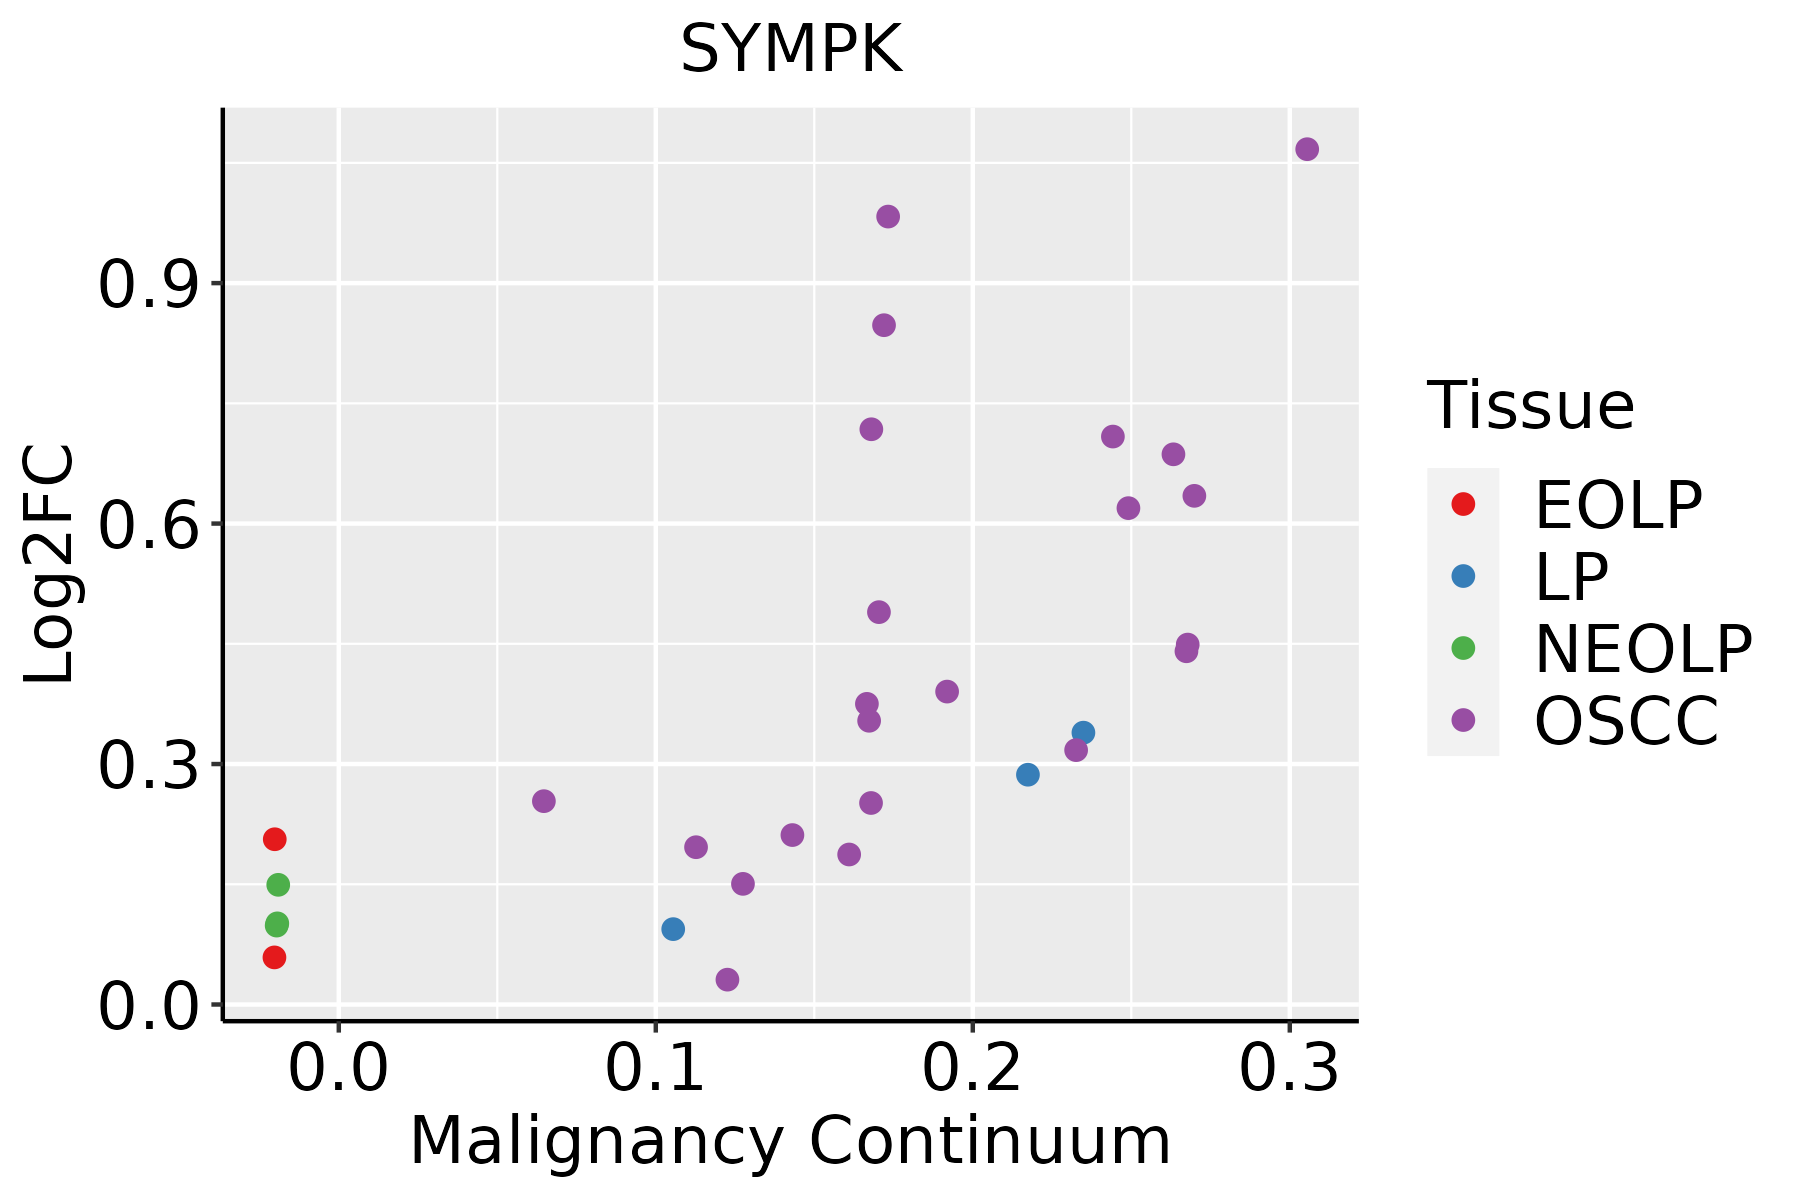 | EOLP: Erosive Oral lichen planus |
| LP: leukoplakia | ||
| NEOLP: Non-erosive oral lichen planus | ||
| OSCC: Oral squamous cell carcinoma | ||
| Thyroid |  | ATC: Anaplastic thyroid cancer |
| HT: Hashimoto's thyroiditis | ||
| PTC: Papillary thyroid cancer |
| ∗log2FC in expression of this searched gene in stem-like cells from each diseased tissue sample relative to stem-like cells in normal samples in each tissue plotted against the malignancy continuum. Samples are colored based on if they are from different disease stage. |
Top |
Malignant transformation related pathway analysis |
| Find out the enriched GO biological processes and KEGG pathways involved in transition from healthy to precancer to cancer |
| Tissue | Disease Stage | Enriched GO biological Processes |
| Colorectum | AD |  |
| Colorectum | SER |  |
| Colorectum | MSS |  |
| Colorectum | MSI-H |  |
| Colorectum | FAP |  |
| ∗Top 15 enriched GO BP terms are showed in the bar plot of each disease state in each tissue. Each row represents a significant GO biological process which is colored according to the -log10(p.adjust). |
| Page: 1 2 3 4 5 6 7 8 9 |
| GO ID | Tissue | Disease Stage | Description | Gene Ratio | Bg Ratio | pvalue | p.adjust | Count |
| GO:0051098 | Colorectum | AD | regulation of binding | 126/3918 | 363/18723 | 6.01e-10 | 4.88e-08 | 126 |
| GO:0043393 | Colorectum | AD | regulation of protein binding | 68/3918 | 196/18723 | 5.17e-06 | 1.34e-04 | 68 |
| GO:0016311 | Colorectum | AD | dephosphorylation | 123/3918 | 417/18723 | 1.84e-05 | 3.82e-04 | 123 |
| GO:0006470 | Colorectum | AD | protein dephosphorylation | 88/3918 | 281/18723 | 2.56e-05 | 4.89e-04 | 88 |
| GO:0035303 | Colorectum | AD | regulation of dephosphorylation | 46/3918 | 128/18723 | 6.20e-05 | 1.04e-03 | 46 |
| GO:0035304 | Colorectum | AD | regulation of protein dephosphorylation | 33/3918 | 90/18723 | 4.23e-04 | 4.77e-03 | 33 |
| GO:0051100 | Colorectum | AD | negative regulation of binding | 50/3918 | 162/18723 | 1.84e-03 | 1.51e-02 | 50 |
| GO:0035306 | Colorectum | AD | positive regulation of dephosphorylation | 22/3918 | 59/18723 | 2.86e-03 | 2.14e-02 | 22 |
| GO:0032091 | Colorectum | AD | negative regulation of protein binding | 30/3918 | 94/18723 | 8.26e-03 | 4.85e-02 | 30 |
| GO:00510982 | Colorectum | MSS | regulation of binding | 113/3467 | 363/18723 | 3.55e-09 | 2.41e-07 | 113 |
| GO:00433932 | Colorectum | MSS | regulation of protein binding | 62/3467 | 196/18723 | 6.44e-06 | 1.69e-04 | 62 |
| GO:00353032 | Colorectum | MSS | regulation of dephosphorylation | 41/3467 | 128/18723 | 1.64e-04 | 2.33e-03 | 41 |
| GO:00353042 | Colorectum | MSS | regulation of protein dephosphorylation | 30/3467 | 90/18723 | 5.58e-04 | 6.19e-03 | 30 |
| GO:00064702 | Colorectum | MSS | protein dephosphorylation | 73/3467 | 281/18723 | 1.15e-03 | 1.12e-02 | 73 |
| GO:00163112 | Colorectum | MSS | dephosphorylation | 101/3467 | 417/18723 | 1.98e-03 | 1.70e-02 | 101 |
| GO:00511002 | Colorectum | MSS | negative regulation of binding | 44/3467 | 162/18723 | 4.26e-03 | 3.04e-02 | 44 |
| GO:00163113 | Colorectum | FAP | dephosphorylation | 95/2622 | 417/18723 | 7.07e-07 | 3.32e-05 | 95 |
| GO:00064704 | Colorectum | FAP | protein dephosphorylation | 69/2622 | 281/18723 | 1.47e-06 | 6.39e-05 | 69 |
| GO:00510984 | Colorectum | FAP | regulation of binding | 81/2622 | 363/18723 | 1.04e-05 | 2.97e-04 | 81 |
| GO:00353034 | Colorectum | FAP | regulation of dephosphorylation | 36/2622 | 128/18723 | 2.22e-05 | 5.28e-04 | 36 |
| Page: 1 2 3 4 5 6 |
| Pathway ID | Tissue | Disease Stage | Description | Gene Ratio | Bg Ratio | pvalue | p.adjust | qvalue | Count |
| hsa045304 | Colorectum | MSS | Tight junction | 66/1875 | 169/8465 | 4.10e-07 | 6.25e-06 | 3.83e-06 | 66 |
| hsa045305 | Colorectum | MSS | Tight junction | 66/1875 | 169/8465 | 4.10e-07 | 6.25e-06 | 3.83e-06 | 66 |
| hsa045308 | Colorectum | FAP | Tight junction | 60/1404 | 169/8465 | 1.40e-09 | 9.33e-08 | 5.67e-08 | 60 |
| hsa030152 | Colorectum | FAP | mRNA surveillance pathway | 26/1404 | 97/8465 | 7.11e-03 | 2.64e-02 | 1.60e-02 | 26 |
| hsa045309 | Colorectum | FAP | Tight junction | 60/1404 | 169/8465 | 1.40e-09 | 9.33e-08 | 5.67e-08 | 60 |
| hsa030153 | Colorectum | FAP | mRNA surveillance pathway | 26/1404 | 97/8465 | 7.11e-03 | 2.64e-02 | 1.60e-02 | 26 |
| hsa0453010 | Colorectum | CRC | Tight junction | 44/1091 | 169/8465 | 2.51e-06 | 7.61e-05 | 5.16e-05 | 44 |
| hsa0453011 | Colorectum | CRC | Tight junction | 44/1091 | 169/8465 | 2.51e-06 | 7.61e-05 | 5.16e-05 | 44 |
| hsa0301524 | Esophagus | ESCC | mRNA surveillance pathway | 72/4205 | 97/8465 | 6.12e-07 | 4.10e-06 | 2.10e-06 | 72 |
| hsa04530211 | Esophagus | ESCC | Tight junction | 105/4205 | 169/8465 | 6.73e-04 | 2.23e-03 | 1.14e-03 | 105 |
| hsa0301534 | Esophagus | ESCC | mRNA surveillance pathway | 72/4205 | 97/8465 | 6.12e-07 | 4.10e-06 | 2.10e-06 | 72 |
| hsa04530310 | Esophagus | ESCC | Tight junction | 105/4205 | 169/8465 | 6.73e-04 | 2.23e-03 | 1.14e-03 | 105 |
| hsa0453042 | Liver | HCC | Tight junction | 110/4020 | 169/8465 | 2.45e-06 | 2.28e-05 | 1.27e-05 | 110 |
| hsa0301521 | Liver | HCC | mRNA surveillance pathway | 66/4020 | 97/8465 | 3.16e-05 | 1.88e-04 | 1.04e-04 | 66 |
| hsa0453052 | Liver | HCC | Tight junction | 110/4020 | 169/8465 | 2.45e-06 | 2.28e-05 | 1.27e-05 | 110 |
| hsa0301531 | Liver | HCC | mRNA surveillance pathway | 66/4020 | 97/8465 | 3.16e-05 | 1.88e-04 | 1.04e-04 | 66 |
| hsa030158 | Oral cavity | OSCC | mRNA surveillance pathway | 75/3704 | 97/8465 | 1.30e-11 | 2.01e-10 | 1.02e-10 | 75 |
| hsa0453030 | Oral cavity | OSCC | Tight junction | 102/3704 | 169/8465 | 8.68e-06 | 3.93e-05 | 2.00e-05 | 102 |
| hsa0301513 | Oral cavity | OSCC | mRNA surveillance pathway | 75/3704 | 97/8465 | 1.30e-11 | 2.01e-10 | 1.02e-10 | 75 |
| hsa04530114 | Oral cavity | OSCC | Tight junction | 102/3704 | 169/8465 | 8.68e-06 | 3.93e-05 | 2.00e-05 | 102 |
| Page: 1 2 |
Top |
Cell-cell communication analysis |
| Identification of potential cell-cell interactions between two cell types and their ligand-receptor pairs for different disease states |
| Ligand | Receptor | LRpair | Pathway | Tissue | Disease Stage |
| Page: 1 |
Top |
Single-cell gene regulatory network inference analysis |
| Find out the significant the regulons (TFs) and the target genes of each regulon across cell types for different disease states |
| TF | Cell Type | Tissue | Disease Stage | Target Gene | RSS | Regulon Activity |
| ∗The dot plots of a searched regulon are shown for all cell subpopulations in each disease state of each tissue based on the regulon specific score inferred using pySCENIC and by calculating the average expression. |
| Page: 1 |
Top |
Somatic mutation of malignant transformation related genes |
| Annotation of somatic variants for genes involved in malignant transformation |
| Hugo Symbol | Variant Class | Variant Classification | dbSNP RS | HGVSc | HGVSp | HGVSp Short | SWISSPROT | BIOTYPE | SIFT | PolyPhen | Tumor Sample Barcode | Tissue | Histology | Sex | Age | Stage | Therapy Types | Drugs | Outcome |
| SYMPK | SNV | Missense_Mutation | novel | c.817G>A | p.Glu273Lys | p.E273K | Q92797 | protein_coding | tolerated(0.5) | benign(0.028) | TCGA-A2-A0CR-01 | Breast | breast invasive carcinoma | Female | <65 | I/II | Chemotherapy | adriamycin | CR |
| SYMPK | SNV | Missense_Mutation | c.1895C>A | p.Ala632Asp | p.A632D | Q92797 | protein_coding | tolerated(0.15) | benign(0.007) | TCGA-A8-A09W-01 | Breast | breast invasive carcinoma | Female | >=65 | III/IV | Unknown | Unknown | SD | |
| SYMPK | SNV | Missense_Mutation | c.1467N>G | p.Ile489Met | p.I489M | Q92797 | protein_coding | tolerated(0.14) | probably_damaging(0.986) | TCGA-AC-A23H-01 | Breast | breast invasive carcinoma | Female | >=65 | I/II | Unknown | Unknown | PD | |
| SYMPK | SNV | Missense_Mutation | c.2877N>A | p.Met959Ile | p.M959I | Q92797 | protein_coding | deleterious(0.02) | benign(0.007) | TCGA-AN-A0XW-01 | Breast | breast invasive carcinoma | Female | <65 | III/IV | Unknown | Unknown | SD | |
| SYMPK | SNV | Missense_Mutation | rs145063068 | c.2126N>A | p.Arg709His | p.R709H | Q92797 | protein_coding | deleterious(0.01) | benign(0.302) | TCGA-AO-A03O-01 | Breast | breast invasive carcinoma | Female | >=65 | I/II | Chemotherapy | doxorubicin | SD |
| SYMPK | SNV | Missense_Mutation | rs111641417 | c.1139N>T | p.Ser380Leu | p.S380L | Q92797 | protein_coding | tolerated(0.32) | benign(0) | TCGA-BH-A1FU-01 | Breast | breast invasive carcinoma | Female | <65 | I/II | Unknown | Unknown | PD |
| SYMPK | SNV | Missense_Mutation | c.3050T>A | p.Met1017Lys | p.M1017K | Q92797 | protein_coding | deleterious(0) | possibly_damaging(0.78) | TCGA-E2-A14R-01 | Breast | breast invasive carcinoma | Female | <65 | I/II | Chemotherapy | doxorubicin | PD | |
| SYMPK | SNV | Missense_Mutation | novel | c.2026N>A | p.Glu676Lys | p.E676K | Q92797 | protein_coding | deleterious(0.04) | benign(0.003) | TCGA-C5-A2M1-01 | Cervix | cervical & endocervical cancer | Female | <65 | I/II | Unknown | Unknown | SD |
| SYMPK | SNV | Missense_Mutation | c.1180N>C | p.Asp394His | p.D394H | Q92797 | protein_coding | tolerated(0.2) | benign(0.125) | TCGA-DS-A0VM-01 | Cervix | cervical & endocervical cancer | Female | <65 | I/II | Chemotherapy | cisplatin | PD | |
| SYMPK | SNV | Missense_Mutation | novel | c.258N>G | p.Ile86Met | p.I86M | Q92797 | protein_coding | tolerated(0.29) | benign(0.044) | TCGA-DS-A1OB-01 | Cervix | cervical & endocervical cancer | Female | <65 | I/II | Chemotherapy | carboplatin | PD |
| Page: 1 2 3 4 5 6 7 8 9 10 11 12 13 |
Top |
Related drugs of malignant transformation related genes |
| Identification of chemicals and drugs interact with genes involved in malignant transfromation |
| (DGIdb 4.0) |
| Entrez ID | Symbol | Category | Interaction Types | Drug Claim Name | Drug Name | PMIDs |
| Page: 1 |

Copyright 2023-Present -The University of Texas Health Science Center at Houston |