
|
|||||
|
 | |
| |
| |
| |
| |
| |
|
Gene: SUMF1 |
Gene summary for SUMF1 |
| Gene information | Species | Human | Gene symbol | SUMF1 | Gene ID | 285362 |
| Gene name | sulfatase modifying factor 1 | |
| Gene Alias | AAPA3037 | |
| Cytomap | 3p26.1 | |
| Gene Type | protein-coding | GO ID | GO:0006464 | UniProtAcc | Q8NBK3 |
Top |
Malignant transformation analysis |
| Identification of the aberrant gene expression in precancerous and cancerous lesions by comparing the gene expression of stem-like cells in diseased tissues with normal stem cells |
| Entrez ID | Symbol | Replicates | Species | Organ | Tissue | Adj P-value | Log2FC | Malignancy |
| 285362 | SUMF1 | RNA-P25T1-P25T1-3 | Human | Lung | AIS | 9.74e-04 | 5.28e-01 | -0.2107 |
| 285362 | SUMF1 | RNA-P25T1-P25T1-4 | Human | Lung | AIS | 2.65e-09 | 5.45e-01 | -0.2119 |
| 285362 | SUMF1 | RNA-P3T-P3T-1 | Human | Lung | IAC | 2.18e-04 | 4.60e-01 | 0.1829 |
| 285362 | SUMF1 | RNA-P6T2-P6T2-1 | Human | Lung | IAC | 1.00e-09 | 3.54e-01 | -0.0166 |
| 285362 | SUMF1 | RNA-P6T2-P6T2-2 | Human | Lung | IAC | 9.82e-17 | 5.29e-01 | -0.0132 |
| 285362 | SUMF1 | RNA-P6T2-P6T2-3 | Human | Lung | IAC | 2.86e-20 | 5.02e-01 | -0.013 |
| 285362 | SUMF1 | RNA-P6T2-P6T2-4 | Human | Lung | IAC | 3.95e-10 | 3.49e-01 | -0.0121 |
| 285362 | SUMF1 | RNA-P7T1-P7T1-3 | Human | Lung | AIS | 2.24e-02 | 4.65e-01 | -0.0822 |
| 285362 | SUMF1 | RNA-P7T1-P7T1-4 | Human | Lung | AIS | 1.29e-02 | 3.72e-01 | -0.0809 |
| 285362 | SUMF1 | C04 | Human | Oral cavity | OSCC | 2.16e-06 | 4.48e-01 | 0.2633 |
| 285362 | SUMF1 | C21 | Human | Oral cavity | OSCC | 1.74e-05 | 4.02e-01 | 0.2678 |
| 285362 | SUMF1 | C30 | Human | Oral cavity | OSCC | 9.68e-15 | 7.37e-01 | 0.3055 |
| 285362 | SUMF1 | C43 | Human | Oral cavity | OSCC | 4.68e-07 | 7.81e-02 | 0.1704 |
| 285362 | SUMF1 | C46 | Human | Oral cavity | OSCC | 1.14e-03 | 2.68e-01 | 0.1673 |
| 285362 | SUMF1 | C51 | Human | Oral cavity | OSCC | 7.77e-07 | 4.65e-01 | 0.2674 |
| 285362 | SUMF1 | C57 | Human | Oral cavity | OSCC | 1.47e-02 | 2.62e-01 | 0.1679 |
| 285362 | SUMF1 | C08 | Human | Oral cavity | OSCC | 7.95e-06 | 8.58e-02 | 0.1919 |
| 285362 | SUMF1 | C09 | Human | Oral cavity | OSCC | 6.52e-04 | 3.28e-01 | 0.1431 |
| 285362 | SUMF1 | LN22 | Human | Oral cavity | OSCC | 1.17e-03 | 6.07e-01 | 0.1733 |
| 285362 | SUMF1 | LP15 | Human | Oral cavity | LP | 3.25e-05 | 1.04e+00 | 0.2174 |
| Page: 1 2 3 4 5 6 7 8 |
| Tissue | Expression Dynamics | Abbreviation |
| Colorectum (GSE201348) |  | FAP: Familial adenomatous polyposis |
| CRC: Colorectal cancer | ||
| Colorectum (HTA11) |  | AD: Adenomas |
| SER: Sessile serrated lesions | ||
| MSI-H: Microsatellite-high colorectal cancer | ||
| MSS: Microsatellite stable colorectal cancer | ||
| Endometrium | 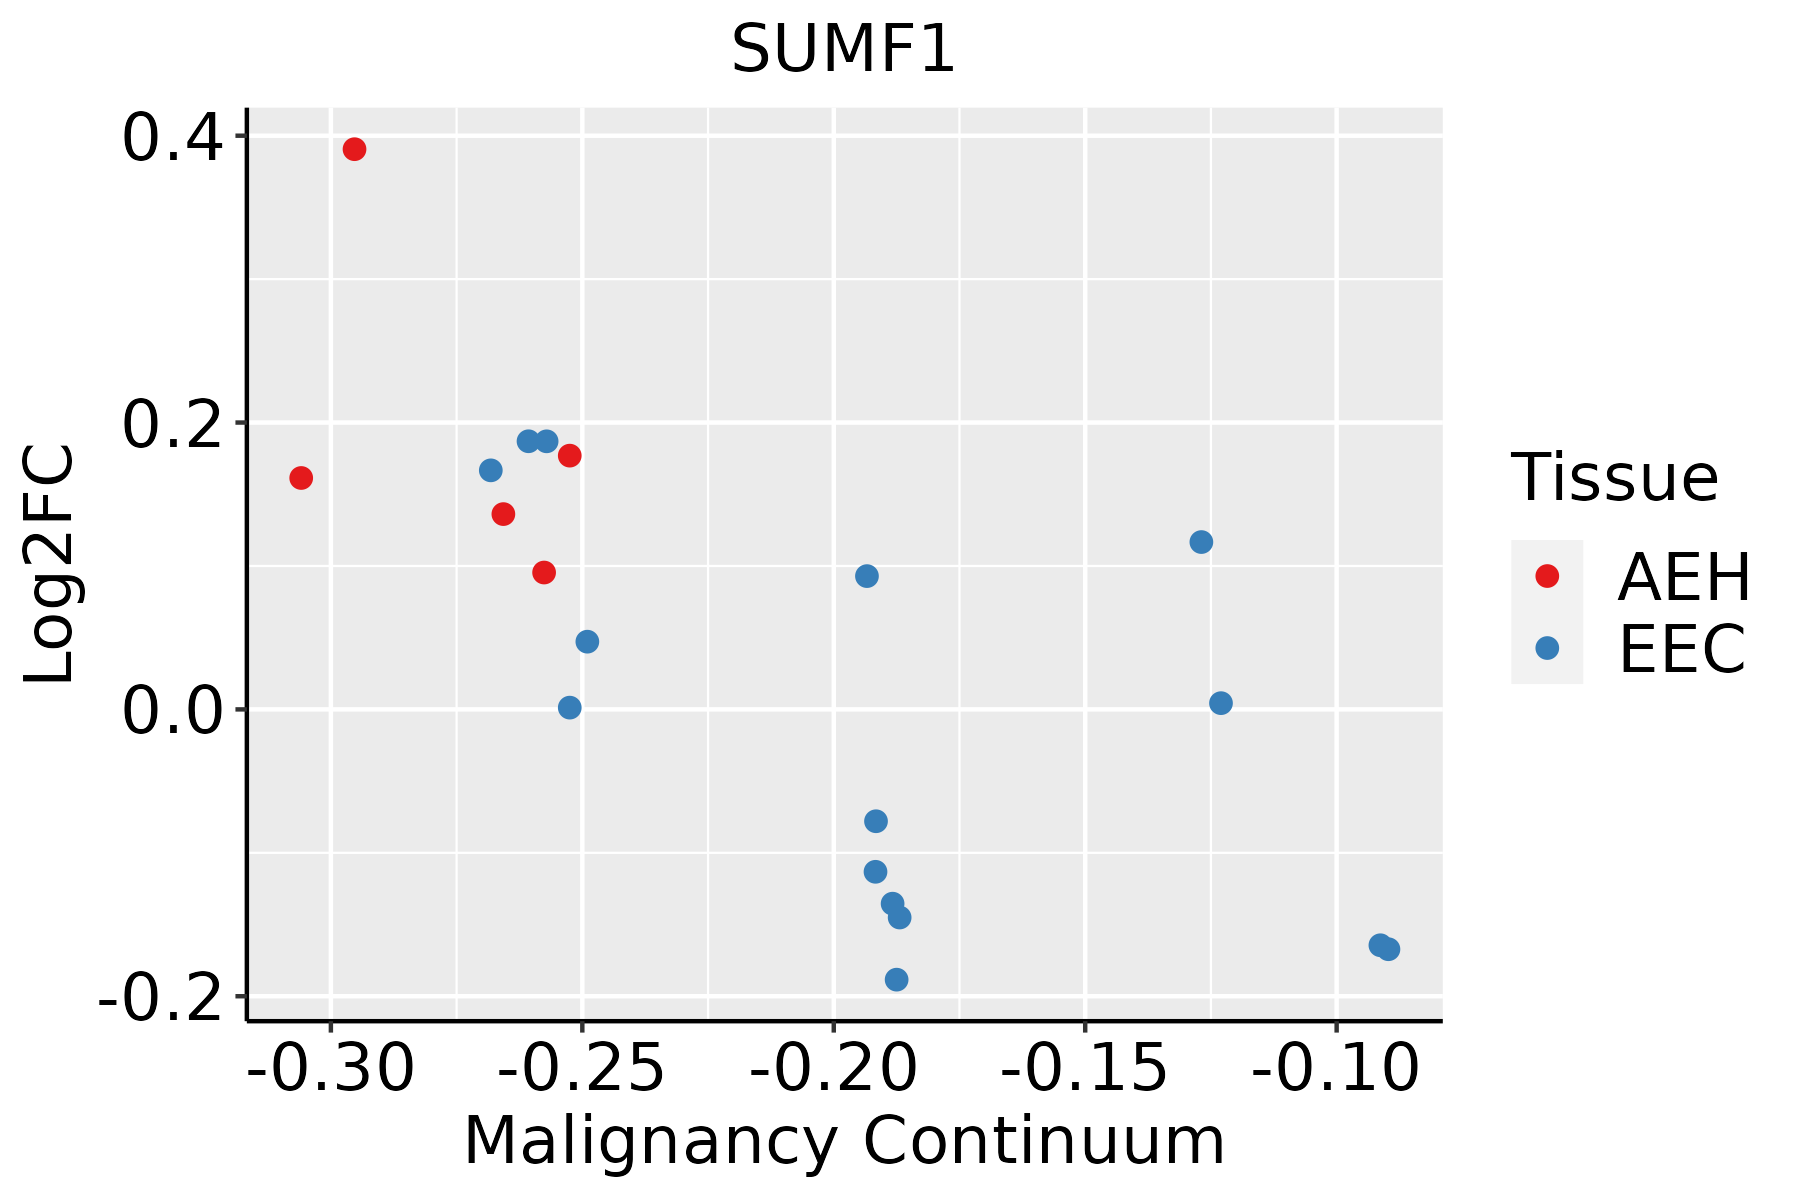 | AEH: Atypical endometrial hyperplasia |
| EEC: Endometrioid Cancer | ||
| Esophagus | 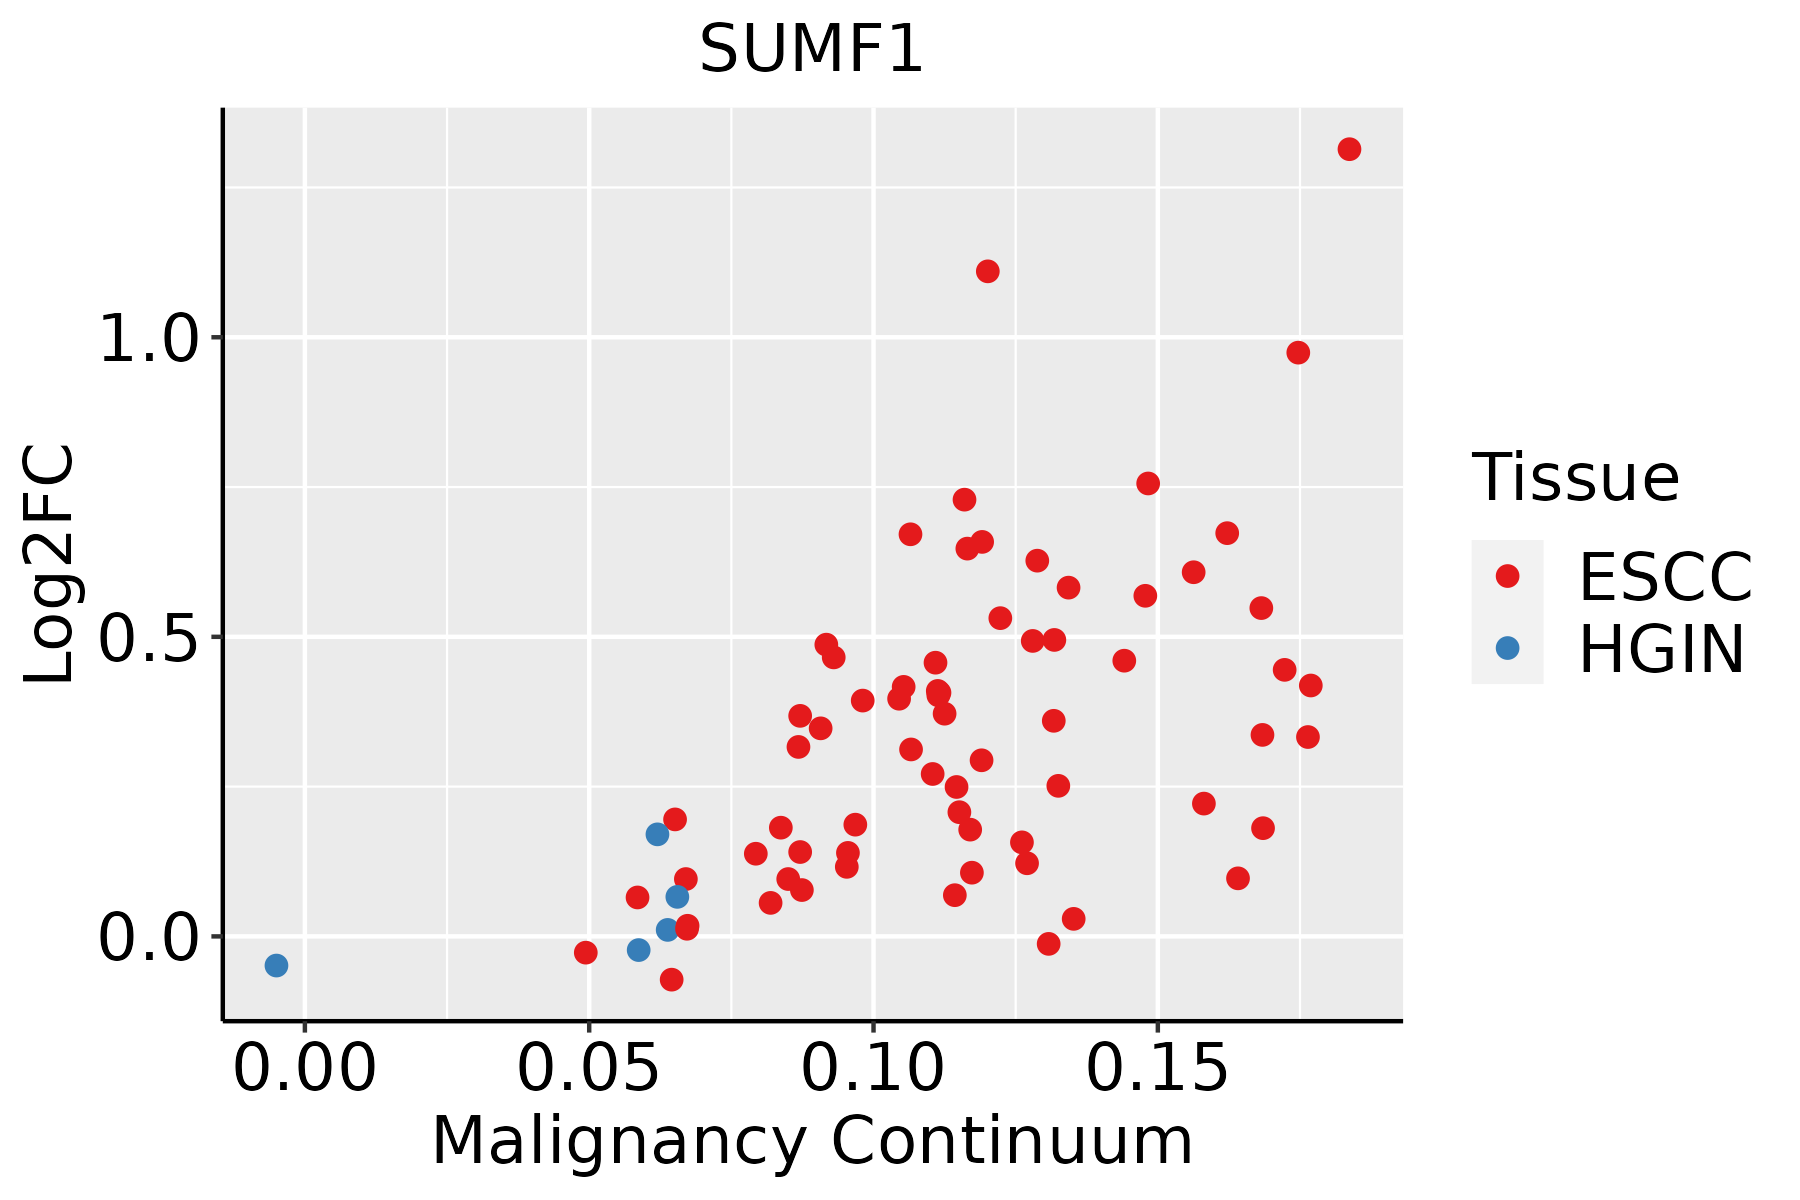 | ESCC: Esophageal squamous cell carcinoma |
| HGIN: High-grade intraepithelial neoplasias | ||
| LGIN: Low-grade intraepithelial neoplasias | ||
| Liver | 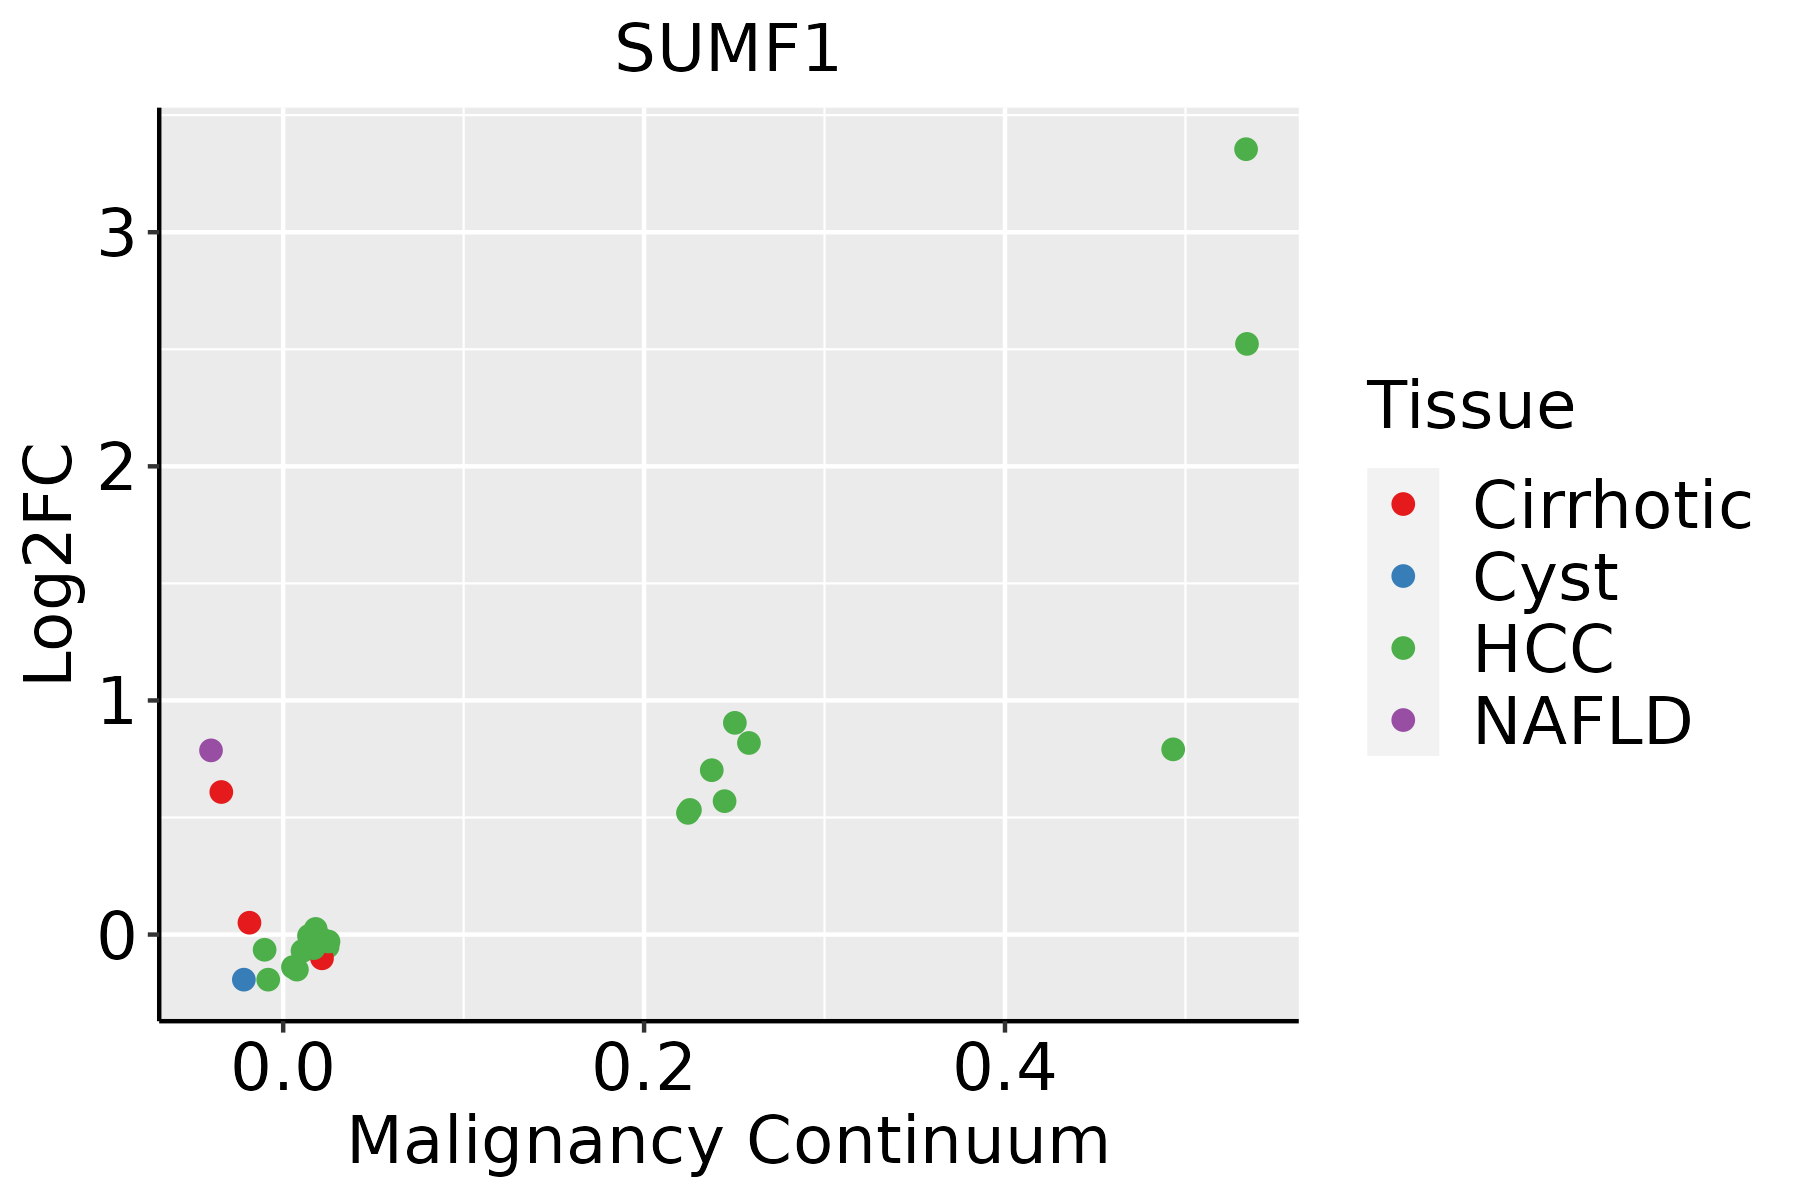 | HCC: Hepatocellular carcinoma |
| NAFLD: Non-alcoholic fatty liver disease | ||
| Lung |  | AAH: Atypical adenomatous hyperplasia |
| AIS: Adenocarcinoma in situ | ||
| IAC: Invasive lung adenocarcinoma | ||
| MIA: Minimally invasive adenocarcinoma | ||
| Oral Cavity | 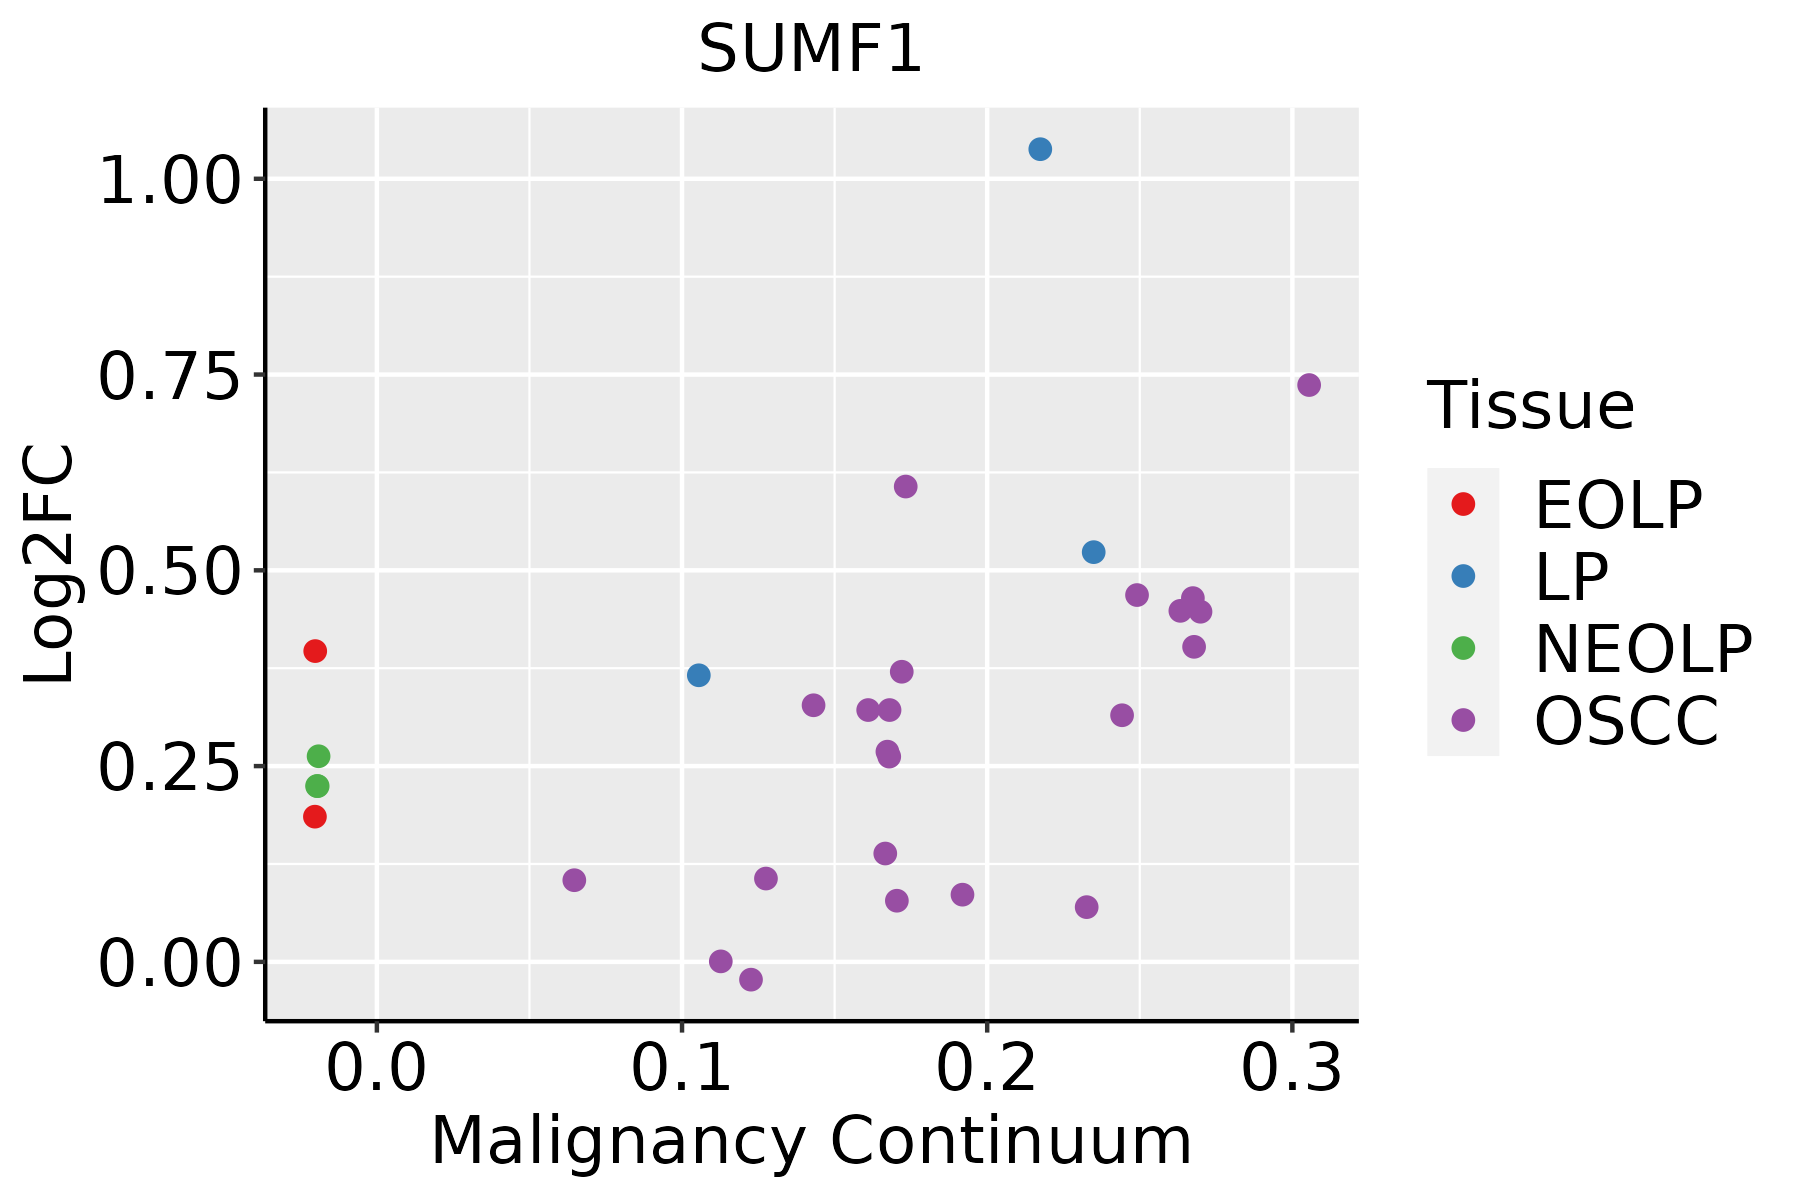 | EOLP: Erosive Oral lichen planus |
| LP: leukoplakia | ||
| NEOLP: Non-erosive oral lichen planus | ||
| OSCC: Oral squamous cell carcinoma |
| ∗log2FC in expression of this searched gene in stem-like cells from each diseased tissue sample relative to stem-like cells in normal samples in each tissue plotted against the malignancy continuum. Samples are colored based on if they are from different disease stage. |
Top |
Malignant transformation related pathway analysis |
| Find out the enriched GO biological processes and KEGG pathways involved in transition from healthy to precancer to cancer |
| Tissue | Disease Stage | Enriched GO biological Processes |
| Colorectum | AD |  |
| Colorectum | SER |  |
| Colorectum | MSS |  |
| Colorectum | MSI-H |  |
| Colorectum | FAP |  |
| ∗Top 15 enriched GO BP terms are showed in the bar plot of each disease state in each tissue. Each row represents a significant GO biological process which is colored according to the -log10(p.adjust). |
| Page: 1 2 3 4 5 6 7 8 9 |
| GO ID | Tissue | Disease Stage | Description | Gene Ratio | Bg Ratio | pvalue | p.adjust | Count |
| GO:00066433 | Esophagus | ESCC | membrane lipid metabolic process | 130/8552 | 203/18723 | 9.29e-08 | 1.54e-06 | 130 |
| GO:00066652 | Esophagus | ESCC | sphingolipid metabolic process | 96/8552 | 155/18723 | 3.21e-05 | 2.66e-04 | 96 |
| GO:00066642 | Esophagus | ESCC | glycolipid metabolic process | 63/8552 | 100/18723 | 3.55e-04 | 2.06e-03 | 63 |
| GO:19035092 | Esophagus | ESCC | liposaccharide metabolic process | 63/8552 | 101/18723 | 5.25e-04 | 2.90e-03 | 63 |
| GO:0006643 | Liver | Cirrhotic | membrane lipid metabolic process | 69/4634 | 203/18723 | 1.89e-03 | 1.19e-02 | 69 |
| GO:00066431 | Liver | HCC | membrane lipid metabolic process | 115/7958 | 203/18723 | 3.17e-05 | 3.22e-04 | 115 |
| GO:0006665 | Liver | HCC | sphingolipid metabolic process | 85/7958 | 155/18723 | 1.27e-03 | 6.92e-03 | 85 |
| GO:0006664 | Liver | HCC | glycolipid metabolic process | 57/7958 | 100/18723 | 2.40e-03 | 1.17e-02 | 57 |
| GO:1903509 | Liver | HCC | liposaccharide metabolic process | 57/7958 | 101/18723 | 3.25e-03 | 1.49e-02 | 57 |
| GO:0043687 | Liver | HCC | post-translational protein modification | 24/7958 | 37/18723 | 5.03e-03 | 2.11e-02 | 24 |
| GO:00066432 | Oral cavity | OSCC | membrane lipid metabolic process | 111/7305 | 203/18723 | 4.02e-06 | 4.69e-05 | 111 |
| GO:00066651 | Oral cavity | OSCC | sphingolipid metabolic process | 84/7305 | 155/18723 | 8.64e-05 | 6.61e-04 | 84 |
| GO:00066641 | Oral cavity | OSCC | glycolipid metabolic process | 53/7305 | 100/18723 | 3.09e-03 | 1.33e-02 | 53 |
| GO:19035091 | Oral cavity | OSCC | liposaccharide metabolic process | 53/7305 | 101/18723 | 4.06e-03 | 1.66e-02 | 53 |
| GO:000664311 | Oral cavity | LP | membrane lipid metabolic process | 69/4623 | 203/18723 | 1.77e-03 | 1.34e-02 | 69 |
| Page: 1 |
| Pathway ID | Tissue | Disease Stage | Description | Gene Ratio | Bg Ratio | pvalue | p.adjust | qvalue | Count |
| hsa04142 | Colorectum | SER | Lysosome | 38/1580 | 132/8465 | 2.87e-03 | 2.03e-02 | 1.47e-02 | 38 |
| hsa041421 | Colorectum | SER | Lysosome | 38/1580 | 132/8465 | 2.87e-03 | 2.03e-02 | 1.47e-02 | 38 |
| hsa0414222 | Esophagus | ESCC | Lysosome | 102/4205 | 132/8465 | 5.11e-11 | 7.13e-10 | 3.65e-10 | 102 |
| hsa0414232 | Esophagus | ESCC | Lysosome | 102/4205 | 132/8465 | 5.11e-11 | 7.13e-10 | 3.65e-10 | 102 |
| hsa041424 | Liver | Cirrhotic | Lysosome | 68/2530 | 132/8465 | 1.34e-07 | 1.97e-06 | 1.21e-06 | 68 |
| hsa0414211 | Liver | Cirrhotic | Lysosome | 68/2530 | 132/8465 | 1.34e-07 | 1.97e-06 | 1.21e-06 | 68 |
| hsa041422 | Liver | HCC | Lysosome | 100/4020 | 132/8465 | 2.32e-11 | 4.31e-10 | 2.40e-10 | 100 |
| hsa041423 | Liver | HCC | Lysosome | 100/4020 | 132/8465 | 2.32e-11 | 4.31e-10 | 2.40e-10 | 100 |
| hsa041425 | Oral cavity | OSCC | Lysosome | 87/3704 | 132/8465 | 1.97e-07 | 1.35e-06 | 6.86e-07 | 87 |
| hsa0414212 | Oral cavity | OSCC | Lysosome | 87/3704 | 132/8465 | 1.97e-07 | 1.35e-06 | 6.86e-07 | 87 |
| hsa0414221 | Oral cavity | LP | Lysosome | 67/2418 | 132/8465 | 5.13e-08 | 7.77e-07 | 5.01e-07 | 67 |
| hsa0414231 | Oral cavity | LP | Lysosome | 67/2418 | 132/8465 | 5.13e-08 | 7.77e-07 | 5.01e-07 | 67 |
| Page: 1 |
Top |
Cell-cell communication analysis |
| Identification of potential cell-cell interactions between two cell types and their ligand-receptor pairs for different disease states |
| Ligand | Receptor | LRpair | Pathway | Tissue | Disease Stage |
| Page: 1 |
Top |
Single-cell gene regulatory network inference analysis |
| Find out the significant the regulons (TFs) and the target genes of each regulon across cell types for different disease states |
| TF | Cell Type | Tissue | Disease Stage | Target Gene | RSS | Regulon Activity |
| ∗The dot plots of a searched regulon are shown for all cell subpopulations in each disease state of each tissue based on the regulon specific score inferred using pySCENIC and by calculating the average expression. |
| Page: 1 |
Top |
Somatic mutation of malignant transformation related genes |
| Annotation of somatic variants for genes involved in malignant transformation |
| Hugo Symbol | Variant Class | Variant Classification | dbSNP RS | HGVSc | HGVSp | HGVSp Short | SWISSPROT | BIOTYPE | SIFT | PolyPhen | Tumor Sample Barcode | Tissue | Histology | Sex | Age | Stage | Therapy Types | Drugs | Outcome |
| SUMF1 | SNV | Missense_Mutation | c.925N>T | p.His309Tyr | p.H309Y | Q8NBK3 | protein_coding | tolerated(0.43) | benign(0) | TCGA-AC-A23H-01 | Breast | breast invasive carcinoma | Female | >=65 | I/II | Unknown | Unknown | PD | |
| SUMF1 | SNV | Missense_Mutation | novel | c.1169G>A | p.Gly390Asp | p.G390D | nonsense_mediated_decay | unknown(0) | TCGA-2W-A8YY-01 | Cervix | cervical & endocervical cancer | Female | <65 | I/II | Chemotherapy | cisplatin | CR | ||
| SUMF1 | SNV | Missense_Mutation | c.734C>G | p.Pro245Arg | p.P245R | Q8NBK3 | protein_coding | deleterious(0) | probably_damaging(1) | TCGA-C5-A1BL-01 | Cervix | cervical & endocervical cancer | Female | <65 | I/II | Unknown | Unknown | SD | |
| SUMF1 | SNV | Missense_Mutation | rs147405528 | c.1105N>T | p.Arg369Cys | p.R369C | Q8NBK3 | protein_coding | deleterious(0.03) | benign(0.001) | TCGA-EA-A410-01 | Cervix | cervical & endocervical cancer | Female | <65 | I/II | Unknown | Unknown | SD |
| SUMF1 | SNV | Missense_Mutation | c.202N>T | p.His68Tyr | p.H68Y | Q8NBK3 | protein_coding | tolerated(0.5) | benign(0.025) | TCGA-LP-A4AV-01 | Cervix | cervical & endocervical cancer | Female | <65 | I/II | Unknown | Unknown | SD | |
| SUMF1 | SNV | Missense_Mutation | novel | c.319N>G | p.Gln107Glu | p.Q107E | Q8NBK3 | protein_coding | tolerated(0.58) | benign(0) | TCGA-VS-A958-01 | Cervix | cervical & endocervical cancer | Female | <65 | I/II | Chemotherapy | cisplatin | CR |
| SUMF1 | SNV | Missense_Mutation | c.598N>T | p.His200Tyr | p.H200Y | Q8NBK3 | protein_coding | deleterious(0.04) | benign(0.001) | TCGA-AA-3837-01 | Colorectum | colon adenocarcinoma | Male | >=65 | I/II | Unknown | Unknown | SD | |
| SUMF1 | SNV | Missense_Mutation | novel | c.305N>A | p.Gly102Asp | p.G102D | Q8NBK3 | protein_coding | deleterious(0) | probably_damaging(1) | TCGA-AA-A00N-01 | Colorectum | colon adenocarcinoma | Male | >=65 | I/II | Unknown | Unknown | PD |
| SUMF1 | SNV | Missense_Mutation | c.629C>T | p.Ser210Phe | p.S210F | Q8NBK3 | protein_coding | deleterious(0) | probably_damaging(0.999) | TCGA-CK-4951-01 | Colorectum | colon adenocarcinoma | Female | >=65 | I/II | Unknown | Unknown | PD | |
| SUMF1 | SNV | Missense_Mutation | c.274N>T | p.Val92Phe | p.V92F | Q8NBK3 | protein_coding | deleterious(0.01) | probably_damaging(0.964) | TCGA-AP-A051-01 | Endometrium | uterine corpus endometrioid carcinoma | Female | >=65 | I/II | Unknown | Unknown | SD |
| Page: 1 2 3 4 |
Top |
Related drugs of malignant transformation related genes |
| Identification of chemicals and drugs interact with genes involved in malignant transfromation |
| (DGIdb 4.0) |
| Entrez ID | Symbol | Category | Interaction Types | Drug Claim Name | Drug Name | PMIDs |
| Page: 1 |

Copyright 2023-Present -The University of Texas Health Science Center at Houston |